
A subscription to JoVE is required to view this content. Sign in or start your free trial.
Method Article
Measurement of H2S in Crude Oil and Crude Oil Headspace Using Multidimensional Gas Chromatography, Deans Switching and Sulfur-selective Detection
In This Article
Summary
A multidimensional gas chromatography method for the analysis of dissolved hydrogen sulfide in liquid crude oil samples is presented. A Deans switch is used to heart-cut light sulfur gases for separation on a secondary column and detection on a sulfur chemiluminescence detector.
Abstract
A method for the analysis of dissolved hydrogen sulfide in crude oil samples is demonstrated using gas chromatography. In order to effectively eliminate interferences, a two dimensional column configuration is used, with a Deans switch employed to transfer hydrogen sulfide from the first to the second column (heart-cutting). Liquid crude samples are first separated on a dimethylpolysiloxane column, and light gases are heart-cut and further separated on a bonded porous layer open tubular (PLOT) column that is able to separate hydrogen sulfide from other light sulfur species. Hydrogen sulfide is then detected with a sulfur chemiluminescence detector, adding an additional layer of selectivity. Following separation and detection of hydrogen sulfide, the system is backflushed to remove the high-boiling hydrocarbons present in the crude samples and to preserve chromatographic integrity. Dissolved hydrogen sulfide has been quantified in liquid samples from 1.1 to 500 ppm, demonstrating wide applicability to a range of samples. The method has also been successfully applied for the analysis of gas samples from crude oil headspace and process gas bags, with measurement from 0.7 to 9,700 ppm hydrogen sulfide.
Introduction
Accurate analysis of crude oil is essential for the oil and gas industry, as health and safety regulations and economics are functions of oil quality. In order to protect transporters of crude samples, it is necessary to determine the properties of crude samples to develop safety regulations to be implemented in the event of a release or spill. In particular, quantification of hydrogen sulfide (H2S) is important, due to its high toxicity in the gas phase; exposures as low as 100 ppm can be fatal (http://www.cdc.gov/niosh/idlh/7783064.html)1,2. Dissolved H2S in crude samples is generally considered to be corrosive3,4, and can deactivate catalysts used to treat the oil5-7. Removal of H2S from crude oil streams is ideal, but without a method to measure dissolved H2S, it is difficult to assess the success of removal treatments. For these reasons, this protocol was developed to measure dissolved H2S in heavy crude oil samples such as Canadian oil sands crudes.
A number of standard methods exist for quantification of H2S in lighter petroleum or fuel based samples, but none have been validated for use with the heavier crudes commonly extracted from the Canadian oil sands. H2S and mercaptans are determined using a titration technique by Universal Oil Products (UOP) method 1638, but this method suffers from user-interpretation bias that results from manual reading of titration curves. Institute of Petroleum (IP) method 570 uses a specialty H2S analyzer that heats fuel oil samples9, and benefits from simplicity and portability, but lacks accuracy with heavier samples10. The American Society for Testing and Materials (ASTM) method D5623 uses gas chromatography (GC) with cryogenic cooling and sulfur selective detection to measure H2S in light petroleum liquids11,12. This standard could be improved to use an ambient separation and also be applied to heavier crude oils, therefore it was used as the basis for the protocol discussed herein.
GC is a heavily used technique for the analysis of petroleum samples. Samples are vaporized in a hot inlet, and separations occur in the gas phase. The gas phase separation makes GC ideal for the analysis of H2S, as it is easily liberated from the liquid sample during heating in the inlet. GC methods can be created and tailored for different samples, depending on the temperature programs used, columns implemented, and the use of multidimensional chromatography13-15. There have been a number of recent developments for the measurement of H2S using GC. Luong et al. demonstrated H2S and other light sulfur compound measurement in light and middle distillates using multidimensional GC and Deans switching, but the method has not yet been applied to heavier crudes16. Di Sanzo et al. also quantified H2S in gasoline using GC, however it also has not been used on heavier crudes, and requires sub-ambient cooling17. The method presented here demonstrates considerable time saving over these previous methods, with a completed analysis time of 5 min, compared to 10 min (Luong) and 40 min (Di Sanzo). Unfortunately, implementation of these methods in our lab to compare accuracy was not possible due to equipment and time restrictions.
Multidimensional GC allows the user to exploit the selectivity of two columns, rather than a single column. In conventional GC, separation occurs on one column. In the case of multidimensional GC, the sample is separated on two different columns, enhancing the separation and selectivity. The Deans switch is one device used to employ a two-dimensional column configuration. The switch uses an external valve to direct gas flow from an inlet on the switch to one of two outlet ports18-20. Effluent from the first column can be directed in either direction; in this case, light sulfur gases are “heart cut”21 from the first separation to a porous layer open tubular (PLOT) column for secondary separation, which has been shown to be excellent for the separation of H2S from other light sulfur gases (http://www.chem.agilent.com/cag/cabu/pdf/gaspro.pdf)22-24. A sulfur chemiluminescence detector is used for detection, providing selectivity for sulfur compounds and eliminating possible interference from any other light gases that may have been transferred to the PLOT column during the heart cut. Hydrocarbons from the crude oil sample are retained on the first dimension column and are removed during a backflush procedure; this protects the PLOT column from any contamination25-27. This approach has also been successfully implemented for the analysis of oxidation inhibitors in transformer oils28.
Herein, a two-dimensional GC method is employed for the analysis and quantification of dissolved H2S in heavy crude oil samples. The method is shown to be applicable over a wide range of H2S concentrations, and can also be used to measure H2S in gas phase samples.
Protocol
Caution: Please consult all relevant material safety data sheets (MSDS) for materials before using. In particular, CS2 is highly flammable and should be stored and handled appropriately. H2S gas is highly toxic, and any containers or gas bags containing H2S should not be opened or handled outside of a properly vented fumehood. Work with crude oil samples should only be done with full personal protective equipment (gloves, safety glasses, lab coat, pants and closed-toe shoes), and all crude samples should be opened, transferred and handled in a fumehood. Certified gas standards will be delivered from the manufacturer with an expiry date, and for the most accurate results care should be taken to use standards that have not expired.
1. Preparation of Standards
- Liquid standards
- Using an automatic pipette, dispense 10 µl of carbon disulfide (CS2) into a 50 ml volumetric flask. Fill the volumetric flask to the marked line with HPLC (high performance liquid chromatography) grade toluene. Cap the flask and mix the solution by inverting and swirling a minimum of five times; this is the 500 ppm stock calibration solution.
- On each day of analysis, prepare four vials of CS2 for calibration. Label four 1.5 ml autosampler vials and place them in a vial tray.
- Using an automatic pipette, dispense 200 µl of the 500 ppm stock CS2 solution into each vial. Using a second automatic pipette, dispense 800 µl of HPLC grade toluene into each of the four vials. Cap each vial immediately after dispensing the CS2 and toluene, and invert three times to mix; these are the 100 ppm calibration standards.
- Gas standards
- Move a gas cylinder of certified calibration gas to a vented fumehood, and attach a regulator that is fitted for attachment to a gas bag.
- Open the nozzle on an empty gas bag and attach the gas bag to the regulator on the gas cylinder.
- With the regulator closed, open the gas cylinder by turning the knob on top counterclockwise.
- Turn the knob on the regulator counterclockwise until a steady flow of gas fills the gas bag. When the gas bag is full, turn the regulator knob clockwise to shut off the gas flow.
- Close the nozzle on the gas bag and detach it from the regulator. Close the gas cylinder by turning the knob on top clockwise. Open the regulator to purge any remaining gas and release pressure, closing it again when the regulator no longer has any gas it in it.
2. Instrument Set-up
- Method parameters
- Using the following procedure, configure the Deans switch according to the columns installed in the gas chromatograph, as each system will have unique pressure settings.
- Open a Deans switch calculator program on a computer, and input the column dimensions, carrier gas, temperature, desired flow rates and detectors used (see Figure 1).The calculator will define the pressures needed for the inlet and pressure control module (PCM), and the length of restrictor tubing needed for installation between the Deans switch and the flame ionization detector (FID). Note these pressures and input them into the method file.
- Using the information from the Deans switch calculator and the information in Table 1, program the method file with the correct parameters for either gas or liquid analysis. Save the method file.

Figure 1. Deans switch calculator. Screenshot of the Deans switch calculator program. User-adjustable parameters are shown in white boxes, and output parameters are shown in blue boxes. Please click here to view a larger version of this figure.
- Column installation
- Ensure that the instrument, oven and inlet are at RT. Turn off the gas flow to the inlet and PCM supplying flow to the Deans switch.
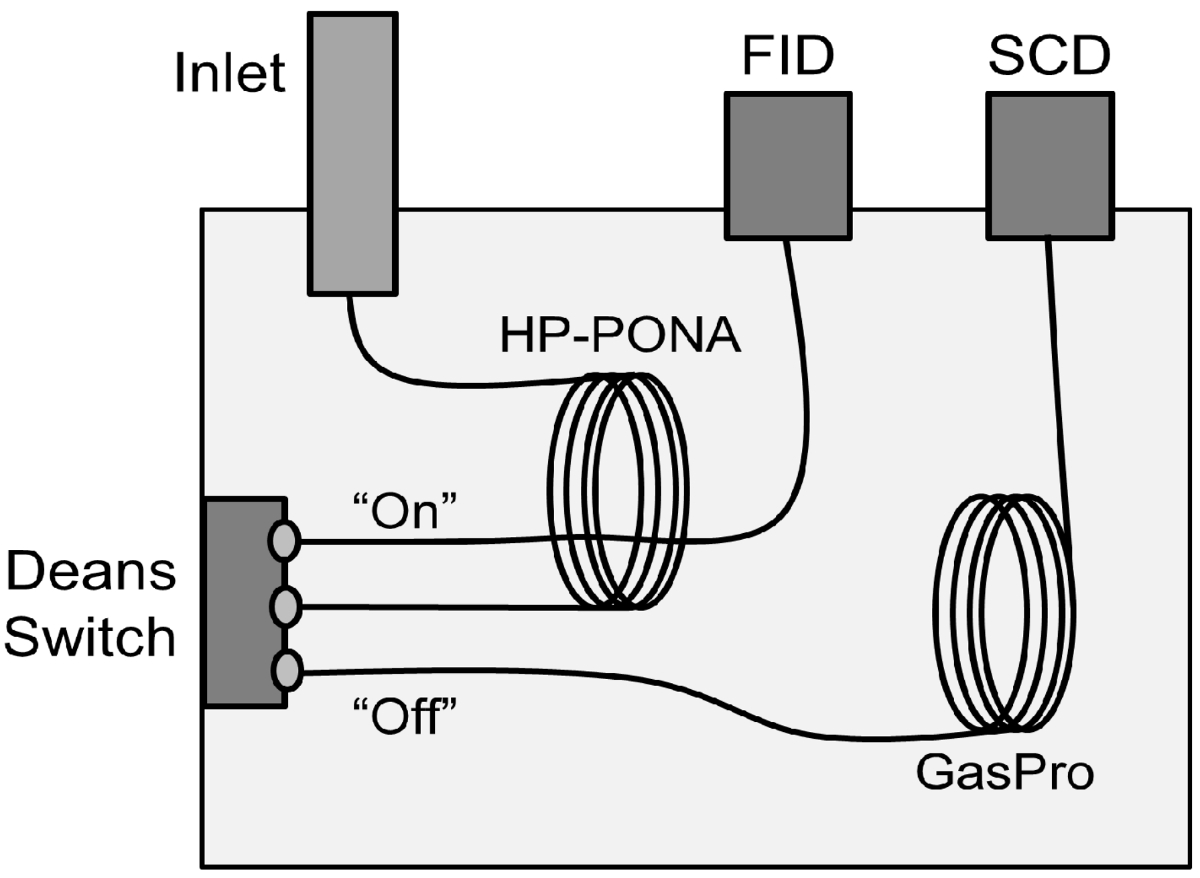
- Following the manufacturer's instructions, install the dimethylpolysiloxane column between the split/splitless inlet and the Deans switch, the PLOT column between the Deans switch and the sulfur chemiluminescence detector (SCD), and the restrictor tubing (length determined in step 2.1.2) between the Deans switch and the FID.
- Using the gas chromatograph software, turn on the carrier gas flow to the inlet and PCM, and test the system for leaks by passing an electronic leak detector in close proximity of the fittings at the end of each column and at the Deans switch; leaks are indicated by a light and/or sound notification on the detector.
- If leaks are present, gently tighten fittings and re-test with the electronic leak detector. Close the oven door and turn on the gas chromatograph oven and inlet heater.
- Perform a bake-out of the columns and restrictor tubing by increasing the oven temperature to the upper temperature limit of the PLOT column (found on the column documentation); allow the oven to sit at this temperature for a minimum of 3 hr.
- When the bake-out is complete, cool the oven to RT and re-test the connections inside the oven for gas leaks with the electronic leak detector, tightening where necessary.
- Load the pre-programmed method file using the software controlling the gas chromatograph; the instrument is ready for analysis.

Figure 2. Gas chromatograph oven. Configuration of the column arrangement in the GC oven. FID: flame ionization detector, SCD: sulfur chemiluminescence detector. Please click here to view a larger version of this figure.
- Determining proper Deans switch timing
- As the Deans switch is controlled by a valve in the gas chromatograph; locate the valve timing point section in the method parameters. In the software, set the switch to "on", and create time events for the valve that controls the Deans switch, beginning with the valve turning "off" at 0.5 min, and a second event that turns the valve "on" again at 3.0 min. The "off" position in this description corresponds to the direction in which column effluent will be carried to the SCD.
- Place a gas bag containing the calibration gas (known amount of H2S in helium) in the fumehood, and place a rubber nipple or equivalent penetrable cover on the nozzle of the gas bag. Open the nozzle on the gas bag.
- Using a 250 µl gas-tight glass syringe, puncture the rubber nipple on the top of the bag and withdraw 250 µl of calibration gas. Cap the syringe with an inlet septa, and transport the syringe to the gas chromatograph.
- Remove the septa cap from the syringe; manually and swiftly inject the calibration gas into the gas chromatograph, simultaneously starting the software acquisition. The H2S will appear as a peak on the SCD signal trace; record the retention time of this peak. .
- Begin decreasing the time of the heart-cut window, one side at a time (i.e., decrease the valve "on" event by 0.1 min for sequential injections); continue in this manner until the H2S peak disappears from the chromatogram. Add 0.2 min to this time and note it as the upper limit of the heart-cut window.
- Perform the same procedure on the lower end of the time window, gradually increasing the time of the valve "off" event for sequential injections until the peaks are no longer visible. Subtract 0.2 min from this time and note it as the lower limit of the heart-cut window.
- Save the valve "on"/"off" commands into the method file.
3. Instrument Calibration
- Liquid
- Ensure that a liquid autosampler is installed on the split/splitless inlet of the gas chromatograph. Place the four previously prepared calibration vials in vial positions 1-4 on the autosampler tray.
- Using a glass pipette, fill a vial with HPLC grade toluene and place it in the vial position for the wash solvent on the autosampler tray. Ensure that the waste vial or reservoir on the autosampler tray is empty.
- Load the method configured for liquid phase analysis on the software connected to the gas chromatograph; ensure that both detectors are turned on and that the gas chromatograph is in a ready state.
- Use the gas chromatograph software to perform one injection per vial according to the method, and integrate the CS2 peak in each chromatogram using the software provided with the gas chromatograph.
- Using a spreadsheet program, calculate an average response factor for the SCD by dividing the area counts of the CS2 peak by the concentration of the calibration solution (100 ppm), and then dividing this by two to give response per one atom of sulfur.
- Gas
- Ensure that the liquid autosampler tower has been removed from the gas chromatograph, and load the appropriate method for gas analysis. Ensure that both detectors are turned on, and that the gas chromatograph is in a ready state.
- Inject the calibration gas as described in steps 2.3.2 to 2.3.4.
- Repeat the manual injection of calibration gas a minimum of three times.
- Use the gas chromatograph data analysis software to integrate the H2S peaks in the three injections and, using a spreadsheet program, calculate an average response factor for H2S by dividing the average area of the H2S peaks by the concentration of H2S in the gas bag.
4. Sample Analysis
- Liquid
- Assess crudes for injection by transferring a small amount (<1 ml) with a glass pipette. If the crude is transferred with no significant residue left in the glass pipette, the crude can be injected neat. If the crude leaves a significant amount in the glass pipette, dilute as described in 4.1.2. For crudes that can be injected neat, transfer ~1 ml of the crude into a gas chromatograph autosampler vial, and cap the vial.
- Dilute high viscosity crudes by transferring 0.75 ml of crude with an automatic pipette to an autosampler vial, and adding an equal volume of HPLC grade toluene. Cap and invert the vial with shaking to adequately mix the solution.
- Place the filled vials in the autosampler tray, and load the liquid analysis method on the gas chromatograph software.
- Using the gas chromatograph software and the previously configured method (Table 1), use the automatic sampler to perform three replicate injections per vial.
- Gas
- Headspace
- Fill a 500 ml amber glass bottle with 450 ml of the crude to be analyzed. Attach a septum-topped cap to the top of the bottle. Perform any crude transfer steps in a vented fumehood.
- Place the bottle(s) to be analyzed in a temperature controlled environment (i.e., a water bath at 30 °C). Note: Crude oil samples may become volatile at elevated temperatures and care should be exercised depending on the samples used.
- Using a 1 ml glass gas tight syringe, puncture the septum top and leave the syringe in the top of the bottle to provide an avenue for pressure release if the gas in the headspace should build up.
- Leave the bottle(s) in the temperature controlled environment for 24 hr, gently lifting and shaking the bottles once an h to equilibrate the H2S between the liquid and headspace.
- To analyze the headspace gas, puncture the septum top and withdraw µl of gas into a gas tight glass syringe.
- Cap the syringe end with a piece of inlet septa and transport the syringe to the gas chromatograph. Manually and swiftly inject the gas into the inlet, simultaneously starting the software to begin data collection.
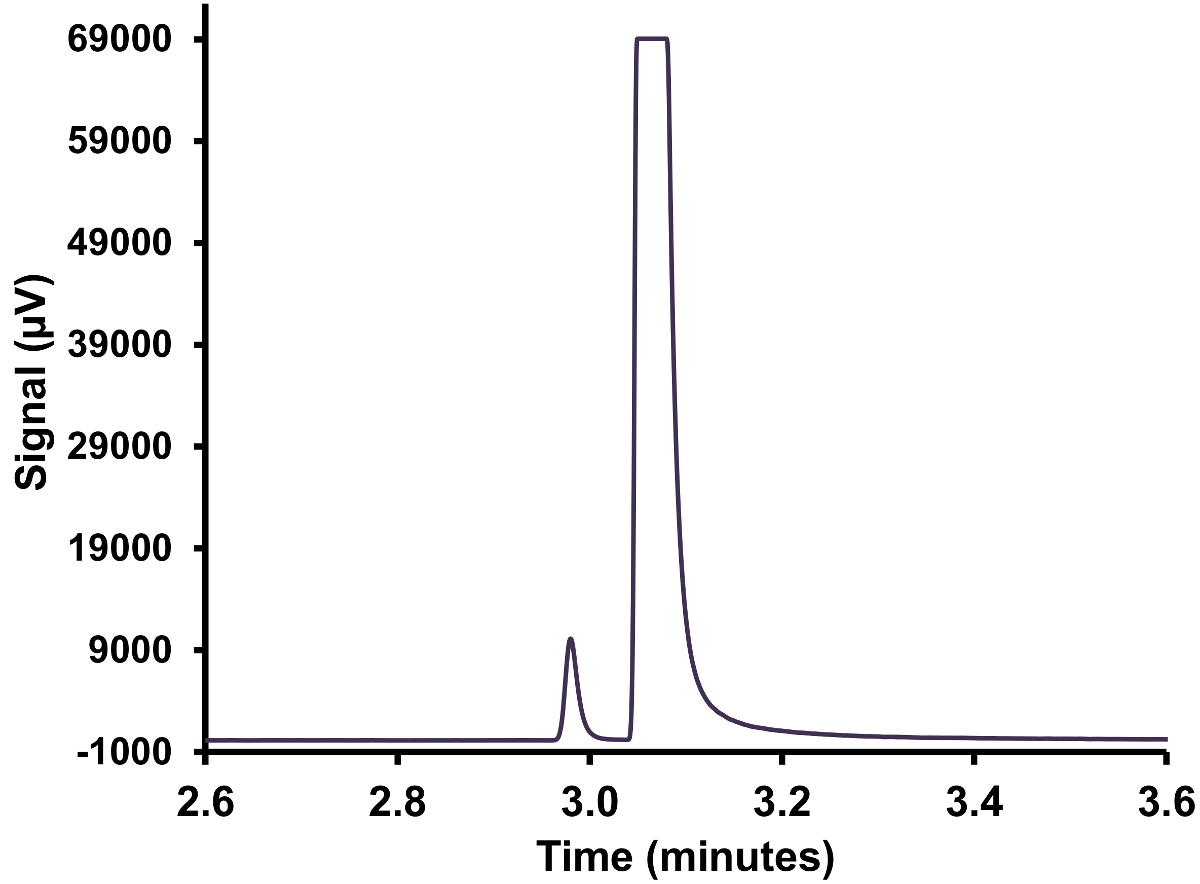
- Repeat this procedure to obtain a minimum of three replicate injections of gas. If the H2S peak is too concentrated and not on the scale of the detector (see Figure 3), perform the procedure with a smaller syringe of gas to bring the peak on scale; i.e., 100 µl or 25 µl.
- Gas bags
- Place a rubber nipple or equivalent penetrable cover on the nozzle of the gas bag to be analyzed, and place the gas bag in a vented fumehood.
- Ensure the correct method for gas analysis is loaded on the gas chromatograph software, and that the gas chromatograph is in the ready state.
- Open the nozzle on the gas bag, and puncture the top of the nipple with a 250 µl gas tight syringe. Fill the syringe with 250 µl of gas, withdraw the syringe, and close the nozzle on the gas bag.
- Cap the syringe end with a piece of inlet septa and transport the syringe to the gas chromatograph, and manually inject the gas into the inlet, simultaneously starting the software to begin data collection.
- Repeat this procedure to obtain a minimum of three replicate injections of gas. If the H2S peak is too concentrated and is not on the scale of the detector (see Figure 3), perform the procedure with a smaller syringe of gas to bring the peak on scale; i.e., 100 µl or 25 µl.
- Headspace

Figure 3. A gas chromatogram with an overloaded H2S peak. A gas injection from the headspace of a liquid crude sample held at 30 °C, demonstrating an overloading of the SCD. Please click here to view a larger version of this figure.
5. Data Analysis
- Liquid
- Determining H2S peak retention time (only needs to be repeated if instrument configuration changes)
- Use a glass pipette to fill a GC autosampler vial with a liquid crude that does not require dilution and cap the vial.
- Load the appropriate method for liquid analysis on the gas chromatograph software, and ensure the liquid autosampler tower is installed.
- Place the liquid crude sample in the autosampler tray, and perform one injection of the crude.
- Fill a glass gas-tight syringe with 750 µl of H2S-containing gas (2.5% in helium). Remove the vial from the autosampler tray and puncture the septa on the cap of the vial with the syringe filled with gas, and place the end of the syringe below the surface of the sample in the vial. Depress the plunger on the syringe to bubble the gas through the crude sample.
- Place the vial back in the autosampler tray and use the software to direct the autosampler to perform a single injection of the spiked sample.
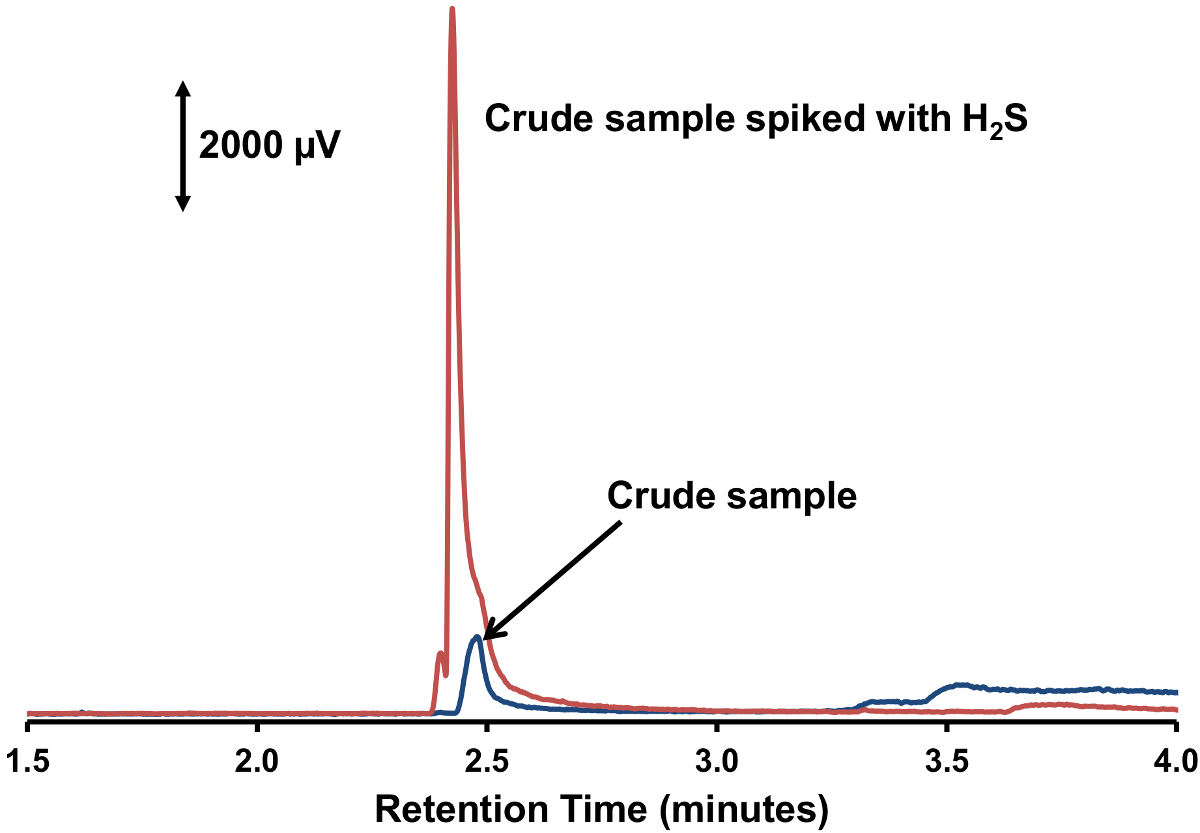
- Using the software accompanying the gas chromatograph, compare the chromatograms before and after the H2S spike. A large peak should be present in the second chromatogram that was not present in the first chromatogram; record the retention time of this peak (see Figure 4).
- Analysis
- Use the data analysis software accompanying the gas chromatograph to integrate the peak area for H2S (identify using the retention time noted in step 5.1.1.6) in each chromatogram (Figure 5), and calculate the average peak area for each sample with a spreadsheet program.
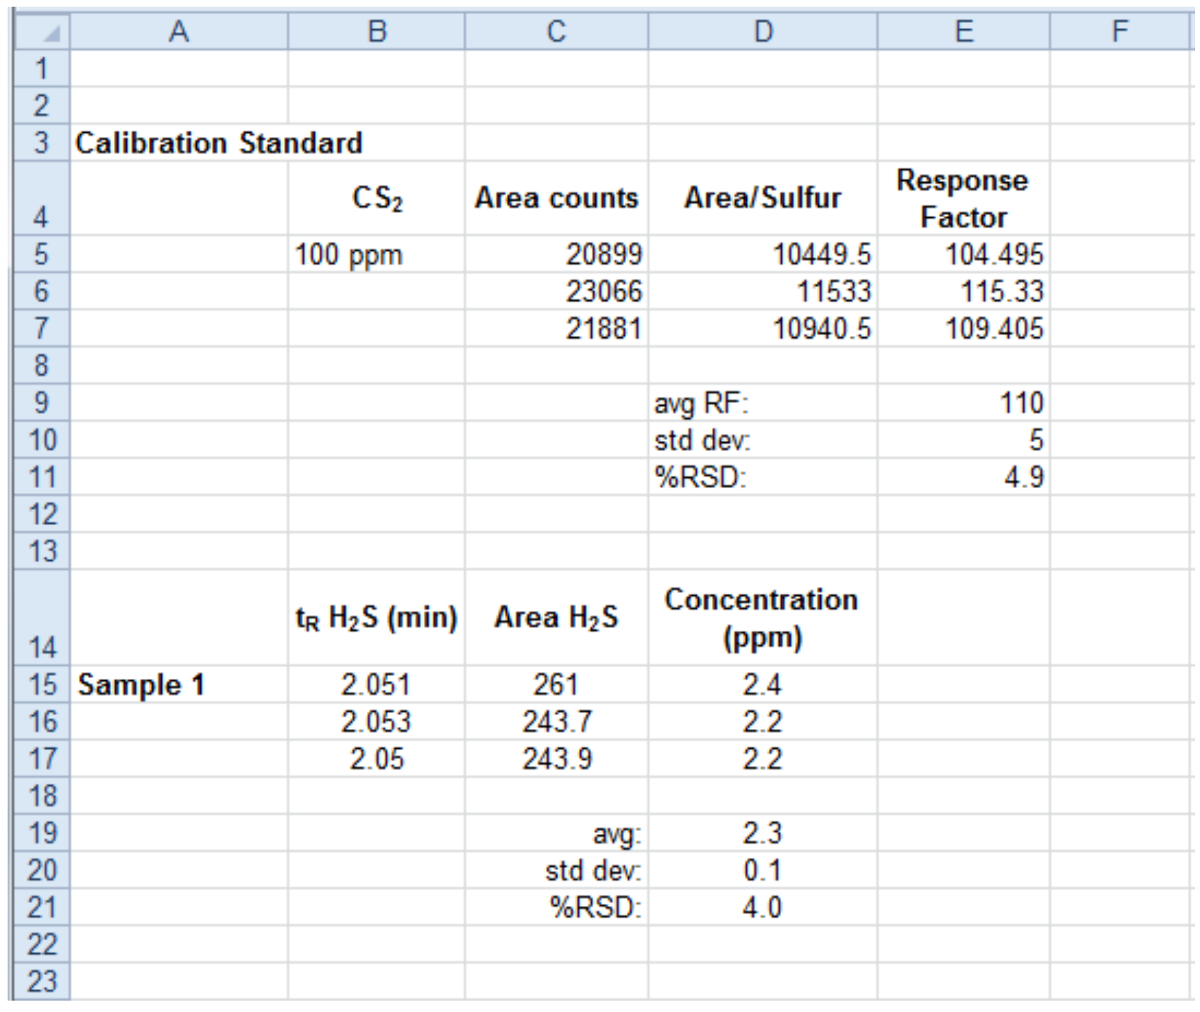
- Using the response factor determined in Section 3.1, divide the average peak area for the sample by the response factor to give the amount of H2S present in ppm. For samples that were diluted, multiply the concentration by the correct dilution factor to give the amount of H2S in the undiluted sample (Figure 6).
- Determining H2S peak retention time (only needs to be repeated if instrument configuration changes)

Figure 4. Crude sample spiked with H 2 S. Two overlaid chromatograms illustrating the change expected when spiking a crude sample with H2S. Please click here to view a larger version of this figure.

Figure 5. Gas chromatogram data analysis. A screenshot of a data analysis program highlighting the location of an H2S peak in a sample and the peak area to be used to determine the concentration of H2S. Please click here to view a larger version of this figure. Please click here to view a larger version of this figure.

Figure 6. Sample spreadsheet for data analysis. A screenshot of a spreadsheet program showing an example of how to calculate the concentration of H2S using the area of the calibration standard peak and the area of the sample peak. Please click here to view a larger version of this figure.
- Gas
- Identify the H2S peak in each chromatogram by matching the retention time of the H2S peak used to calibrate in Section 3.2.
- Use the data analysis software accompanying the gas chromatograph to integrate the peak area for each H2S peak in the collected data, and calculate the average peak area for each sample.
- Using the response factor determined in Section 3.2, divide the average peak area for the sample by the response factor to give the amount of H2S present in ppm. For samples that used a smaller syringe volume, multiply the concentration by the correct dilution factor to give the amount of H2S that would be present in a 250 µl syringe (i.e., (250 µl/25 µl for a 25 µl syringe).
Results
In order to obtain reliable quantification of H2S for both liquid and gas samples, proper calibration is necessary. For calibration injections and sample injections, the H2S peak should not be overlapping with neighboring peaks and should have a reproducible peak area. Figure 3 shows an injection of a gas sample where the gas is too concentrated for this method. It was found that gas concentrations of greater than 500 ppm using a 250 µl syringe overloaded the detector. This iss...
Discussion
In order to achieve optimum measurement of H2S, this method employs a Deans switch, backflushing and a sulfur chemiluminescence detector (SCD). A dimethylpolysiloxane column is used as the first dimension GC column, and serves to retard the movement of heavier hydrocarbons present in the sample so that they do not contaminate the PLOT column. This effect is enhanced by a cool (50 °C) initial separation. Light gases pass through the first dimension column and are captured by the PLOT column during the hear...
Disclosures
The authors have nothing to disclose.
Acknowledgements
The authors would like to acknowledge support from the Government of Canada's interdepartmental Program of Energy Research and Development, PERD 113, Petroleum Conversion for Cleaner Air. N.E.H would like to acknowledge her Natural Sciences and Engineering Research Council of Canada Visiting Fellowship.
Materials
| Name | Company | Catalog Number | Comments |
| Deans switch | Agilent | G2855A | Or equivalent flow switching device |
| Restrictor tubing | Agilent | 160-2615-10 | Fused silica, deactivated, 180 µm |
| HP-PONA column | Agilent | 19091S-001 | |
| GasPro column | Agilent | 113-4332 | |
| Sulfur chemiluminescence detector, 355 | Agilent/Sievers | G6603A | |
| H2S calibration standard, in He | Air Liquide | Custom order | 211 ppm H2S |
| CS2 | Fisher Scientific | C184-500 | |
| Toluene, HPLC grade | Fisher Scientific | T290-4 | |
| Gas bag, 2 L | Calibrated Instruments, Inc. | GSB-P/2 | Twist on/off nozzle |
| 250 µl gas tight syringe | Hamilton | 81130 | |
| 500 ml amber glass bottle | Scientific Specialties | N73616 | |
| Open top screw caps | Scientific Specialties | 169628 | |
| Tegrabond disc for screw caps | Chromatographic Specialties | C889125C | 25 mm, 10/90 MIL |
| 1 ml gas tight syringe | Hamilton | 81330 | |
| 2.5% H2S in He gas standard | Air Liquide | Custom order |
References
- Guidotti, T. L. Hydrogen sulphide. Occ. Med. 46, 367-371 (1996).
- Reiffenstein, R. J., Hulbert, W. C., Roth, S. H. Toxicology of Hydrogen Sulfide. Annu. Rev. Pharmacol. Toxicol. , 109-134 (1992).
- Qi, Y., et al. Effect of Temperature on the Corrosion Behavior of Carbon Steel in Hydrogen Sulphide Environments. Int. J. Electrochem. Sci. 9, 2101-2112 (2014).
- Ma, H., et al. The influence of hydrogen sulfide on corrosion of iron under different conditions. Corros. Sci. 42, 1669-1683 (2000).
- Kallinikos, L. E., Jess, A., Papayannakos, N. G. Kinetic study and H2S effect on refractory DBTs desulfurization in a heavy gasoil. J. Catal. 269, 169-178 (2010).
- Liu, B., et al. Kinetic investigation of the effect of H2S in the hydrodesulfurization of FCC gasoline. Fuel. 123, 43-51 (2014).
- Si, X., Xia, D., Xiang, Y., Zhou, Y. Effect of H2S on the transformation of 1-hexene over NiMoS/γ-Al2O3 with hydrogen. J. Nat. Gas Chem. 19, 185-188 (2010).
- . . Hydrogen Sulfide and Mercaptan Sulfur in Liquid Hydrocarbons by Potentiometric Titration. , UOP 163-10 (2010).
- . . Standard Test Method for Determination of Hydrogen Sulfide in Fuel Oils by Rapid Liquid Phase Extraction. , ASTM D7621-10 (2010).
- Lywood, W. G., Murray, D. . H2S in Crude Measurement Report. , (2012).
- . . Standard Test Method for Sulfur Compounds in Light Petroleum Liquids by Gas Chromatography and Sulfur Selective Detection. , ASTM D7621-10 (2009).
- Liu, W., Morales, M. . Detection of Sulfur Compounds According to ASTM D5623 in Gasoline with Agilent's Dual Plasma Sulfur Chemiluminescence Detector (G6603A) and an Agilent 7890A Gas Chromatograph. , (2008).
- Barman, B. N., Cebolla, V. L., Membrado, L. Chromatographic Techniques for Petroleum and Related Products. Crit. Rev. Anal. Chem. 30, 75-120 (2000).
- Rodgers, R. P., McKenna, A. M. Petroleum Analysis. Anal. Chem. 83, 4665-4687 (2011).
- Nizio, K. D., McGinitie, T. M., Harynuk, J. J. Comprehensive multidimensional separations for the analysis of petroleum. J. Chromatogr. A. 1255, 12-23 (2012).
- Luong, J., Gras, R., Shellie, R. A., Cortes, H. J. Tandem sulfur chemiluminescence and flame ionization detection with planar microfluidic devices for the characterization of sulfur compounds in hydrocarbon matrices. J. Chromatogr. A. 1297, 231-235 (2013).
- Di Sanzo, F. P., Bray, W., Chawla, B. Determination of the Sulfur Components of Gasoline Streams by Capillary Column Gas Chromatography with Sulfur Chemiluminescence Detection. J. High Res. Chromatog. 17, 255-258 (1994).
- Deans, D. R. A new technique for heart cutting in gas chromatography. Chromatographia. 1, 18-22 (1968).
- Hinshaw, J. V. Valves for Gas Chromatography, Part III: Fluidic Switching Applications. LC GC N. Am. 29, 988-994 (2011).
- Seeley, J. V., Micyus, N. J., Bandurski, S. V., Seeley, S. K., McCurry, J. D. Microfluidic Deans Switch for Comprehensive Two-Dimensional Gas Chromatography. Anal. Chem. 79, 1840-1847 (2007).
- Tranchida, P. Q., Sciarrone, D., Dugo, P., Mondello, L. Heart-cutting multidimensional gas chromatography: A review of recent evolution, applications, and future prospects. Anal. Chim. Acta. 716, 66-75 (2012).
- Armstrong, D. W., Reid, G. L., Luong, J. Gas Separations: A Comparison of GasPro™ and Aluminum Oxide PLOT Columns for the Separation of Highly Volatile Compounds. Curr. Sep. 15, 5-11 (1996).
- Ellis, J., Vickers, A. K., George, C. Capillary Column Selectivity and Inertness for Sulfur Gas Analysis in Light Hydrocarbon Streams by Gas Chromatography. Fuel Chemistry Division Preprints. 47, 703-704 (2002).
- Ji, Z., Majors, R. E., Guthrie, E. J. Porous layer open-tubular capillary columns: preparations, applications and future directions. J. Chromatogr. A. 842, 115-142 (1999).
- Luong, J., Gras, R., Shellie, R. A., Cortes, H. J. Applications of planar microfluidic devices and gas chromatography for complex problem solving. J. Sep. Sci. 36, 182-191 (2013).
- Hildmann, F., Kempe, G., Speer, K. Application of the precolumn back-flush technology in pesticide residue analysis: A practical view. J. Sep. Sci. 36, 2128-2135 (2013).
- Gray, B. P., Teale, P. The use of a simple backflush technology to improve sample throughput and system robustness in routine gas chromatography tandem mass spectrometry analysis of doping control samples. J. Chromatogr. A. 1217, 4749-4752 (2010).
- Hayward, T., Gras, R., Luong, J. Characterization of selected oxidation inhibitors in transformer oils by multidimensional gas chromatography with capillary flow technology. Anal. Methods. 6, 8136-8140 (2014).
- Hutte, R. S., Johansen, N. G., Legier, M. F. Column Selection and Optimization for Sulfur Compound Analyses by Gas Chromatography. J. High Res. Chromatog. 13, 421-426 (1990).
- Yan, X. Unique selective detectors for gas chromatography: Nitrogen and sulfur chemiluminescence detectors. J. Sep. Sci. 29, 1931-1945 (2006).
- Araujo, P. Key aspects of analytical method validation and linearity evaluation. J. Chromatogr. B. 877, 2224-2234 (2009).
Reprints and Permissions
Request permission to reuse the text or figures of this JoVE article
Request PermissionThis article has been published
Video Coming Soon
Copyright © 2025 MyJoVE Corporation. All rights reserved