
Method Article
Evaluation of Bioenergetic Function in Cerebral Vascular Endothelial Cells
In This Article
Summary
Endothelial cell mitochondria are critical to maintain blood-brain-barrier integrity. We introduce a protocol to measure bioenergetic function in cerebral vascular endothelial cells.
Abstract
The integrity of the blood-brain-barrier (BBB) is critical to prevent brain injury. Cerebral vascular endothelial (CVE) cells are one of the cell types that comprise the BBB; these cells have a very high-energy demand, which requires optimal mitochondrial function. In the case of disease or injury, the mitochondrial function in these cells can be altered, resulting in disease or the opening of the BBB. In this manuscript, we introduce a method to measure mitochondrial function in CVE cells by using whole, intact cells and a bioanalyzer. A mito-stress assay is used to challenge the cells that have been perturbed, either physically or chemically, and evaluate their bioenergetic function. Additionally, this method also provides a useful way to screen new therapeutics that have direct effects on mitochondrial function. We have optimized the cell density necessary to yield oxygen consumption rates that allow for the calculation of a variety of mitochondrial parameters, including ATP production, maximal respiration, and spare capacity. We also show the sensitivity of the assay by demonstrating that the introduction of the microRNA, miR-34a, leads to a pronounced and detectable decrease in mitochondrial activity. While the data shown in this paper is optimized for the bEnd.3 cell line, we have also optimized the protocol for primary CVE cells, further suggesting the utility in preclinical and clinical models.
Introduction
It is widely recognized that the blood-brain-barrier (BBB) formed by cerebral vascular endothelial (CVE) cells has very distinct and unique functions paramount to vascular biology. These endothelial cells use mitochondria to generate most of the cellular supply of adenosine triphosphate (ATP) as a source of chemical energy. In addition to providing ATP for the CVE cells, mitochondria regulate various cellular processes in vascular endothelial cells, such as cellular signaling1-4, apoptosis5, and control of the cell cycle and cell growth6. Dysregulation of mitochondrial bioenergetic function in CVE cells may affect mitochondrial biogenesis, leading to impaired vascular endothelium activity, and exacerbate cerebrovascular diseases and neurodegenerative disorders, e.g., stroke7,8 and Alzheimer's disease (AD)9. We have demonstrated that insults to CVE cells following exposure to lipopolysaccharide (LPS) impair mitochondrial function in CVE cells and worsen stroke outcomes7. Tert-butylhydroquinone (tBHQ) increases stroke mortality by interfering with oxidative phosphorylation in CVE cells10. Therefore, the quantitative model of bioenergetic function in CVE cells not only pilots a series of mechanism-related studies for central nervous system (CNS) diseases, but also provides a breakthrough in drug screening of therapeutics targeting mitochondrial function in vascular biology.
Isolated mitochondria have been used to measure bioenergetic function. We7 and others11 have reported assessments of cellular bioenergetics in intact CVE cells by using an extracellular flux bioanalyzer. The analyzer provides the advantage of endogenous cellular bioenergetic assessment. This sensitive and consistent assay measures the mitochondrial metabolism of CVE cells and can be used to evaluate bioenergetic impairment by stimuli, investigate the mechanisms of mitochondrial signaling pathways, and screen drugs or treatments that affect mitochondrial function in CVE cells. The Oxygen Consumption Rate (OCR) is recorded by the bioanalyzer using a pharmacological profiling approach by combining the use of four mitochondrial disruptors: oligomycin, carbonyl cyanide-4 (trifluoromethoxy) phenylhydrazone (FCCP), rotenone, and antimycin A. In this protocol, we detail an optimized approach that allows for the measurement and calculation of mitochondrial functional parameters in CVE cells, including basal mitochondrial respiration, ATP production, proton leak, maximal respiration, and spare respiratory capacity, in a single assay.
Protocol
NOTE: The scheme of the protocol is shown in Figure 1, including a timeline of the procedures.
1. Culture and Passage of CVE Cells
- Culture CVE cells (bEnd.3 cells) in complete growth medium (high glucose Dulbecco's Modified Eagle's Medium, DMEM) supplemented with 10% fetal bovine serum (FBS) and 1% penicillin/streptomycin in a T75 cm2 tissue culture flask. Grow at 37 °C in a 5% CO2 incubator.
- Remove and discard the cell culture medium. Rinse the cell layer with 0.25% Trypsin-0.03% EDTA solution, and then add 1 - 2 mL of Trypsin-EDTA solution to the flask and keep the flask at 37 °C for 3 - 5 min. Observe the cells under an inverted microscope until the cell layer is detached. Add 10 mL of complete growth medium and aspirate the cells by gently pipetting.
- Decant the fluid and cells into a 15-mL centrifuge tube and spin at 700 x g for 5 min to remove cellular debris.
- Discard the supernatant from the centrifuge tube. Add 10 mL of complete growth medium and re-suspend the cell pellet. Spin the cells at 700 x g for 5 min.
- Discard the supernatant from the centrifuge tube. Re-suspend the cell pellet in complete growth medium at a concentration of 2.0 × 10⁵ cells/mL (determined by counting using a hemocytometer; exclude dead cells by Trypan-blue staining).
NOTE: Freshly-thawed cells are sub-cultured for at least 3 passages for experiments.
2. Seed and Treat Cells on Cell Culture Plates
- Seed cells on a 96-well extracellular flux cell culture plate: 80 µL/well. Place the cell culture plate at 37 °C in a 5% CO2 incubator. Note: 16 × 103 cells per well will reach 60 - 80% confluency within 24 h.
- If the cells are being exposed to a chemical, add the treatments once the cells are attached to the plate bottom (8 - 24 h after seeding).
NOTE: For transfection experiments, do not add antibiotics in complete growth medium.
3. Assessment of Mitochondrial Function Using the Bioanalyzer
- Prior to the start of the assay, hydrate an extracellular flux sensor cartridge with calibrant by adding 150 µL of extracellular flux calibrant solution to the plate and incubating O/N at 37 °C without CO2.
- Using the plate washer station, change the cell culture medium into pH 7.0 extracellular flux assay medium. Incubate the cells at 37 °C without CO2 for 30 - 60 min.
- Prepare working solutions of 8 µM oligomycin, 4.5 µM FCCP, 10 µM rotenone, and 10 µM antimycin A in DMEM. Load 25 µL of the stock solutions into cartridge injection ports: Port A, oligomycin; Port B, FCCP; Port C, rotenone and antimycin A with extracellular flux assay medium. Implement the assay protocol as described in Table 1.
- Load the hydrated cartridge into the bioanalyzer and perform the calibration by clicking the "Start" button. After the calibration is complete, remove the cartridge bottom plate and load the cell plate by clicking the "Unload Cartridge" prompt. Continue the assay until the end of all measurements.
- Open the data file and obtain the rate values from the bioanalyzer. Export the data to a spreadsheet file.
4. Data Analyses
NOTE: The calculations for data analyses are formulated below. The values are obtained from the bioanalyzer instrument as the OCR presented in Figure 2.
- To calculate Basal respiration, subtract the non-mitochondrial respiration (measurements 10 - 12) from the basal value (measurement 3).
NOTE: Basal respiration = Basal - non-mitochondrial respiration = Rate ③ - Rate ⑩~⑫. - To calculate ATP production, subtract the ATP-linked respiration (measurements 4 - 6) from the basal value (measurement 3).
NOTE: ATP production = Basal - ATP-linked respiration = Rate ③ - Rate ④~⑥. - To calculate Maximal respiration, subtract the non-mitochondrial respiration (measurements 10 - 12) from the Maximum respiration (measurements 7 - 9).
NOTE: Maximal respiration = Maximum respiration - non-mitochondrial respiration = Rate ⑦~⑨ - Rate ⑩~⑫. - To calculate Spare capacity, subtract the basal value (measurement 3) from the Maximum respiration (measurements 7 - 9).
NOTE: Spare capacity = Maximum respiration - Basal = Rate ⑦~⑨ - Rate ③. - To calculate Proton leak, subtract the non-mitochondrial respiration (measurement 10 - 12) from the ATP-linked respiration (measurement 4).
NOTE: Proton leak = ATP-linked respiration - non-mitochondrial respiration = Rate ④ - Rate ⑩~⑫.
Results
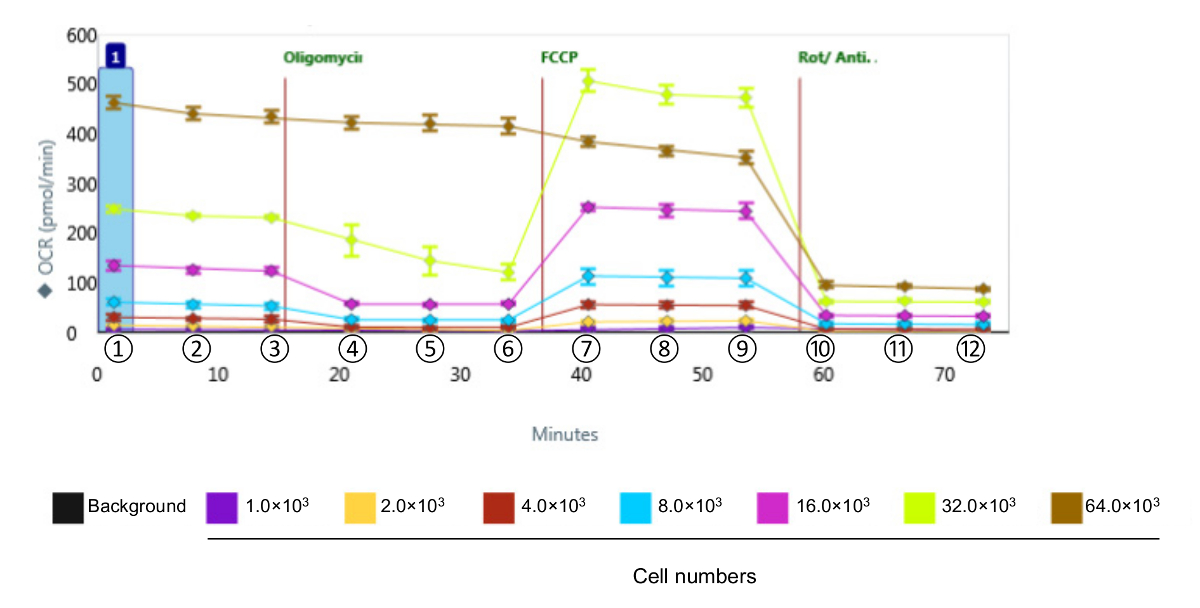
To assess the bioenergetic function of CVE cells in response to oxidative stress, we chose the murine brain microvascular endothelia cell line bEnd.3, which displays the same comparative barrier characteristics as primary brain microvascular endothelial cells12. Given that the kinetics and relative intensity of response are varied among the various cell types, the first series of experiments were designed to obtain measurable OCR levels by identifying the optimal number of bEnd.3 cells to use in the assay for metabolic profiling, shown in Figure 2. Following the evaluation, the data are quantified and presented in Figure 3. Basal respiration, maximal respiration, and spare respiratory capacity showed a proportional response with cell density. However, ATP production decreased when 64 × 103 cells per well were selected, suggesting that the over-confluent cell culture is not suitable for this experiment. The optimal cell densities occur between 8 - 32 × 103 cells per well, based on the response to mitochondrial disruptors.
For subsequent experiments, a seeding density of 16 × 103 cells per well was used to allow for optimal detection of changes in OCR. Using 16 × 103 cells per well, we observed the expected responses in OCR and demonstrated that the microRNA miR-34a reduces mitochondrial function in CVE cells (Figure 4). We have previously reported that miR-34a reduced oxidative phosphorylation in these cells13. The repeated experiments also showed that maximal respiration and spare capacity were significantly decreased by the overexpression of miR-34a in CVEs at 24 h post-transfection, even though the basal respiration, ATP production, and proton leak had no significant changes (Figure 4). These data demonstrate the sensitivity of the bioanalyzer to detect changes in mitochondrial function in CVEs.

Figure 1. Strategic Planning for the Experiment. The timeline for the cell, plate, and cartridge preparation is indicated. Please click here to view a larger version of this figure.

Figure 2. Representative Raw Data of Bioenergetic Function in CVE Cells with Various Cell Densities. Oxygen consumption rates were measured in CVE cells with different cell densities. Data represent mean ± SD (n = 5); OCR: Oxygen Consumption Rate; FCCP: carbonyl cyanide-4-(trifluoromethoxy) phenylhydrazone; Rot/Anti-A: rotenone and antimycin A. ①, ②, and ③ indicate basal respiration; ④, ⑤, and ⑥ indicate ATP linked respiration; ⑦, ⑧, and ⑨ indicate maximum respiration; ⑩, ⑪, and ⑫ indicate non-mitochondrial respiration. Please click here to view a larger version of this figure.

Figure 3. Representative Results of Bioenergetic Function in CVE Cells with Various Cell Densities. Basal respiration, ATP production, maximal respiration, and spare capacity are calculated from the raw data generated by the bioenergetics functional assay in Figure 2 using the formulas indicated in Section 4. Data represent mean ± SD (n = 5); OCR: Oxygen Consumption Rate. Please click here to view a larger version of this figure.

Figure 4: Representative Results of Decreased Bioenergetic Function by miR-34a. (A) Raw data of Mitochondrial Function following overexpression of miR-34a at 24 h post-transfection. (B) Basal respiration, ATP production, maximal respiration, and spare capacity are calculated from the raw data generated by the bioenergetics functional assay in Figure 4A; the parameters are calculated by the formulas indicated in Section 4. Overexpression of miR-34a reduces mitochondrial function in CVE cells at 24 h post-transfection. Data represent mean ± SD (n = 5); OCR: Oxygen Consumption Rate. ****, P < 0.0001. Please click here to view a larger version of this figure.

Table 1. The Instrument Run Protocol.
Discussion
This protocol represents a method for evaluating of the bioenergetic phenotype in cerebral vascular endothelial cells. It serves as a basic assay for the endothelial cell mitochondrial evaluation, and it is optimal for experiments designed to investigate the mechanisms of stimuli that may affect the mitochondrial signaling pathway in CVE cells. It also provides a method for testing potential therapeutics for BBB-disruption-associated diseases.
Critical Steps within the Protocol
Extracellular flux bioanalyzers have the ability to measure OCR in real time. In this assay, identifying the appropriate cell density is critical. If the cell density is below 8 × 10³ cells per well, the basal OCR is too low to be analyzed (Figure 2 and Figure 3); if the cell density is above 32 × 103 cells per well, the cells do not respond to oligomycin or FCCP treatments (Figure 2 and Figure 3). The optimal cell density for this cell line in our experimental model is 16 × 103 cells per well, which demonstrates replicable results and sensitivity to stimuli7 and treatments10,14. If a 24-well bioanalyzer is used, new titrations of the cell density would be required for the assay.
It is documented that CVEs have a large volume of mitochondria compared with other endothelial cells or tissue types15,16, suggesting the need for greater energy production and fewer cells for measuring bioenergetics metabolism. We have tested several types of brain endothelial cells, such as primary and immortalized murine cerebrovascular endothelial cells7 and immortalized human cerebrovascular endothelial cells (unpublished data). These cells required similar cell densities to reach the acceptable OCR (basal respiration OCR within 40 - 160 pmol/min for 96-well plates and 50 - 400 pmol/min for 24-well plates) when the bioenergetics assay was performed. Kaczara et al. reported measuring bioenergetic metabolism in human umbilical vein endothelial cells (HUVEC), which used a higher cell density17.
Our group did not evaluate vessel cells from other tissue or organs. Theoretically, the bioanalyzer could potentially be used on any cell type, but it requires optimizing the assay for the cell density, cell culture medium, and culture conditions (some specific cells may require coated plates to grow well). It is required that the experiments are completed to ensure the OCR rate is within the acceptable range. If the OCR in endothelial cells from other organs is lower than CVEs from brains, increasing the cell density can help to get within an acceptable OCR range. Alternatively, if cells are not using oxidative phosphorylation as their main source of energy, the bioanalyzer would not be an optimal assay.
The bioanalyzer allows for the sequential disruption of the electron transport chain, based on the order in which the reagents are applied. First, oligomycin is applied, which inhibits mitochondrial Complex V (ATP synthase). Second, FCCP, an electron uncoupler, is applied, which leads to the disruption of the proton gradient. Finally, rotenone and antimycin A, which inhibit mitochondrial Complexes I and III, respectively, are applied to lead to a total inhibition of electron flow. The order of drug exposure is essential because the drugs block the specific electron transport chain reaction, and the sequential changes can be measured to reflect the mitochondrial function.
Modifications and Troubleshooting
To evaluate mitochondrial response to stimuli in CVE cells, it is recommended that the stimuli are applied to cells after the cells are adhered to the cell culture plate bottom (see the timeline shown in Figure 1; it usually takes at least 6 h). To obtain replicable results by treatments, it is extremely important to keep the cell density consistent. If pretreatments are designed prior to cell seeding, cell density for each pre-treatment should be carefully measured, excluding the dead cells for seeding. If transfection is included in the experimental design, refer to the manufacturer's transfection protocol. Demonstrated in data presented in Figure 4, miR-34a was transfected into the CVE cells using a lipofectamine transfection kit, which requires antibiotics-free cell culture medium and a mito-stress test to assess the changes in metabolic function with overexpression of miR-34a. The doses of plasmid may also be optimized, as previously published13. Another change that can be made to the protocol is changing the concentrations of the reagents. A titration curve of oligomycin, FCCP, and/or rotenone and Antimycin A can be completed.
In addition, if this assay is used for high throughput analyses of various drugs, it is suggested to include a parallel assay to measure cell viability and cell proliferation, which was described in our previous publications7,13. The OCR values are significantly affected by cell number (Figures 2 and 3), and the cell proliferation and viability assays benefit the normalization of the data. However, the completion of these assays are at the discretion of each individual laboratory.
Limitations of the Technique
The major limitation of this protocol is that we only used an in vitro cell culture model in the study. Currently, there are no available ex vivo models or animal models that may address endothelial cell mitochondrial function. New models are expected to be developed for the evaluation of bioenergetic function in vivo and ex vivo in future studies.
Another limitation is the extension of the barrier assessments following the bioenergetics measures. The experiments cannot be performed because, first, after the completion of the bioenergetic measurements, the cell viability is diminished following complete disruption of the electron transport chain; second, specific cell culture plates and inserts are required to detect bioenergetics values and do not fit inserts for barrier assessments. Therefore, there are not many functional assays that can be completed after the bioenergetics assay. However, it is expected that special devices can be developed to perform functional assays prior to the bioenergetics assay.
Significance of the Technique with Respect to Existing/Alternative Methods
Previous techniques to evaluate mitochondrial function necessitated the isolation of the mitochondria from the cells18. This new technique using the bioanalyzer allows for measurement of mitochondrial activity in intact cells, which preserves more of the cellular environment than evaluating isolated mitochondria.
Future Applications or Directions after Mastering This Technique
This protocol is designed and developed for the bEnd.3 cell line, but it is also compatible with primary cerebral vascular endothelial (pCVE) cells7 or other endothelium, and we have demonstrated this in our previous publication using pCVE cells7. When other types of endothelium are used, the coating of the culture plate and the use of growth factors may be required. However, the titration assay is recommended for other cell types as well. This protocol offers a general method to be adopted in the evaluation of the bioenergetics of CVE cells, and it may be further applied to mechanism studies or therapeutic responses in this manner.
Disclosures
The authors declare no potential conflicts of interest with respect to the research, authorship, and/or publication of this article. Open Access fees for this article were provided by Agilent Technologies.
Acknowledgements
This work was supported by the following grants: AHA 16SDG31170008 to X.R. and NIH P20 GM109098, P01 AG027956, and U54 GM104942 to J.W.S.
Materials
| Name | Company | Catalog Number | Comments |
| bEnd.3 cell line | ATCC | CRL-2299 | 25 - 30 passages |
| Dulbecco's Modified Eagle's Medium (DMEM) | ATCC | 30-2002 | |
| Fetal Bovine Serum | Atlanta Biologicals | S12450 | 10% final concentration |
| Penicillin/Steptomycin | Hyclone | SV30010 | 1×100 stocking |
| 0.25% trypsin, 0.03% EDTA solution | Corning | 25-053-CI | |
| Sodium pyruvate | Corning | 25-000-CI | 1.0 µM final concentration |
| Glucose | Sigma | CAS 50-99-7 | 25 mM final concentration |
| Oligomycin | Sigma | O4876 | 1.0 µM final concentration |
| Carbonilcyanide 4-(trifluoromethoxy) phenylhydrazone (FCCP) | Sigma | C2920 | 0.5 µM final concentration |
| Rotenone | Sigma | R8875 | 1.0 µM final concentration |
| Antimycin A | Sigma | CAS 1397-94-0 | 1.0 µM final concentration |
| Plate wash station | Seahorse Bioscience | ||
| Extracellular flux bioanayzer | Seahorse Bioscience | XFe96 | |
| Extracellular flux cell culture plate | Seahorse Bioscience | 102416-100 | |
| Extracellular flux sensor cartridge | Seahorse Bioscience | 102416-100 | |
| Extracellular flux calibrant solution | Seahorse Bioscience | 100840-000 | |
| Extracellular flux assay medium | Seahorse Bioscience | 102365-100 | PH buffered prior to assay |
References
- Quintero, M., Colombo, S. L., Godfrey, A., Moncada, S. Mitochondria as signaling organelles in the vascular endothelium. Proc Natl Acad Sci U S A. 103, 5379-5384 (2006).
- Liu, Y., Li, H., Bubolz, A. H., Zhang, D. X., Gutterman, D. D. Endothelial cytoskeletal elements are critical for flow-mediated dilation in human coronary arterioles. Med Biol Eng Comput. 46, 469-478 (2008).
- Al-Mehdi, A. B., et al. Perinuclear mitochondrial clustering creates an oxidant-rich nuclear domain required for hypoxia-induced transcription. Sci Signal. 5, ra47 (2012).
- Mironov, S. L., Ivannikov, M. V., Johansson, M. [Ca2+]i signaling between mitochondria and endoplasmic reticulum in neurons is regulated by microtubules. From mitochondrial permeability transition pore to Ca2+-induced Ca2+ release. J Biol Chem. 280, 715-721 (2005).
- Sutendra, G., et al. The role of Nogo and the mitochondria-endoplasmic reticulum unit in pulmonary hypertension. Sci Transl Med. 3, 88ra55 (2011).
- Mitra, K., Wunder, C., Roysam, B., Lin, G., Lippincott-Schwartz, J. A hyperfused mitochondrial state achieved at G1-S regulates cyclin E buildup and entry into S phase. Proc Natl Acad Sci U S A. 106, 11960-11965 (2009).
- Doll, D. N., et al. Mitochondrial crisis in cerebrovascular endothelial cells opens the blood-brain barrier. Stroke. 46, 1681-1689 (2015).
- Ren, X., Simpkins, J. W. Deciphering the Blood-Brain Barrier Damage in Stroke: Mitochondrial Mechanism. J Neuroinfect Dis. S2, e002 (2015).
- Pun, P. B., Lu, J., Moochhala, S. Involvement of ROS in BBB dysfunction. Free Radic Res. 43, 348-364 (2009).
- Sun, J., Hu, H., Ren, X., Simpkins, J. W. Tert-butylhydroquinone compromises survival in murine experimental stroke. Neurotoxicol Teratol. 54, 15-21 (2016).
- Modis, K., et al. Cellular bioenergetics is regulated by PARP1 under resting conditions and during oxidative stress. Biochem Pharmacol. 83, 633-643 (2012).
- Brown, R. C., Morris, A. P., O'Neil, R. G. Tight junction protein expression and barrier properties of immortalized mouse brain microvessel endothelial cells. Brain Res. 1130, 17-30 (2007).
- Bukeirat, M., et al. MiR-34a regulates blood-brain barrier permeability and mitochondrial function by targeting cytochrome c. J Cereb Blood Flow Metab. 36, 387-392 (2016).
- Hu, H., et al. Mitochondrial Impairment in Cerebrovascular Endothelial Cells is Involved in the Correlation between Body Temperature and Stroke Severity. Aging Dis. 7, 14-27 (2016).
- Oldendorf, W. H., Cornford, M. E., Brown, W. J. The large apparent work capability of the blood-brain barrier: a study of the mitochondrial content of capillary endothelial cells in brain and other tissues of the rat. Ann Neurol. 1, 409-417 (1977).
- Oldendorf, W. H., Brown, W. J. Greater number of capillary endothelial cell mitochondria in brain than in muscle. Proc Soc Exp Biol Med. 149, 736-738 (1975).
- Kaczara, P., et al. Carbon monoxide released by CORM-401 uncouples mitochondrial respiration and inhibits glycolysis in endothelial cells: A role for mitoBKCa channels. Biochim Biophys Acta. 1847, 1297-1309 (2015).
- Bharadwaj, M. S., et al. Preparation and respirometric assessment of mitochondria isolated from skeletal muscle tissue obtained by percutaneous needle biopsy. J Vis Exp. (96), e52350 (2015).
Reprints and Permissions
Request permission to reuse the text or figures of this JoVE article
Request PermissionExplore More Articles
This article has been published
Video Coming Soon
Copyright © 2025 MyJoVE Corporation. All rights reserved