Method Article
Ablation of Ischemic Ventricular Tachycardia Using a Multipolar Catheter and 3-dimensional Mapping System for High-density Electro-anatomical Reconstruction
In This Article
Summary
With the following protocol, we provide an approach to Ventricular Tachycardia (VT) ablation using high density mapping with a multipolar catheter and 3D mapping system enhancing the success of the procedure.
Abstract
Ventricular tachycardia (VT) in patients with ischemic cardiomyopathy mainly results from endocardial scars after myocardial infarction; those scars represent zones of slow conduction that allow the occurrence and maintenance of reentrant circuits. Catheter ablation enables substrate modification of those low voltage areas and thus can help to alter the scar tissue in such a way that arrhythmias cannot appear anymore. Hospitalizations of concerned patients decrease, quality of life and outcome rise. Consequently, VT ablation represents a growing field in electrophysiology, especially for patients with endocardial scars in ischemic heart disease after myocardial infarction. However, ablation of ventricular tachycardia remains one of the most challenging procedures in the electrophysiology lab. Precise scar definition and localization of abnormal potentials are critical for ablation success. The following manuscript describes the use of a multipolar mapping catheter and 3-dimensional (3D) mapping system to create a high density electro-anatomical map of the left ventricle including a precise scar representation as well as mapping of fractionated and late potentials in order to allow a highly accurate substrate modification.
Introduction
Coronary artery disease and myocardial infarction remain major causes for morbidity and mortality in the industrialized world1. Myocardial scars after transmural infarction represent low voltage areas and thus zones of slow electrical conduction and facilitate the appearance and maintenance of macro-reentrant circuits. Ventricular tachycardias (VT) are responsible for repeat hospitalizations, painful shocks of implantable cardioverter defibrillators (ICD) and thus lessen quality of life and cause poor outcome2,3. Catheter ablation can reduce the occurrence of VT, especially in ischemic heart disease4, and should be considered in patients with ventricular arrhythmias and underlying structural heart disease in the presence of an ICD (class IIa B recommendation)5. In patients with structural heart disease with ventricular arrhythmias already suffering from ICD shocks, catheter ablation is recommended (class I B recommendation)5. However, catheter ablation is still a high-risk procedure, considering the often-poor state of health of concerned patients with mostly reduced left ventricular ejection fraction and multiple co-morbidities. Furthermore, the precise localization of scars and abnormal potential can be challenging but are critical for ablation success. The use of 3D mapping systems and multipolar catheters allow electro-anatomical high-density mapping and can considerably facilitate the acquisition of electrical information and thus improve the quality and validity of the 3D model and consequently enhance ablation success and patient outcome. So far, there are 3 different 3D mapping systems available, whereof one is commonly used for VT ablation. The following protocol describes an approach to endocardial ischemic VT ablation using a less common 3 D mapping system in the field of VT ablation and a multipolar catheter (see Table of Materials) for high-density electro-anatomical reconstruction.
Protocol
The following protocol complies with the guidelines of the human research ethics committee of the department for internal medicine/cardiology of the Hietzing Hospital in Vienna.
1. Preliminary Measures
- Administer the patient for whom VT ablation is planned at the ward at least 2 days prior to the procedure.
- Acquire blood sampling, X-ray of the chest and transthoracic echo-cardiography. In case of known atrial fibrillation (persistent or paroxysmal), perform a transesophageal echocardiography one day prior to the procedure.
- On the day of VT ablation, discontinue oral anticoagulants (in case the patient takes some for atrial fibrillation or other co-morbidities requiring the use of oral anticoagulants) and administer i.v. antibiotics.
2. Patient Preparation During the Procedure
- Apply self-adhesive ECG electrodes for 12-lead ECG (on the front chest - see Supplementary Figure 1 - and extremities in a standard position) as well as surface patches, neutral electrode and a system reference electrode compatible with the designated 3D mapping system (see Table of Materials) and a neutral electrode for the ablation catheter in a standard position to the patient´s skin (see also Supplementary Figure 2).
- Apply self-adhesive defibrillator patches to the patient´s skin in the advised position (below the right clavicle and at the left ventricular apex) and switch on the defibrillator.
- Deactivate the tachycardia therapies of the ICD with the appropriate programmer, optionally deactivate all device functions that might interfere with the ablation current.
NOTE: Tachycardia therapies of the ICD will stay deactivated throughout the procedure. Guarantee close monitoring and consistent readiness of the external defibrillator. - Use a pulse oximeter to monitor the oxygen saturation.
- Introduce a sheath via the left radial artery for invasive blood pressure monitoring, either via Seldinger technique6 or with an arterial puncture system with an integrated cannula (see Table of Materials).
- Disinfect patient´s skin in both groins with 75% propanol (see Table of Materials) and cover the patient´s body with a sterile cloth, sparing the groins.
NOTE: At this point, all persons entering the catheter laboratory and working in close proximity to the patient have to wear hoods and masks.
3. Groin Puncture and Catheter Positioning
- Apply local anesthesia (xylocaine) in both groins by subcutaneous injection and introduce a central venous catheter via the left femoral vein and 3 sheaths (5, 6 and 12 Fr) via the right femoral vein with Seldinger technique6.
- Place a quadripolar catheter in the right ventricular apex and an 8-polar steerable catheter in the coronary sinus by means of fluoroscopy (beam positions: AP, RAO 30°, and LAO 60°).
NOTE: As soon as the x-ray equipment is activated, all persons entering the catheter laboratory have to wear lead protection. - Connect diagnostic catheters to the electrophysiology system and stimulator (see table of materials).
- Verify that the quadripolar catheter in the right ventricle has sufficient capture by stimulating with a cycle length of 600 ms (or less, if the patient is tachycardic) and look for the adequate response.
- Administer 5000 IU heparin via a venous sheath in the groin. Perform activated clotting time (ACT) measurements every half hour with an appropriate device (see Table of Materials, ACT goal: above 300 s).
- Introduce a long steerable sheath (see Table of Materials) via the right femoral vein into the right atrium of the heart and perform trans-septal puncture using an appropriate needle connected to a pressure sensor line (beam positions AP and LAO 90° or RAO 20° and LAO 50° depending on the investigator). After puncturing the inter-atrial septum of the heart, disconnect the pressure sensor line and apply contrast agent via the needle to check the correct position inside the left atrium. Then advance the sheath over the dilator under fluoroscopy control and place the distal end of the long steerable sheath in the left atrium pointing towards the left ventricle.
- Initiate general anesthesia by administration of propofol and remifentanil.
4. Electro-anatomical Reconstruction of the Left Ventricle
- Introduce a multipolar mapping catheter (steerable 16 pole catheter, electrode spacing 3-3-3, electrode length 1 mm, see Table of Materials) in the left ventricle via the steerable sheath and collect anatomical and electrical data of the endocardial left ventricle using the 3D mapping system (see Table of Materials) and the multipolar catheter.
- Define voltage of ventricular signals as follows: scar area under 0.5 mV, low voltage area between 0.5 and 1.5 mV and normal voltage area above 1.5 mV. Be careful to take into consideration only ventricular beats of the same type: either intrinsic ventricular activation in sinus rhythm or stimulated ventricular beats if the patient is pacemaker-dependent. Do not use premature ventricular complexes. Use the morphology matching feature to sort out unwanted ventricular complexes (see Figure 1).
- Optionally, turn down the lower voltage limit to 0.2 mV to identify viable conducting tissue inside the scar (see Figure 2 and 3).
- Pay close attention to fractionated (ventricular activation with more than one component) and late (second ventricular activation clearly separated from the first ventricular activation on a given electrode) potentials and annotate them separately (e.g. with special tags, see Figure 4A).
- Optionally, pace from the right ventricle to clearly separate the late potential from the first ventricular activation (see Figure 4B).
- Remove the multipolar mapping catheter and introduce an irrigated tip ablation catheter with sensor (electrode spacing 2-2-2, see Table of Materials) connected to a cooling pump into the left ventricle. Complete the electroanatomical map with the ablation catheter by adding missing anatomy (collect electroanatomical points at places where the multipoloar catheter could not be placed) and verifying zones of high interest (i.e. zones with very fractionated and late potentials — tag those zones separately, see Figures 1-2).
5. Programmed Ventricular Stimulation (PVS)
- Perform PVS7 via the catheter in the right ventricular apex and the EP stimulator (see Table of Materials) using a predefined protocol of up to 9 steps or until a sustained VT is induced:
- Begin with a 6-beat drive train (10 V over 2 ms) with 500 ms cycle length and add an extra-stimulus of 350 ms coupling interval after the last stimulus of the drive train. Then, after a pause of at least 5 s, repeat this maneuver by decrementing the coupling interval of the extra-stimulus every cycle by 10 ms until the refractory time of the right ventricle is reached.
- Then, add a second extra-stimulus (beginning with 350 ms coupling interval) and repeat the above-mentioned protocol until ventricular refractory time. Couple the first extra-stimulus with the following interval: refractory time plus 20-30 ms, as appropriate (make sure the first extra-stimulus captures the right ventricle).
- Reduce the drive train to 430 ms, then 370 ms and at last 330 ms and repeat the above-mentioned steps.
- At last, add a 3rd extra-stimulus to the drive train of 500 ms and repeat the above-mentioned protocol.
- Repeat the protocol in the right ventricular outflow tact (RVOT) if no sustained VT can be induced.
- Make sure that the external defibrillator is ready to deliver a shock at any time during the whole procedure, and re-check it before PVS.
- In case a sustained monomorphic VT can be induced (the following also applies if VT occurs during mapping or ablation):
- Create an activation map of the left ventricle using the 3 D mapping system (LAT-map: local activation time) if the VT is hemodynamically stable. Optionally, perform entrainment mapping.
- Stop the VT by overdrive stimulation via the catheter in the right ventricular apex or, if that fails, by external cardioversion/defibrillation, if the VT is hemodynamically unstable.
- Mark and annotate every VT that can be induced and compare them to spontaneously occurring VTs or use it for pace mapping.
- If no sustained VT can be induced, continue with substrate modification (point 6) in case of a well-defined scar in ischemic cardiomyopathy. However, without inducible VT at the beginning of the procedure, there is no clear endpoint and control of success of the ablation therapy.
6. Catheter Ablation
- Start irrigated radio frequency ablation with 35 to 45 W using the ablation catheter. Optionally, use a contact force catheter that provides information on tissue contact. Apply energy per lesion until a force-time-integral of 450 gs. Encircle scar areas by ablation lesions. Then, ablate all previously mapped abnormal potentials (substrate modification). Match pace mapping in electrically interesting regions to previously marked VTs.
- Pay close attention to ablation catheter impedance (usually between 90 and 150 Ohm), catheter temperature (max. 43 °C) and patient´s blood pressure (compared to the initial value). Immediately stop ablation if impedance drops or rises substantially compared to the initial value.
7. Post Ablation
- After ablation, repeat PVS.
- If ventricular arrhythmias can be induced, re-evaluate the substrate and continue ablation (see points 5 and 6).
- If no arrhythmia can be induced, stop the procedure.
- Stop general anesthesia (optionally an anesthesiologist takes care of general anesthesia and gradually discontinues all sedative agents at the end of the procedure).
- Remove all catheters and sheaths from the heart.
- Re-activate the tachycardia therapies of the ICD and restore all formerly de-activated functions.
- Perform transthoracic echocardiography to exclude pericardial effusion.
- Take a final ACT measurement and administer protamine, if appropriate.
- Remove the sheaths of the right groin and apply a compression bandage. The central venous catheter in the left groin remains.
- As soon as the patient is awake and extubated, bring him to the intensive care unit for further surveillance.
Results
The protocol describes in detail catheter ablation of monomorphic ventricular tachycardia in a patient with ischemic heart disease after anterior myocardial infarction with occlusion of the proximal left anterior descendant artery. The patient suffered from multiple ICD shock deliveries. Transthoracic echocardiography showed a severely reduced systolic left ventricular function (ejection fraction 30%) with a large apex aneurysm. VT ablation was performed using a 3D mapping system (see Table of Materials) and a multipolar (16 pole) steerable mapping catheter (see Table of Materials, electrode size 1 mm, electrode spacing 3-3-3). Simultaneous acquisition of numerous mapping points allowed a rapid and precise electroanatomical reconstruction of the left ventricle (see Figures 1, 2 and 3). The close electrode spacing of the multipolar catheter made possible the detection of critical signals such as fragmented and late potentials. Additional pacing from the right ventricle clearly separated the late potential from the first ventricular activation and thus identified the mapped area as a zone of slow conduction and therefore of high importance regarding the occurrence and maintenance of ventricular arrhythmias (see Figure 4). Areas that could not be reached with the multipolar catheter where addressed with the ablation catheter (see Table of Materials), which also has a close electrode spacing of 2-2-2.
By means of all the above-mentioned mapping strategies, a very precise map could be generated, showing a scar area at the left ventricular apex and adjacent areas (see Figures 1, 2 and 3, scar area 54 cm2). However, mapping time could be limited to 27 min.
During programmed ventricular stimulation and ablation, a total of 4 VTs could be induced. One of them (see Supplementary Figure 3) could be entrained and successfully ablated at the lateral border zone of the scar. Additionally, substrate modification was performed by encircling the scar, ablating all late abnormal potentials and ablating sites of pace maps matching the induced VTs.
At the end of the procedure, no VT could be induced with the stimulation sequences that enhanced the VTs at the beginning of the procedure. Only a VT with presumably epicardial origin could be induced with very aggressive stimulation. We decided to stop the procedure at that point.
The described method helps to improve ablation success and patient outcome.
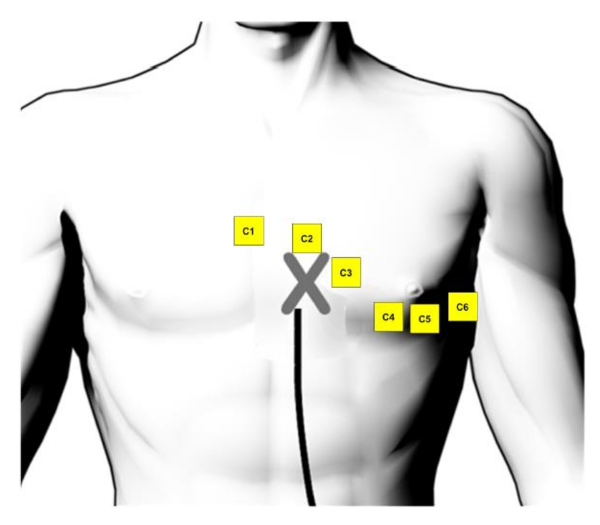
Supplementary Figure 1: ECG electrode position. The position of the surface ECG electrodes on the front chest (taken and adapted from the user handbook of the 3D mapping system8). Please click here to view a larger version of this figure.
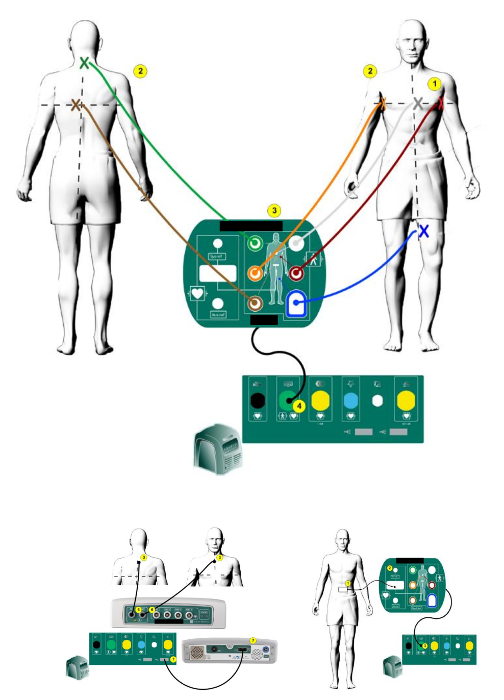
Supplementary Figure 2: 3D mapping system patch position. The position of the EnSite Precision™ patches on the body (taken and modified from the user handbook of the 3D mapping system8). Please click here to view a larger version of this figure.
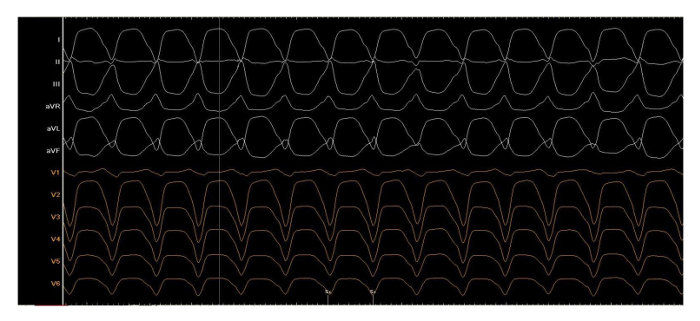
Supplementary Figure 3: Clinical tachycardia. One of four induced ventricular tachycardias during the procedure, written with 50 mm/s, cycle length 440 ms. Please click here to view a larger version of this figure.
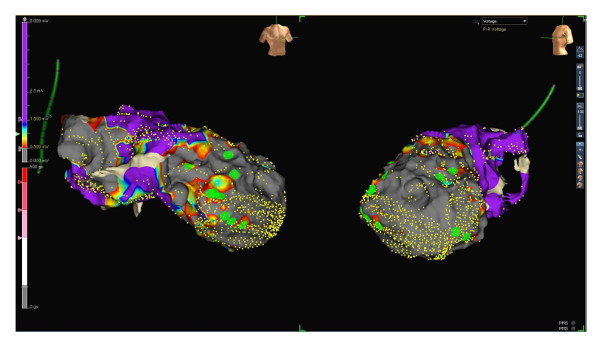
Figure 1: Voltage map range 0.5 to 1.5 mV. RAO (left side) and LAO (right side) projections of a voltage map of the endocardial left ventricle. Small yellow dots represent electro-anatomical mapping points. The voltage of ventricular signals is defined as scar below 0.5 mV (grey), the low voltage between 0.5 and 1.5 mV (from red to blue) and the normal voltage above 1.5 mV (purple, see the scale on the left side of the figure). Large green dots represent late potentials. Please click here to view a larger version of this figure.
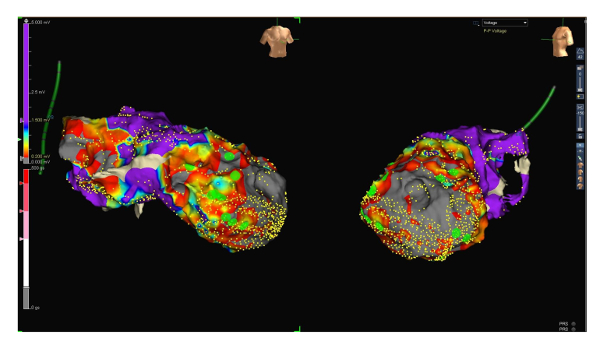
Figure 2: Voltage map range 0.2 to 1.5 mV. RAO (left side) and LAO (right side) projections of the same voltage map, this time with a low voltage range between 0.2 and 1.5 mV. Note the now patchy still viable and thus conducting tissue inside the scar. Late potentials (green dots) are located those areas that presumably represent zones of slow conduction. Please click here to view a larger version of this figure.
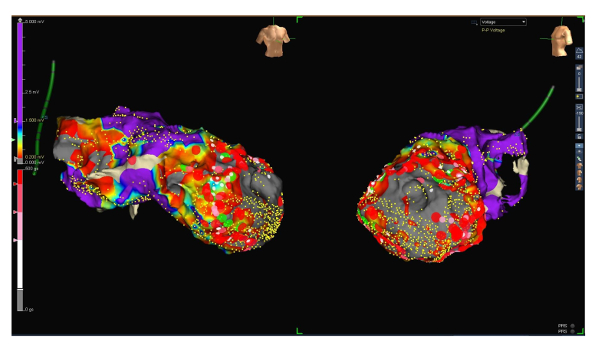
Figure 3: Voltage map with ablation lesions. RAO (left side) and LAO (right side) projections of the voltage map of the endocardial left ventricle (low voltage range between 0.2 and 1.5 mV) including ablation lesions (large red dots). Please click here to view a larger version of this figure.
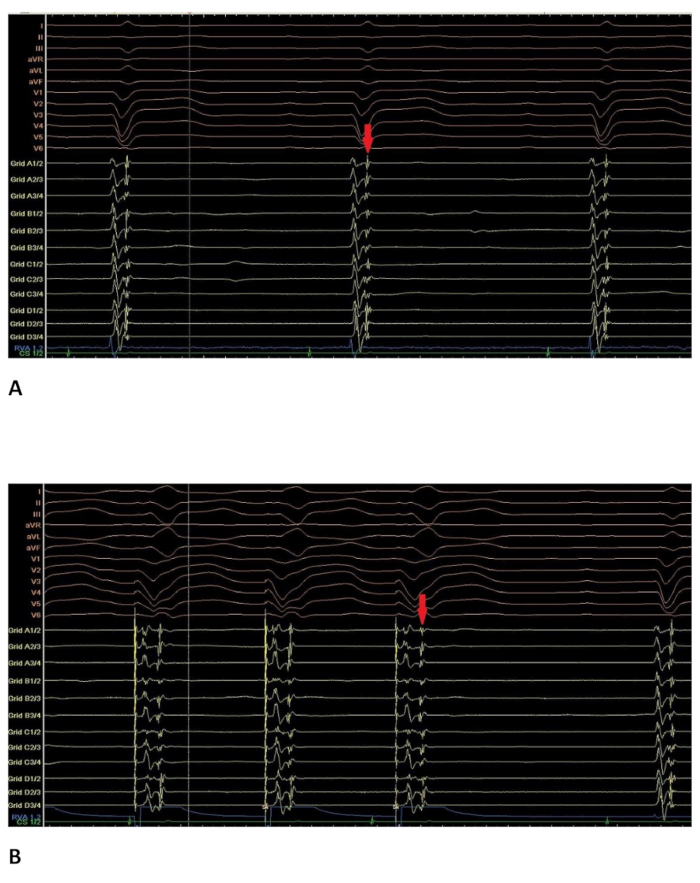
Figure 4: Intracardiac electrogram with late potentials. Intracardiac electrogram at a site where late potentials could be recorded. 12-lead ECG on top of the screen; RVAd: catheter in the right ventricular apex; Grid: multipolar catheter (16 poles); CS: 8-pole catheter in the coronary sinus. (A) in sinus rhythm. The late potential visible on the multipolar catheter (marked with the red arrow) is located directly after the first ventricular activation. (B) during RVA-stimulation at the same site. The late potential visible on the multipolar catheter (red arrow) is now clearly separated from the first ventricular activation. Please click here to view a larger version of this figure.
Discussion
The use of 3D mapping systems in complex electrophysiological procedures is a well-established method to acquire detailed and precise anatomical information and reduce radiation time and enables the creation of substrate and activation maps9. However, data acquisition can be challenging due to difficult catheter movement, especially in the left ventricle. Furthermore, point by point map acquisition takes a lot of time and thus prolongates the electrophysiological procedure. Wide electrode spacing at the tip of the mapping catheter reduces resolution and quality of the created map, critical signals may be overlooked. The use of a multipolar catheter for mapping of the ventricle solves the above-mentioned issues: several mapping points can be taken simultaneously; procedure time decreases. The narrow-spaced electrodes guarantee a very high resolution of the map, important signals are not so easily missed anymore.
Currently, there are 3 different 3D mapping systems available, all of them allowing the use of multipolar mapping catheters.
So far, one of them using a magnetic field is widely used, especially in VT ablation, due to its user-friendly handling and highly accurate electroanatomical reconstruction. A suitable mapping catheter, a 20-pole steerable catheter with narrow electrode spacing, can access even difficult anatomies due to its special configuration (star shape) and provides precise high density maps10.
A relatively new 3D mapping system also allows a very quick and precise acquisition of multiple mapping points by means of a 64-electrode mapping catheter with a basket shape11,12.
The 3D mapping system used in the protocol (see Table of Materials) combines impedance and magnetic field technology and thus allows precise navigation and accurate tracking of mapping and ablation catheters, either conventional or sensor enabled. The created electro-anatomical maps are highly accurate and don´t need further post-processing compared with former versions of the mapping system. A huge advantage for accurate mapping is the morphology matching feature, which allows continuous comparison of QRS morphologies during map acquisition. The suitable 16-pole mapping catheter (see Table of Materials) allows the acquisition of multiple points simultaneously and makes possible high resolution and the detection of even small critical signals due to its narrow electrode spacing (3-3-3).
To further improve the quality of the map and identify critical potentials, we changed the low voltage range from 0.5-1.5 mV to 0.2-1.5 mV (to identify viable and conducting tissue inside the scar). Interestingly, most late potentials were detected in viable zones within the scar (see Figure 1 and Figure 2).
By pacing from the catheter in the right ventricle, late potentials could clearly be separated from the first ventricular activation (see Figure 4B).
Despite the steerability of the 16-pole mapping catheter, we could not access all regions of the left ventricle. Those sites had to be addressed with the ablation catheter, which also has close electrode spacing (2-2-2), as well as a pressor sensor to guarantee adequate wall contact.
Despite all the above-mentioned advantages, the more sophisticated a method gets, the more prone it is to disturbances. Catheter noise can occur and make the interpretation of signals very difficult. Artifacts can simulate electrically interesting potentials and misguide the investigator. Multipolar catheters require more cables that can be damaged, the connection can be disturbed, troubleshooting costs time.
Despite those disadvantages, multipolar catheters, if used correctly and by experienced investigators, are very useful for complex electrophysiological procedures and have a large potential in the future. Reduction of procedure time helps to prevent adverse events in these often very ill patients. The additional electrical information provided has to be interpreted carefully and along with other parameters available
Disclosures
None.
Acknowledgements
None.
Materials
| Name | Company | Catalog Number | Comments |
| NaVX EnSite Precision 3 D mapping system | Saint Jude Medical | ||
| EnSite Precision Surface Electrode Kit | St. Jude Medical | EN0020-P | |
| Ampere RF Ablation generator | St. Jude Medical | H700494 | |
| EP-4, Cardiac Stimulator | St. Jude Medical | EP-4I-4-110 | |
| LabSystem PRO EP recording system, v2.4a | Boston Scientific | ||
| octapolar diagnostic catheter, EP-XT | Bard | 200797 | electrode spacing 2-10-2 |
| supreme quadripolar diagnostic catheter | St. Jude Medical | 401441 | electrode spacing 5-5-5 |
| Agilis NxT 8.5F, 71/91 cm steerable sheath, large curl | St. Jude Medical | G408324 | |
| BRK transseptal needle, 98 cm | St. Jude Medical | 407206 | |
| Advisor HD Grid mapping catheter, sensor enabled | St. Jude Medical | D-AVHD-DF16 | electrode spacing 3-3-3 |
| quadripolar irrigated tip ablation catheter, TactiCath SE | St. Jude Medical | A-TCSE-F | electrode spacing 2-2-2 with pressure sensor |
| Cool Point pump for irrigated ablation | St. Jude Medical | IBI-89003 | |
| Cool Point tubing set | St. Jude Medical | 85785 | |
| GEM PCL Plus Instrumentation laboratory | IL Werfen India Pvt. Ltd. | activated clotting time measurement device | |
| X-ray equipment | Philips | ||
| Heartstart XL defibrillator and associated patches | Philips | ||
| 12 F Fast-Cath sheath | St. Jude Medical | 406128 | |
| 6 F sheath | Johnson-Johnson | ||
| 5 F sheath | Johnson-Johnson | ||
| BD Floswitch™ | Becton Dickinson | ||
| Isozid®-H gefärbt | Novartis |
References
- The top 10 causes of death. Health Organization Organization. , fact sheet Nr 310 (2007).
- Poole, J. E., et al. Prognostic importance of defibrillator shocks in patients with heart failure. N. Engl. J. Med. 359 (10), 1009-1017 (2008).
- Kamphuis, H. C., de Leeuw, J. R., Derksen, R., Hauer, R. N., Winnubst, J. A. Implantable cardioverter defibrillator recipients: quality of life in recipients with and without ICD shock delivery: a prospective study. Europace. 5 (4), 381-389 (2003).
- Stevenson, W. G., et al. Irrigated radiofrequency catheter ablation guided by electroanatomic mapping for recurrent ventricular tachycardia after myocardial infarction: the multicenter thermocool ventricular tachycardia ablation trial. Circulation. 118 (25), 2773-2782 (2008).
- The Task Force for the Management of Patients with Ventricular Arrhythmias and the Prevention of Sudden Cardiac Death of the European Society of Cardiology (ESC). 2015 ESC Guidelines for the management of patients with ventricular arrhythmias and the prevention of sudden cardiac death. Eur Heart. 36 (41), 2793-2867 (2015).
- Seldinger, S. I. Catheter replacement of the needle in percutaneous arteriography; a new technique. Acta radiol. 39 (5), 368-376 (1953).
- Kossaify, A., Refaat, M. Programmed ventricular stimulation - indications and limitations: a comprehensive update and review. Hellenic J Cardiol. 54, 39-46 (2013).
- Figures taken and modified from the user handbook of the EnSite Precision Cardiac Mapping System. , Available from: https://manuals.sjm.com (2017).
- Tsuchiya, T. Three-dimensional mapping of cardiac arrhythmias - string of pearls. Circ J. 76 (3), 572-581 (2012).
- Cano, O., et al. Utility of high density multielectrode mapping during ablation of scar-related ventricular tachycardia. J Cardiovasc Electrophysiol. 28 (11), 1306-1315 (2017).
- Schaeffer, B., et al. Characterization, mapping and ablation of complex atrial tachycardia: initial experience with a novel method of ultra-high-density 3D mapping. J Cardiovasc Electrophysiol. 27 (10), 1139-1150 (2016).
- Latcu, D. G., et al. Selection of critical isthmus in scar-related atrial tachycardia using a new automated ultrahigh resolution mapping system. Circ Arrhythm Electrophysiol. 10 (1), (2017).
Reprints and Permissions
Request permission to reuse the text or figures of this JoVE article
Request PermissionThis article has been published
Video Coming Soon
Copyright © 2025 MyJoVE Corporation. All rights reserved