
A subscription to JoVE is required to view this content. Sign in or start your free trial.
Method Article
Homogeneous Time-resolved Förster Resonance Energy Transfer-based Assay for Detection of Insulin Secretion
In This Article
Summary
Here, we present homogeneous time resolved FRET (HTRF) as an efficient method for rapid detection of insulin secreted from cells.
Abstract
The detection of insulin secretion is critical for elucidating mechanisms of regulated secretion as well as in studies of metabolism. Though numerous insulin assays have existed for decades, the recent advent of homogeneous time-resolved Förster Resonance Energy Transfer (HTRF) technology has significantly simplified these measurements. This is a rapid, cost-effective, reproducible, and robust optical assay reliant upon antibodies conjugated to bright fluorophores with long lasting emission which facilitates time-resolved Förster Resonance Energy Transfer. Moreover, HTRF insulin detection is amenable for the development of high-throughput screening assays. Here we use HTRF to detect insulin secretion in INS-1E cells, a rat insulinoma-derived cell line. This allows us to estimate basal levels of insulin and their changes in response to glucose stimulation. In addition, we use this insulin detection system to confirm the role of dopamine as a negative regulator of glucose-stimulated insulin secretion (GSIS). In a similar manner, other dopamine D2-like receptor agonists, quinpirole, and bromocriptine, reduce GSIS in a concentration-dependent manner. Our results highlight the utility of the HTRF insulin assay format in determining the role of numerous drugs in GSIS and their pharmacological profiles.
Introduction
The regulation of energy metabolism is fine-tuned by a major anabolic hormone, insulin. Insulin is synthesized and released by pancreatic beta cells in response to increased extracellular glucose levels. The released insulin triggers the uptake of glucose by insulin-sensitive tissues1,2. Physiologically, this is linked to the elevation of glucose concentration after a meal, followed by secretion of insulin to regulate glucose uptake. Disturbances in glucose homeostasis lead to metabolic impairments culminating in insulin resistance and ultimately in the onset of type 2 diabetes2,3,4.
Although insulin secretion has been extensively studied, its regulatory mechanisms remain poorly understood. A critical area of investigation has been identification of novel modulators of insulin secretion by beta cells5,6,7,8. These studies require a better understanding of the coupling relationship between glucose stimulation and insulin secretion. Therefore, the ability to accurately monitor and quantify the levels of glucose-stimulated insulin secretion (GSIS) has been essential. To date, however, only a limited number of methods were available to allow quantification of GSIS using insulin-secreting cell lines and/or pancreatic islets. One is radioimmunoassay (RIA), which utilizes radioisotope-tagged insulin and antibodies. The main limitations of this approach include safety issues due to the handling and disposal of radioactive materials. Additionally, this method is labor-intensive, involving multiple long washing and incubation steps. Enzyme-linked immunosorbent assay (ELISA) is another costly and labor-intensive approach that utilizes antibodies for insulin detection. Variation in antibody affinities and in the efficiency of recognizing insulin are limiting factors of this method and can affect the reproducibility of the results. Neither ELISA nor RIA was designed for high-throughput experiments. AlphaScreen is a homogeneous assay used for detecting and measuring levels of insulin secretion. AlphaScreen technology is based on the conversion of ambient oxygen into an excited oxygen singlet state that can react with chemiluminescent species, resulting in the generation of chemiluminescence. Because the assay is homogenous, many of the washing steps associated with RIA and ELISA are eliminated. However, the instability of the signal due to the nature of the reaction is a limiting factor that may affect the readout of the assay. (TR-PINCER, developed by Heyduk and colleagues9, is another homogenous approach to insulin measurement based on the binding of two separate antibodies to different epitopes on the insulin molecule. The antibodies are each chemically linked to double stranded DNA with short complementary single stranded DNA overhangs. Binding of the antibodies to insulin brings them together and leads to a double stranded DNA duplex. Each antibody is also associated with a respective donor or acceptor fluorophore, and the association of the DNA duplex brings together these fluorophores to generate Förster resonance energy transfer (FRET). One potential limitation of TR-PINCER, however, rests with the FRET itself. The inability to rapidly dissipate background fluorescence during the FRET reaction may lead to relatively high levels of background fluorescence and a low signal to noise ratio within the assay. Therefore, a need still exists for a reliable, robust, and cost-effective assay for quantifying GSIS in a high-throughput manner.
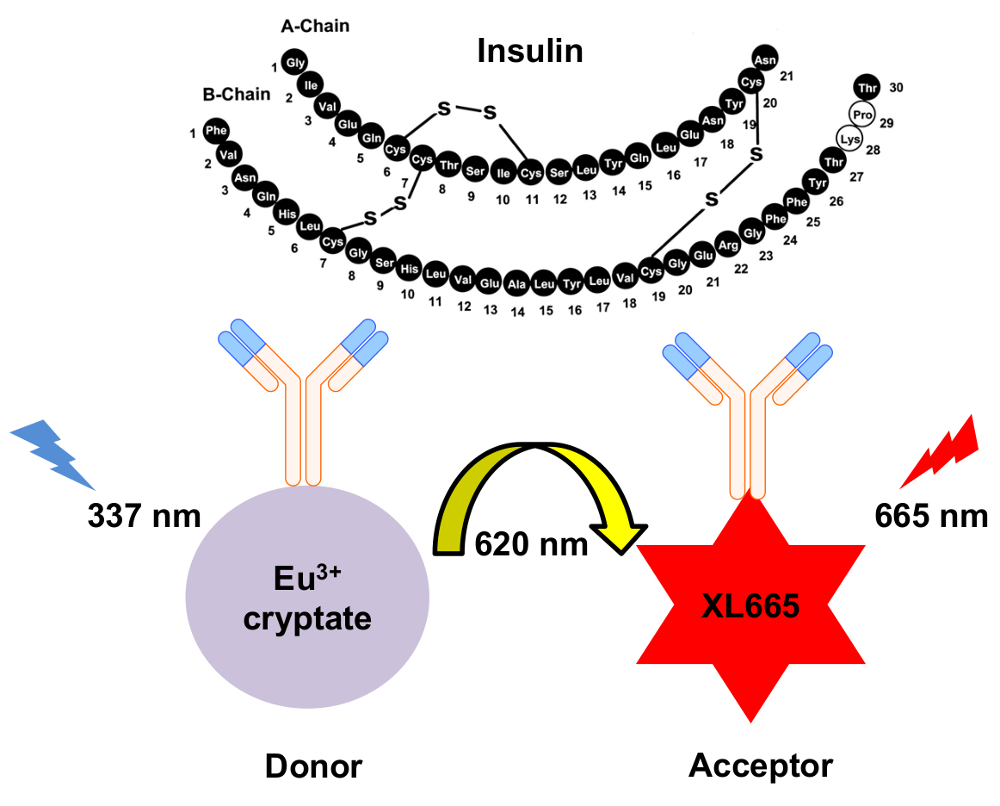
Recent advances in biophysics have culminated in the development of a homogeneous time-resolved fluorescence energy resonance transfer (HTRF) based assay. Specifically, while the energy transfer within the assay may be described as FRET-based, more accurately, HTRF relies on luminescence energy resonance transfer (LRET)10 which is the non-radiative transfer of energy between the donor and acceptor species11,12,13. This distinction is important, since the timing of a fluorescence or quenching based FRET interaction is much different than it is for LRET, though the same types of gating can be used for FRET and LRET. Moreover, the use of rare earth lanthanide cryptate compounds such as europium or terbium cryptate in HTRF produces long fluorescence half-lives12,14. This offers the unique advantage of the introduction of a time delay (µsec) between donor excitation and the measurement of emission from the acceptor (i.e., time-resolved assay). This time delay allows for sufficient time for the background fluorescence to dissipate prior to measurement of acceptor emission fluorescence. Consequently, the readout is free of non-specific fluorescence and thus, a high signal-to-noise ratio is achieved (Figure 1). Furthermore, the homogenous nature of HTRF eliminates the need for washing steps to wash off the unbound species, making the assay much more rapid than ELISA or RIA-based methods.

Figure 1: Schematic of the mechanism for HTRF insulin detection. Two independently generated monoclonal antibodies specifically recognize and bind to insulin at separate sites. These antibodies are conjugated to either the europium cryptate donor or the XL665 acceptor. Excitation of the donor at 337 nm results in emission at 620 nm. The resulting energy transfer causes XL665 to emit at a longer wavelength, 665 nm. Please click here to view a larger version of this figure.
Here, we provide a detailed protocol for using an HTRF-based approach to determine the levels of GSIS from INS-1E cells, a well-established insulin-secreting beta cell-derived rat insulinoma cell line15. In addition, this assay may be used for identifying the pharmacological profile of molecular regulators of insulin secretion. We apply this HTRF-based insulin assay to examine dopamine D2-like receptor regulation of GSIS. Increasing studies have revealed that the neurotransmitter dopamine is an important regulator of GSIS8,16,17,18,19,20,21,22. Dopamine affects GSIS in a negative autocrine/paracrine manner via actions on the dopamine D2-like receptors (D2, D3, D4 receptors) expressed at the surface of beta pancreatic cells8,16,19. Using this assay, we confirm dopamine's role as a negative regulator of GSIS and demonstrate that the dopamine D2-like receptor agonists bromocriptine and quinpirole also reduce GSIS.
Access restricted. Please log in or start a trial to view this content.
Protocol
1. INS-1E Cells: Maintenance and Plating
- Maintain INS-1E cells in a humidified 37 ˚C/5% CO2 incubator and cultured with RPMI 1640 medium supplemented with 5% (v/v) heat-inactivated fetal bovine serum, 2 mM L-glutamine, 10 mM HEPES, 1 mM sodium pyruvate, 100 U/mL Penicillin/Streptomycin solution, 50 µM β-mercaptoethanol. Culture cells in 10 mL complete RPMI 1640 medium (per plate), until they reach 80 - 90% confluence, when they can be trypsinized and passaged or used for the insulin secretion assay.
- Day 1: Aspirate media and wash cells once with 5 mL of pre-warmed PBS. Add 0.5 mL of trypsin (0.025%) diluted 1:1 in 0.5 mL PBS to trypsinize the cells and incubate for 3 - 4 min at 37 ˚C. Deactivate trypsin by adding 9 mL complete media and transfer cells to a 15 mL centrifuge tube by pipetting.
- Pellet cells by centrifugation and re-suspend the cell pellet in approximately 5 mL fresh media.
- Take 10 µL of the re-suspended cells and mix with 10 µL Trypan Blue vital dye to check for cell viability. Count live and dead cells in 10 µL of this mixture using a hemocytometer. Viability level should be above 90%. Dilute the re-suspended cells in fresh media to 1 million cells per mL.
- Seed 0.5 mL INS-1E cells per well in a poly-L-Lysine pre-coated 24-well plate, at a density of 500,000 cells/well.
- Day 2: Remove media 18 - 24 h after plating and add 500 µL/well of fresh RPMI 1640 media. Incubate the cells for another 24 h to allow cells to fully recover from the prior passaging step. This additional time permits the cells to spread on the tissue culture plate.
2. Insulin Secretion Assay (Day 3)
- Prepare KRB buffer: 132.2 mM NaCl, 3.6 mM KCl, 5 mM NaHCO3, 0.5 mM NaH2PO4, 0.5 mM MgCl2, 1.5 mM CaCl2, and 0.001 g/mL bovine serum albumin (BSA), pH 7.4.
- Aspirate media from cells and wash twice with pre-warmed PBS.
- For the glucose starvation step, add 450 µL/well KRB (containing BSA) without glucose for 1 h at 37 ˚C/5% CO2.
- During the glucose starvation step, prepare serial dilutions of the drug(s) in KRB containing 200 mM Glucose (10x concentration).
- Prepare drug at 10x the final concentration in KRB supplemented with 200 mM glucose (also 10x the final assay glucose concentration). If the drug stock (plus the added 10x glucose) is in DMSO, make sure DMSO percentage is kept consistent throughout the assay (ideally final percentage of less than 0.1% DMSO).
- For dopamine and quinpirole treatments, use a final assay drug concentration range of 100 µM to 100 pM (from highest to lowest concentration), with the last point of the dose response containing no drug. For bromocriptine, use a final assay concentration range of 10 µM to 10 pM, with the last point of the dose response being the drug-free control.
- After glucose starvation, add drug serial dilutions to the assay to produce a dose response.
- Add 50 µL/well of each serial dilution to the corresponding wells (total assay volume 500 µL).
- For the glucose stimulation step, incubate cells with the respective drug serial dilutions (in the presence of 20 mM glucose) for 90 min at 37 ˚C/5% CO2. Include a set of control wells: (1) stimulation with 20 mM glucose alone in the absence of any additional drug and (2) cells that are neither stimulated with drug nor glucose (which provides a basal rate of secretion).
- After the stimulation step, carefully remove the supernatants (use directly or store at 4 ˚C).
NOTE: An additional 5 min gentle centrifugation step (600 x g, 1 min) may be introduced at this point to remove any remaining cells in the assay supernatants.
3. HTRF to Measure Insulin Secretion
- Dilute assay supernatants 1:10 in KRB (without BSA), preferably in clear 96-well plates.
- Prepare the insulin standard curve for the HTRF insulin assay (Table 1).
| Standard stock solution 500 ng/ml | Serial dilutions | Working [insulin] ng/ml |
| STD 7 | 30 µl Stock + 140 µl KRB | 150 |
| STD 6 | 30 µl STD 7 + 45 µl KRB | 60 |
| STD 5 | 30 µl STD 6 + 45 µl KRB | 24 |
| STD 4 | 30 µl STD 5 + 45 µl KRB | 9.6 |
| STD 3 | 30 µl STD 4 + 45 µl KRB | 3.84 |
| STD 2 | 30 µl STD 3 + 45 µl KRB | 1.54 |
| STD 1 | 30 µl STD 2 + 45 µl KRB | 0.61 |
| STD 0 | 45 µl KRB | 0 |
| Note: STD Stock is 500 ng/ml | ||
Table 1. Serial dilutions to make the insulin standard curve.
- Add the standard curve samples and the diluted assay supernatants to the HTRF plate. The measurement of secreted insulin by HTRF can be carried out in either a 96-well or a 384-well plate format, keeping in mind that the assay volume has to be re-adjusted. Use 10 µL/well sample in 96-well white half-area plates or 5 µL/well in a 384-well white low-volume, round-bottom plate (see Table of Materials).
- Prepare antibody mix in detection buffer (see Table of Materials) in a 1:2 donor (cryptate)/acceptor (XL-665) ratio.
NOTE: Further specific details about the HTRF assay are available from the manufacturer. - Add antibody mix to the assay at 30 µL/well (for a 96 well-plate assay format) or 15 µL/well (for a 384-well plate assay format).
- Seal the plate and incubate at room temperature.
- Read plate after 2 h, 4 h, and/or overnight incubation with antibodies using the plate reader and the appropriate HTRF optic module (337 665 620 nm) (see Table of Materials and manufacturer's instructions). Set the integration start at 60 µs and the integration time at 400 µs. Use 200 flashes per well.
NOTE: These parameters were based on the use of our particular reader. The readout at 620 nm and 665 nm may vary between different instruments. This is one of the reasons we suggest using the 665/620 ratio. In calculating this ratio, any potential differences from reader to reader will be normalized and provide consistent values irrespective of the instrument used to measure HTRF.
4. Data Analysis and Normalization
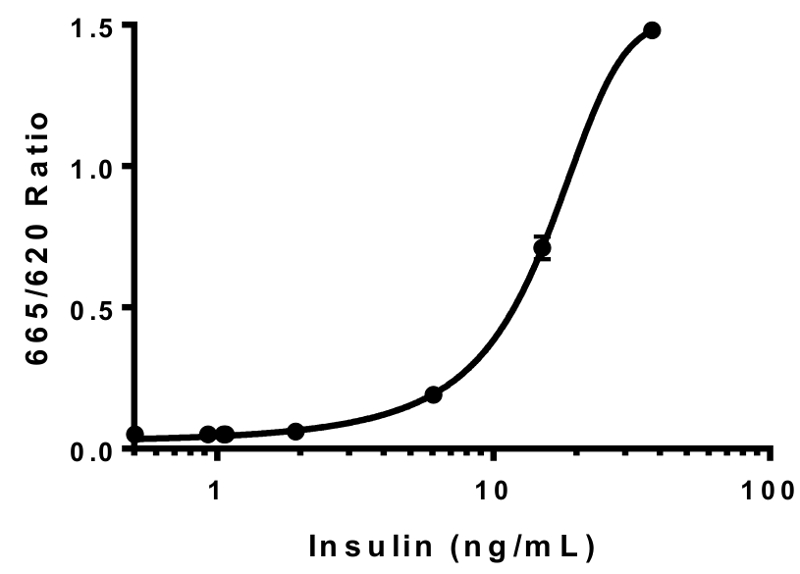
- Calculate the insulin concentrations of the assay wells via extrapolation of ratiometric fluorescence readings (665 nm/620 nm) to a second order quadratic polynomial curve (Figure 2).

Figure 2: Insulin standard curve. Human insulin stock of known concentrations was used to generate the insulin standard curve. The resulting HTRF ratios (665 nm/ 620 nm) were plotted against the insulin concentrations. The data was best fit to a second order quadratic polynomial curve (R2 = 0.99996). This is a representative standard curve. Error bars = SEM. Please click here to view a larger version of this figure.
- With the extrapolated data as ng/mL of insulin secreted, normalize (insulin secreted in response to increasing ligand concentrations) to the average value of the % maximum insulin secretion assay wells (20 mM glucose alone condition).
- Use the curve fit (R2) from a single experiment to calculate the intraplate variation. Within the experiment, derived the individual R2 values from the intra-experimental duplicates, allowing calculation the standard error of the mean for the curve fit.
- For determining the interplate variation, use the data from at least three individual experiments to calculate the standard error of the mean for the R2 value of the collective curve.
Access restricted. Please log in or start a trial to view this content.
Results
We validated our insulin HTRF assay by generating an insulin standard curve using purified human insulin standards of predefined concentrations (Figure 2). Generation of the standard curve permitted us to extrapolate the ratiometric fluorescence readings and thus to determine the secreted insulin levels in response to the drug treatments (Figure 2). Intraplate variation for curve fitting was minimal (R2 = 0.99...
Access restricted. Please log in or start a trial to view this content.
Discussion
The HTRF insulin assay described here offers a rapid, efficient system to measure insulin secretion from a cultured cell-based system. Among its most important advantages, this assay offers a low background signal due to the high signal-to-noise ratio. Additionally, we have confirmed that the HTRF signal is stable for extended periods of time (>24 h)7. Nevertheless, since the insulin-binding monoclonal antibodies quickly reach binding saturation after addition to the assay, kinetics of antibod...
Access restricted. Please log in or start a trial to view this content.
Disclosures
We thank Nicolas Pierre (Cisbio Bioassays) for helpful advice and Dr. Pierre Maechler (University of Geneva) for generously providing INS-1E cells. This work was supported by funding from the Department of Defense (grant PR141292 to Z.F.), and the John F. and Nancy A. Emmerling Fund of The Pittsburgh Foundation (to Z.F.).
Acknowledgements
The authors have nothing to disclose.
Access restricted. Please log in or start a trial to view this content.
Materials
| Name | Company | Catalog Number | Comments |
| 96-well white half area plate | Greiner Bio-One | 82050-042 | |
| 384-well white low-volume, round-bottom plate | Corning | 15100157 | |
| Insulin High Range Kit | Cisbio Bioassays | 62IN1PEH | 10,000 test HTRF-based insulin assay kit |
| PHERAstar FSX plate reader | BMG Labtech | FSX | Plate reader adapted for HTRF-based assay readings |
| Plate sealers | Fisher Scientific | DY992 | To seal plate while antibodies incubate |
| Hemocytometer | Hausser Scientific | 3100 | |
| RPMI Medium 1640 (1x) | Gibco | 11875-093 | [+] L-glutamine |
| Trypsin 0.05% | Corning | 25-052-CI | 0.53 mM EDTA, (-) sodium bicarbonate |
| DPBS (Dulbecco's phosphate buffered saline) | Corning | 21-031-CV | Without calcium and magnesium |
| Fetal Bovine Serum | Corning | 35-010-CV | |
| HEPES | Gibco | 156-30-080 | |
| Sodium pyruvate | Gibco | 11360070 | |
| Penicillin/Streptomycin solution 100x | Corning | 30-002 CT | |
| 2-mercaptoethanol | Sigma | M1348 | |
| Trypan Blue Stain (0.4%) | Gibco | 15250-061 | |
| Dopamine hydrochloride | Sigma | 8502 | |
| Bromocriptine mesylate | Tocris | 427 | |
| (-)-Quinpirole hydrochloride | Tocris | 1061 | |
| Bovine Serum Albumin | Calbiochem | 12659 | |
| Poly-L-Lysine | Sigma | P4832 | |
| Glucose | Sigma | G7021 | |
| DMSO (Dimethyl sulfoxide) | Sigma | 276855 |
References
- Taniguchi, C. M., Emanuelli, B., Kahn, C. R. Critical nodes in signalling pathways: Insights into insulin action. Nat Rev Mol Cell Biol. 7 (2), 85-96 (2006).
- Vetere, A., Choudhary, A., Burns, S. M., Wagner, B. K. Targeting the pancreatic beta-cell to treat diabetes. Nat Rev Drug Discov. 13 (4), 278-289 (2014).
- Despres, J. P., Lemieux, I. Abdominal obesity and metabolic syndrome. Nature. 444 (7121), 881-887 (2006).
- Kahn, S. E., Hull, R. L., Utzschneider, K. M. Mechanisms linking obesity to insulin resistance and type 2 diabetes. Nature. 444 (7121), 840-846 (2006).
- Barg, S. Mechanisms of exocytosis in insulin-secreting B-cells and glucagon-secreting A-cells. Pharmacol Toxicol. 92 (1), 3-13 (2003).
- Braun, M., Ramracheya, R., Rorsman, P. Autocrine regulation of insulin secretion. Diabetes Obes Metab. 14 Suppl 3, 143-151 (2012).
- Farino, Z. J., et al. Development of a rapid insulin assay by homogenous time-resolved fluorescence. PLoS One. 11 (2), e0148684(2016).
- Simpson, N., et al. Dopamine-mediated autocrine inhibitory circuit regulating human insulin secretion in vitro. Mol Endocrinol. 26 (10), 1757-1772 (2012).
- Heyduk, E., Moxley, M. M., Salvatori, A., Corbett, J. A., Heyduk, T. Homogeneous insulin and C-Peptide sensors for rapid assessment of insulin and C-peptide secretion by the islets. Diabetes. 59 (10), 2360-2365 (2010).
- Heyduk, T. Measuring protein conformational changes by FRET/LRET. Curr Opin Biotechnol. 13 (4), 292-296 (2002).
- Degorce, F. HTRF((R)): Pioneering technology for high-throughput screening. Expert Opin Drug Discov. 1 (7), 753-764 (2006).
- Degorce, F., et al. HTRF: A technology tailored for drug discovery - a review of theoretical aspects and recent applications. Curr Chem Genomics. 3, 22-32 (2009).
- Mathis, G. HTRF(R) Technology. J Biomol Screen. 4 (6), 309-314 (1999).
- Daijo, J. E., Sportsman, J. R. A time-resolved fluorescence immunoassay for insulin in rodent plasma. J Pharm Biomed Anal. 19 (3-4), 335-342 (1999).
- Merglen, A., et al. Glucose sensitivity and metabolism-secretion coupling studied during two-year continuous culture in INS-1E insulinoma cells. Endocrinology. 145 (2), 667-678 (2004).
- Ustione, A., Piston, D. W. Dopamine synthesis and D3 receptor activation in pancreatic beta-cells regulates insulin secretion and intracellular [Ca(2+)] oscillations. Mol Endocrinol. 26 (11), 1928-1940 (2012).
- Ustione, A., Piston, D. W. A simple introduction to multiphoton microscopy. J Microsc. 243 (3), 221-226 (2011).
- Ustione, A., Piston, D. W., Harris, P. E. Minireview: Dopaminergic regulation of insulin secretion from the pancreatic islet. Mol Endocrinol. 27 (8), 1198-1207 (2013).
- Rubi, B., et al. Dopamine D2-like receptors are expressed in pancreatic beta cells and mediate inhibition of insulin secretion. J Biol Chem. 280 (44), 36824-36832 (2005).
- Garcia-Tornadu, I., et al. Disruption of the dopamine d2 receptor impairs insulin secretion and causes glucose intolerance. Endocrinology. 151 (4), 1441-1450 (2010).
- Garcia-Tornadu, I., et al. New insights into the endocrine and metabolic roles of dopamine D2 receptors gained from the Drd2 mouse. Neuroendocrinology. 92 (4), 207-214 (2010).
- Lopez Vicchi, F., et al. Dopaminergic drugs in type 2 diabetes and glucose homeostasis. Pharmacol Res. 109, 74-80 (2016).
- Kalra, S., Kalra, B., Agrawal, N., Kumar, S. Dopamine: The forgotten felon in type 2 diabetes. Recent Pat Endocr Metab Immune Drug Discov. 5 (1), 61-65 (2011).
- Mahajan, R. Bromocriptine mesylate: FDA-approved novel treatment for type-2 diabetes. Indian J Pharmacol. 41 (4), 197-198 (2009).
- Caicedo, A. Paracrine and autocrine interactions in the human islet: more than meets the eye. Semin Cell Dev Biol. 24 (1), 11-21 (2013).
- Ballon, J. S., Pajvani, U., Freyberg, Z., Leibel, R. L., Lieberman, J. A. Molecular pathophysiology of metabolic effects of antipsychotic medications. Trends Endocrinol Metab. , (2014).
- Freyberg, Z., Aslanoglou, D., Shah, R., Ballon, J. S. Intrinsic and antipsychotic drug-induced metabolic dysfunction in schizophrenia. Front Neurosci. 11, 432(2017).
- de Leeuw van Weenen, E. J., et al. The dopamine receptor D2 agonist bromocriptine inhibits glucose-stimulated insulin secretion by direct activation of the alpha2-adrenergic receptors in beta cells. Biochem Pharmacol. 79 (12), 1827-1836 (2010).
Access restricted. Please log in or start a trial to view this content.
Reprints and Permissions
Request permission to reuse the text or figures of this JoVE article
Request PermissionThis article has been published
Video Coming Soon
Copyright © 2025 MyJoVE Corporation. All rights reserved