
A subscription to JoVE is required to view this content. Sign in or start your free trial.
Method Article
Use of Autometallography to Localize and Semi-Quantify Silver in Cetacean Tissues
In This Article
Summary
A protocol is presented to localize Ag in cetacean liver and kidney tissues by autometallography. Furthermore, a new assay, named the cetacean histological Ag assay (CHAA) is developed to estimate the Ag concentrations in those tissues.
Abstract
Silver nanoparticles (AgNPs) have been extensively used in commercial products, including textiles, cosmetics, and health care items, due to their strong antimicrobial effects. They also may be released into the environment and accumulate in the ocean. Therefore, AgNPs are the major source of Ag contamination, and public awareness of the environmental toxicity of Ag is increasing. Previous studies have demonstrated the bioaccumulation (in producers) and magnification (in consumers/predators) of Ag. Cetaceans, as the apex predators of ocean, may have been negatively affected by the Ag/Ag compounds. Although the concentrations of Ag/Ag compounds in cetacean tissues can be measured by inductively coupled plasma mass spectroscopy (ICP-MS), the use of ICP-MS is limited by its high capital cost and the requirement for tissue storage/preparation. Therefore, an autometallography (AMG) method with an image quantitative analysis by using formalin-fixed, paraffin-embedded (FFPE) tissue may be an adjuvant method to localize Ag distribution at the suborgan level and estimate the Ag concentration in cetacean tissues. The AMG positive signals are mainly brown to black granules of various sizes in the cytoplasm of proximal renal tubular epithelium, hepatocytes, and Kupffer cells. Occasionally, some amorphous golden yellow to brown AMG positive signals are noted in the lumen and basement membrane of some proximal renal tubules. The assay for estimating the Ag concentration is named the Cetacean Histological Ag Assay (CHAA), which is a regression model established by the data from image quantitative analysis of the AMG method and ICP-MS. The use of AMG with CHAA to localize and semi-quantify heavy metals provides a convenient methodology for spatio-temporal and cross-species studies.
Introduction
Silver nanoparticles (AgNPs) have been extensively used in commercial products, including textiles, cosmetics, and health care items, due to their great antimicrobial effects1,2. Therefore, the production of AgNPs and the number of AgNP-containing products are increased over time3,4. However, AgNPs may be released into the environment and accumulate in the ocean5,6. They have become the major source of Ag contamination, and the public awareness of the environmental toxicity of Ag is increasing.
The status of AgNPs and Ag in the marine environment is complicated and constantly changing. Previous studies have indicated that AgNPs can remain as particles, aggregate, dissolve, react with different chemical species, or be regenerated from Ag+ ions7,8. Several types of Ag compounds, such as AgCl, have been found in marine sediments, where they can be ingested by benthic organisms and enter the food chain9,10. According to a previous study conducted in the Chi-ku Lagoon area along the southwestern coast of Taiwan, the Ag concentrations of marine sediments are extremely low and similar to the crustal abundance, and those of fish liver tissue are usually below the detection limit (< 0.025 μg/g wet/wet)11. However, previous studies conducted in different countries have demonstrated relatively high Ag concentrations in the livers of cetaceans12,13. The Ag concentration in the livers of cetaceans is age-dependent, suggesting that the source of Ag in their bodies is most likely their prey12. These findings further suggest the biomagnification of Ag in animals at higher trophic levels. Cetaceans, as the apex predators in the ocean, may have suffered negative health impacts caused by Ag/Ag compounds12,13,14. Most importantly, like cetaceans, humans are mammals, and the negative health impacts caused by Ag/Ag compounds in cetaceans may also occur in humans. In other words, cetaceans could be sentinel animals for the health of marine environment and humans. Therefore, the health effects, the tissue distribution, and concentration of Ag in cetaceans are of great concern.
Although the concentrations of Ag/Ag compounds in cetacean tissues can be measured by inductively coupled plasma mass spectroscopy (ICP-MS), the use of ICP-MS is limited by its high capital cost (instrument and maintenance) and the requirements for tissue storage/preparation12,15. In addition, it is usually difficult to collect comprehensive tissue samples in all investigations of stranded cetacean cases due to logistical difficulties, a shortage of manpower, and a lack of related resources12. The frozen tissue samples for ICP-MS analysis are not easily stored because of limited refrigeration space, and frozen tissue samples may be discarded due to broken refrigeration equipment12. These aforementioned obstacles hamper investigations of contamination levels in cetacean tissues by ICP-MS analysis using frozen tissue samples. In contrast, formalin fixed tissue samples are relatively easy to collect during the necropsy of dead-stranded cetaceans. Therefore, it is necessary to develop an easy to use and inexpensive method to detect/measure the heavy metals in cetacean tissues by using formalin fixed tissue samples.
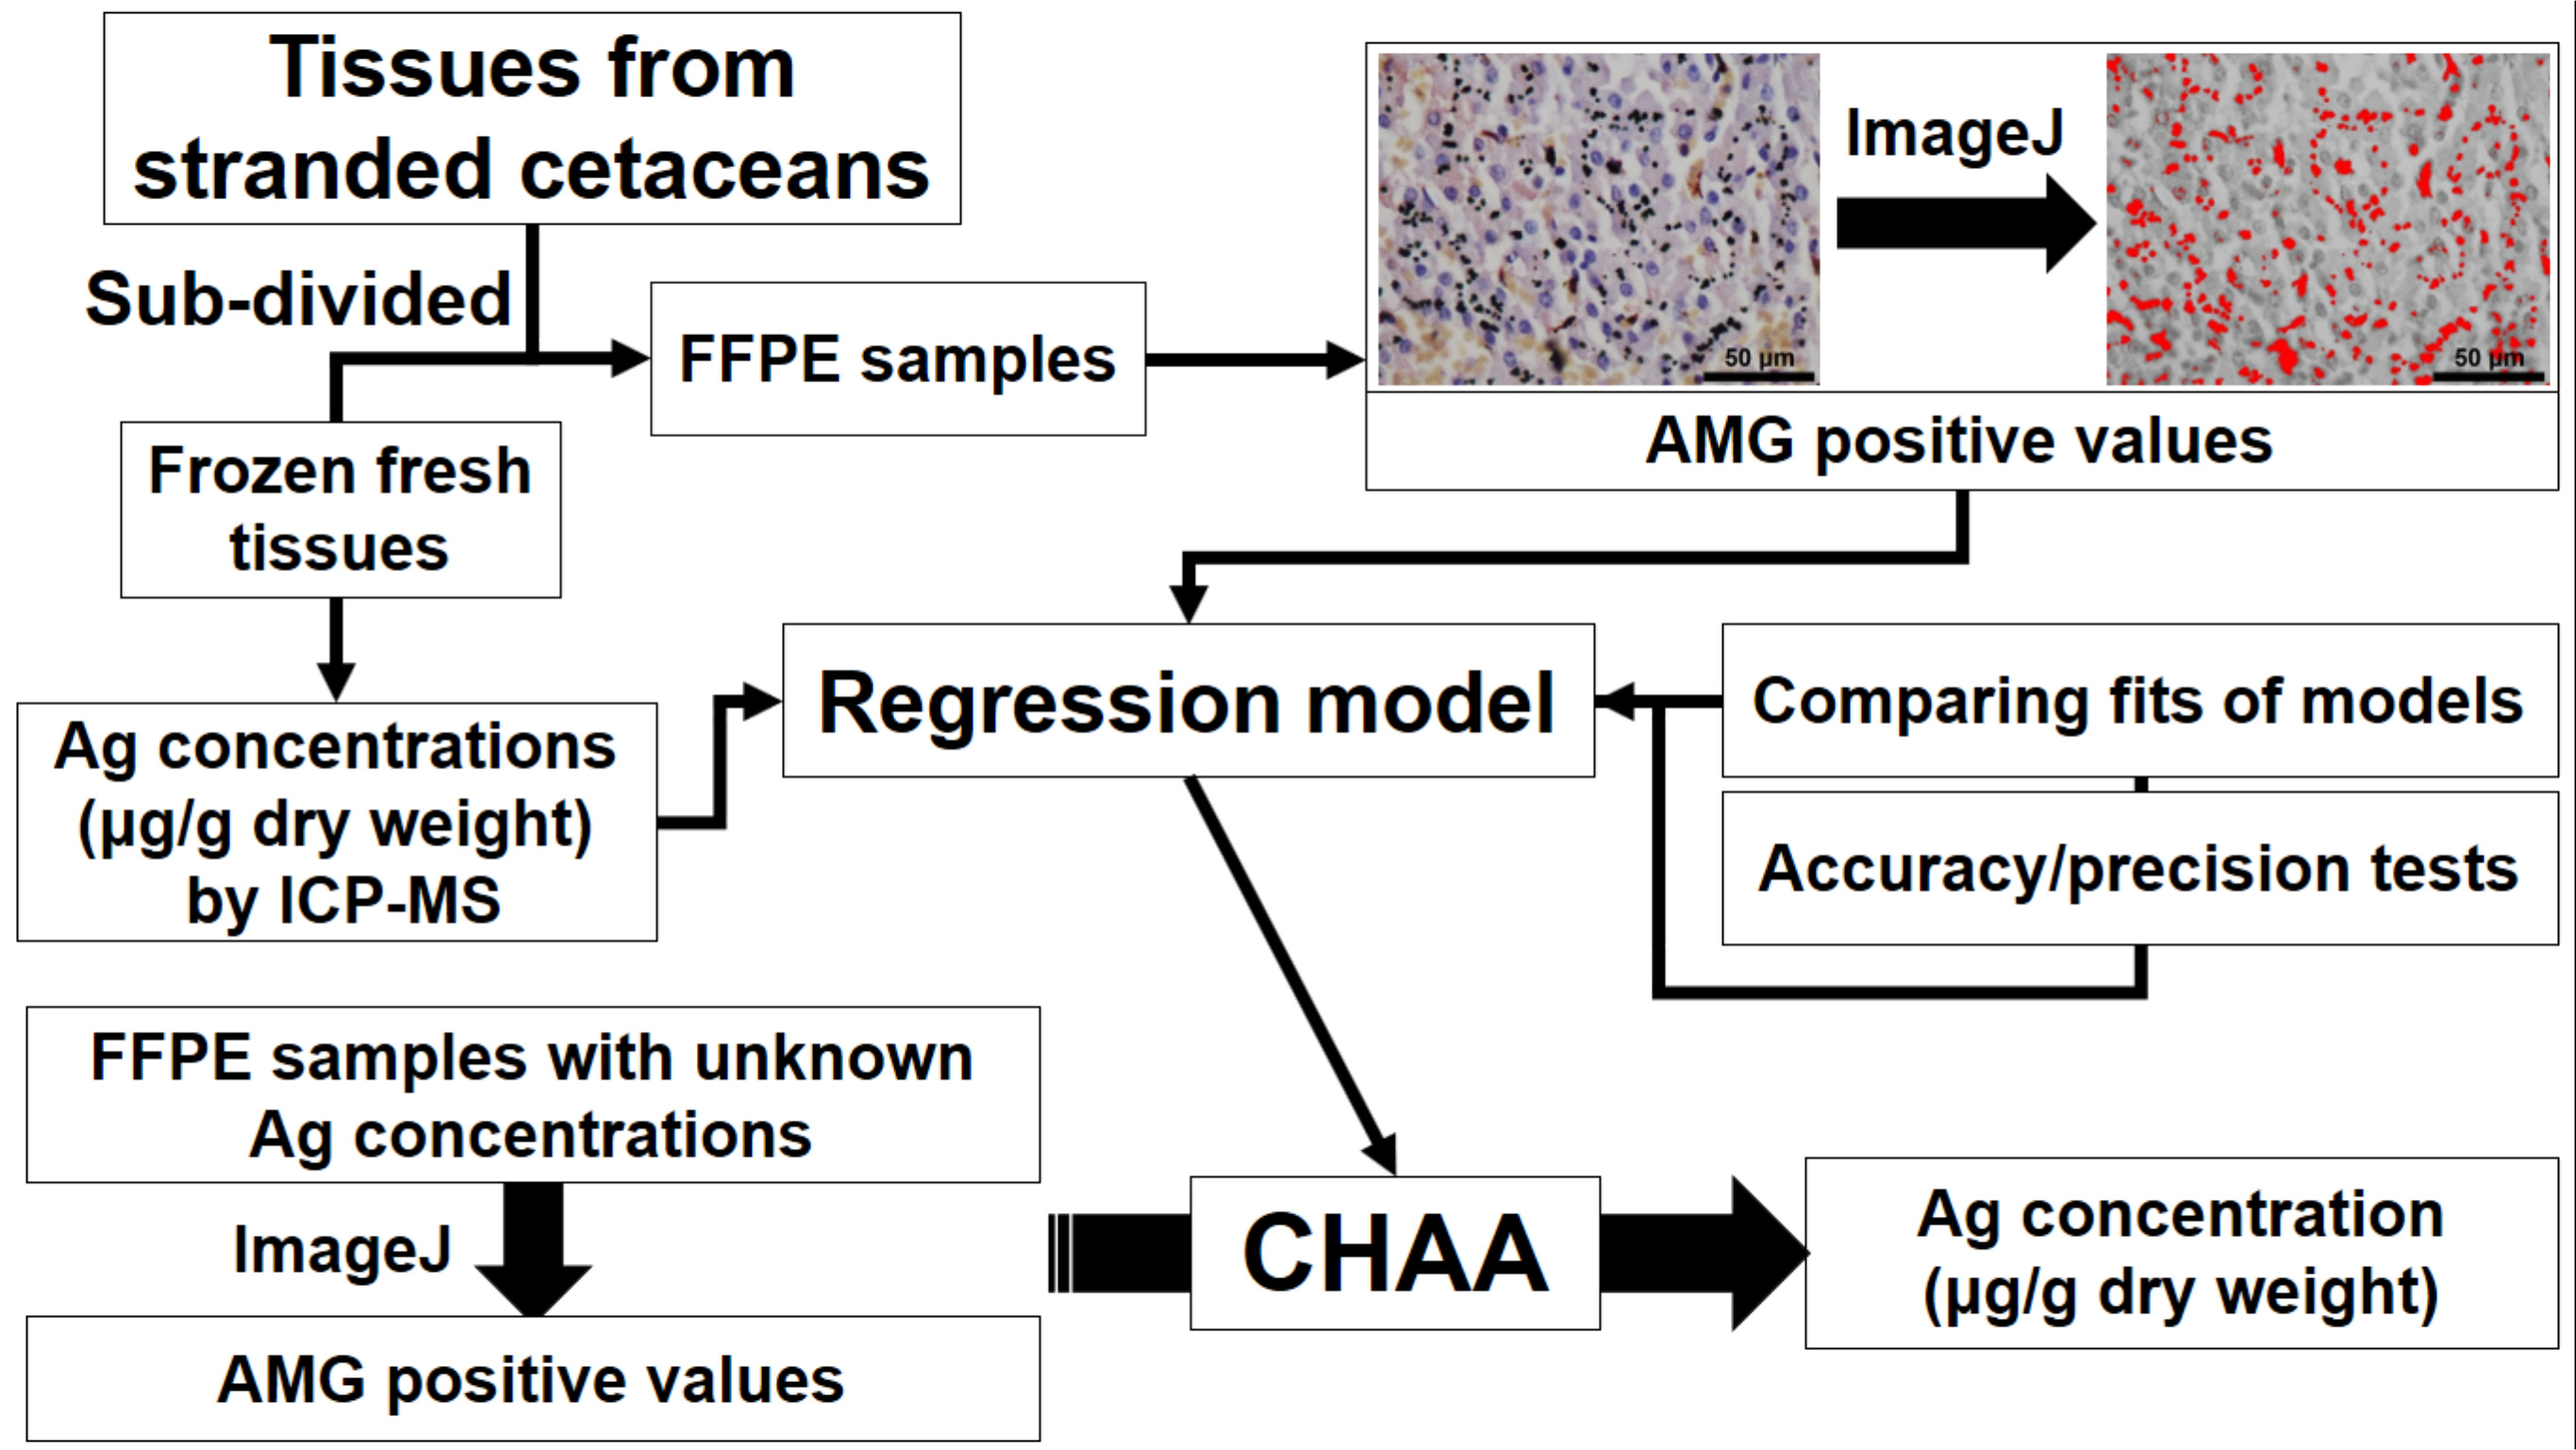
Although the suborgan distributions and concentrations of alkali and alkaline earth metals may be altered during the formalin-fixed, paraffin-embedded (FFPE) process, only lesser effects on transition metals, such as Ag, have been noted16. Hence, FFPE tissue has been considered as an ideal sample resource for metal localization and measurements16,17. Autometallography (AMG), a histochemical process, can amplify heavy metals as variably sized golden yellow to black AMG positive signals on FFPE tissue sections, and these amplified heavy metals can be visualized under light microscopy18,19,20,21. Hence, the AMG method provides information on the suborgan distributions of heavy metals. It can provide important additional information for studying the metabolic pathways of heavy metals in biological systems because ICP-MS can only measure the concentration of heavy metals at the organ level18. Furthermore, digital image analysis software, such as ImageJ, has been applied to the quantitative analysis of histological tissue sections22,23. The variably-sized golden yellow to black AMG positive signals of FFPE tissue sections can be quantified and used to estimate the concentrations of heavy metals. Although the absolute Ag concentration cannot be directly determined by the AMG method with image quantitative analysis, it can be estimated by a regression model based on the data obtained from the image quantitative analysis and ICP-MS, which is named cetacean histological Ag assay (CHAA). Considering the difficulties in measuring Ag concentrations by ICP-MS analysis in most stranded cetaceans, CHAA is a valuable adjuvant method to estimate Ag concentrations in cetacean tissues, which cannot be determined by ICP-MS analysis due to the lack of frozen tissue samples. This paper describes the protocol of a histochemical technique (AMG method) for localizing Ag at the suborgan level and an assay named CHAA to estimate the Ag concentrations in the liver and kidney tissues of cetaceans.

Figure 1: Flowchart depicting the establishment and application of cetacean histological Ag assay (CHAA) for estimating Ag concentrations. CHAA = cetacean histological Ag assay, FFPE = Formalin-fixed, paraffin-embedded, ICP-MS = inductively coupled plasma mass spectroscopy. Please click here to view a larger version of this figure.
Protocol
The study was performed in accordance with international guidelines, and the use of cetacean tissue samples was permitted by the Council of Agriculture of Taiwan (Research Permit 104-07.1-SB-62).
1. Tissue Sample Preparation for ICP-MS Analysis
Note: The liver and kidney tissues were collected from freshly dead and moderately autolyzed stranded cetaceans24, including 6 stranded cetaceans of 4 different species, 1 Grampus griseus (Gg), 2 Kogia spp. (Ko), 2 Lagenodelphis hosei (Lh), 1 Stenella attenuata (Sa). Each stranded cetacean had a field number for individual identification. The tissue sample preparation for ICP-MS analysis followed the method established in M.H. Chen's lab, and M.H. Chen's lab conducted the ICP-MS analysis11,13,25.
- Collect liver and kidney tissues for ICP-MS analysis from stranded cetaceans and store them at −20 °C until use.
- Collect pair-matched liver and kidney tissues from the same stranded cetaceans for AMG analysis (please see step 2).
- Trim the outer layer of the tissue samples collected for ICP-MS analysis with a stainless-steel scalpel. Cut the inner part of the tissue samples into small cubes (about 1 cm3) and place them in zip lock plastic bags. Normally, each bag contains 10 g of the tissues.
- Store the plastic bags containing tissue samples at −20 °C for subsequent procedures.
- Put the 1 cm3 cubes samples in a freeze dry system (-50 °C, Vacuum pump with a displacement of at least 98 L/min, 0.002 mBar) for at least 72 h till completely dried by weighing to the constant.
- Homogenize the dried cubes into powder with a homogenizer for subsequent tissue digestion.
- Weigh 0.3 g of homogenized freeze-dried samples in 30 mL polytetrafluoroethylene (PTFE) bottles and mix them with 10 mL of 65% w/w nitric acid.
- Put closures on the PTFE bottles, but leave the closures untightened.
Note: This allows the brown fume to form in the PTFE bottles and reflux inside the bottle for digestion until the brown fume disappears and turns clear. - Heat the digested samples with a hot plate, from 30 °C to 110/120 °C (according to the brown fume forming condition) in the PTFE bottles for 2 to 3 weeks until the brownish gas in the PTFE bottles becomes colorless and the liquid in the PTFE bottles becomes translucent greenish pale yellow or completely clear.
Note: Perform the heating process in chemical fume hood. - Heat the digested samples at 120 °C to evaporate the nitric acid in the PTFE bottles until only 0.5-1 mL remains.
Note: Perform the heating process in a chemical fume hood, and always monitor the temperature increase to ensure that no brownish gas leaks from the PTFE bottles’ closures. - Tighten the closures and cool them at room temperature for about 1 h.
- Place the funnels with filter papers on 25 mL volumetric flasks and wash the remaining liquid with 1 M HNO3 to a final volume of 25 mL.
Note: Wash the bottle for at least three times and the closure twice. - Validate the analytical quality of ICP-MS analysis by using the standard reference materials, including DOLT-2 (dogfish liver) and DORM-2 (dogfish muscle).
- Use duplicates of each analytical sample and triplicates of standard reference materials for ICP-MS analysis.
- Average the Ag concentrations of each analytic samples and present the data as dry weight basis concentration (μg/g dry weight).
2. Tissue Sample Preparation for AMG Analysis
- Collect pair-matched liver and kidney tissues for AMG analysis from a stranded cetacean and fix them in 10% neutral buffered formalin until use.
Note: Store the tissue samples in plastic bottles in 10% neutral buffered formalin (NBF, pH 7.0) for 24 to 48 hours. The volume of NBF should be at least 10 times greater than the tissue volume. - Trim the formalin fixed liver and kidney tissues with stainless steel disposable microtome blades and put the trimmed tissue sections in cassettes with labels.
Note: The size of each tissue sections should be approximately 2 cm x 1 cm and the thickness of each tissue section should not exceed 3 mm. Put the liver and kidney tissues from the same individual in the same cassette. - Dehydrate the trimmed tissue sections with a tissue processor through a series of graded ethanol (70% for 1 h, 80% for 1 h, 95% for 1 h, 95% for 2 h, 100% for 1 h x 2 staining dishes, and 100% for 2 h), non-xylene (for 1 h and 2 h in different staining dishes), and immerse the dehydrated tissue samples in paraffin (for 1 h and 2 h in different staining dishes).
- Place the dehydrated tissue samples in the bottoms of steel histology molds and embed the dehydrated tissue samples with paraffin.
- Chill the formalin fixed paraffin-embedded (FFPE) tissue blocks on cold plate until the paraffin solidifies. Trim the FFPE blocks with the microtome until the tissue surface is exposed.
- Chill the FFPE blocks at −20 °C for 10 min. Section the FFPE blocks at 5 µm by microtome.
- Fill a water bath with double-distilled water at 45 °C. Lift the ribbons of tissue sections and make them float on the surface of the warm water by using tweezers and brushes.
- Separate the ribbons of tissue sections with tweezers. Place a section onto a microscope slide.
- Place the microscope slides on a slide warmer and allow sections to dry overnight at 37 °C.
- Put the microscope slides in slide racks and deparaffinize them by soaking them in 3 different staining dishes of pure non-xylene (approximately 200 to 250 mL) for 8, 5, and 3 min.
- Hydrate the tissue sections in slide racks by soaking them in different staining dishes of graded ethanol solutions (100% ethanol twice, 90% ethanol once and 80% ethanol once [1 min each]), and rinse them in double-distilled water.
Note: These solutions are approximately 200 to 250 mL in different staining dishes. For each wash, 30 sec is enough. - Rinse the tissue sections in phosphate-buffered saline (PBS) with 0.5% Triton X-100, wash them with PBS for several times, and then rinse them in double-distilled water.
Note: These solutions are approximately 200 to 250 mL in different staining dishes. For each was, 30 sec is enough. - Prepare equal amounts of the three components (initiator, moderator, and activator) provided by silver enhancement kit in dark and mix them thoroughly.
Note: The solutions of moderator and activator are sticky, so please use pipette with wide tip openings (or cut the tips to create wider openings). For each slide, 300 μL of the mixed solution (depending on the size of the tissue section) is usually enough. Therefore, if 10 slides are used, the amount of each component (initiator, moderator, and activator) is 1000 μL (the mixed solution is 3000 μL for 10 slides). - Incubate the tissue sections in the mixed solution for 15 min in the dark at room temperature. Fully cover the tissue sections on the slides with the mixed solution. A longer incubation time may lead to false-positive AMG signals.
- Wash the slides with double-distilled water and stain them in hematoxylin for 10 s as a counterstain.
- Wash the slides with running tap water, dry them, and mount them with mounting medium.
- Examine the slides under a light microscope.
- Randomly capture ten histological images with a 40X objective lens from each tissue section by using a connected digital camera with computer imaging software.
3. Semi-Quantitative Analysis for AMG Positive Values of Histological Images
Note: AMG positive value means the percentage of the area with AMG positive signals.
- Use image analysis software (ImageJ) to analyze the histological images.
- Open the histological image by pressing File | Open.
- Split the chosen picture into three color channels (red, blue, and green) by pressing Image | Type | RGB Stack.
- Quantify the AMG positive signals by using the blue channel. Nuclear false positive signals are usually decreased under the blue channel when hematoxylin stain is applied for nuclear counterstain (Figure 2).
- Measure the percentage of the area with AMG positive signals in each histological image with the threshold tool (Image | Adjust | Threshold).
- Manually adjust the cut-off value of the threshold for each histological image (from 90 to 110) based on the presences of false positive areas in nuclei and/or red blood cells.
Note: In default setting, the AMG positive signals should be highlighted in red. - Press Analyze | Set Measurements, and check the box of Area Fraction to specify that the area fraction is recorded.
- Press Analyze | Measure. The positive percent area of each histological image is displayed in the column of %Area of the Result window.
- Average the positive percent areas of 10 histological images from each tissue section and define the result as the AMG positive value for each tissue section.

Figure 2: The presence of nuclear false positive signals under different color channels (counterstain: hematoxylin stain). Representative nuclear false positive signals are indicated by yellow arrows. PPA = positive percentage of areas. Please click here to view a larger version of this figure.
4. Establishment of the Cetacean Histological Ag Assay (CHAA) by Regression Model
Note: The following analysis is performed in Prism 6.01 for Windows.
- Evaluate the correlation between the results of ICP-MS and AMG positive values.
- Open the software, create a new project file, and choose XY and Correlation.
- Input data including the results of ICP-MS and AMG positive values.
- Press Analysis and choose Correlation under the category XY Analysis to analyze the strength of association between the results of the ICP-MS and AMG positive values by Pearson correlation analysis.
Note: The results of the ICP-MS and AMG positive values have to be positively correlated with each other; otherwise, the subsequent regression model should not be developed. - Statistically compare the regression models, including linear regression, quadratic regression, cubic regression, and linear regression through origin, through statistics software12,26,27.
Note: If the regression model generates an unrealistic Ag concentration, the regression model should be abandoned12. - Go back to the Data Table (left panel) and press Analysis | Nonlinear regression (curve fit) under the category XY Analysis | OK.
- In the window Parameters: Nonlinear regression, choose different regression model in the page Fit and then compare different regression models in the page Compare.
- In the page Compare, choose the comparison methods, including the extra sum-of-squares F test and Akaike's information criterion (AIC). According to the results of the comparison methods, use a relatively appropriate regression model in the CHAA.
- Estimate Ag concentrations of the cetacean liver and kidney tissues with unknown Ag concentrations by using the CHAA.
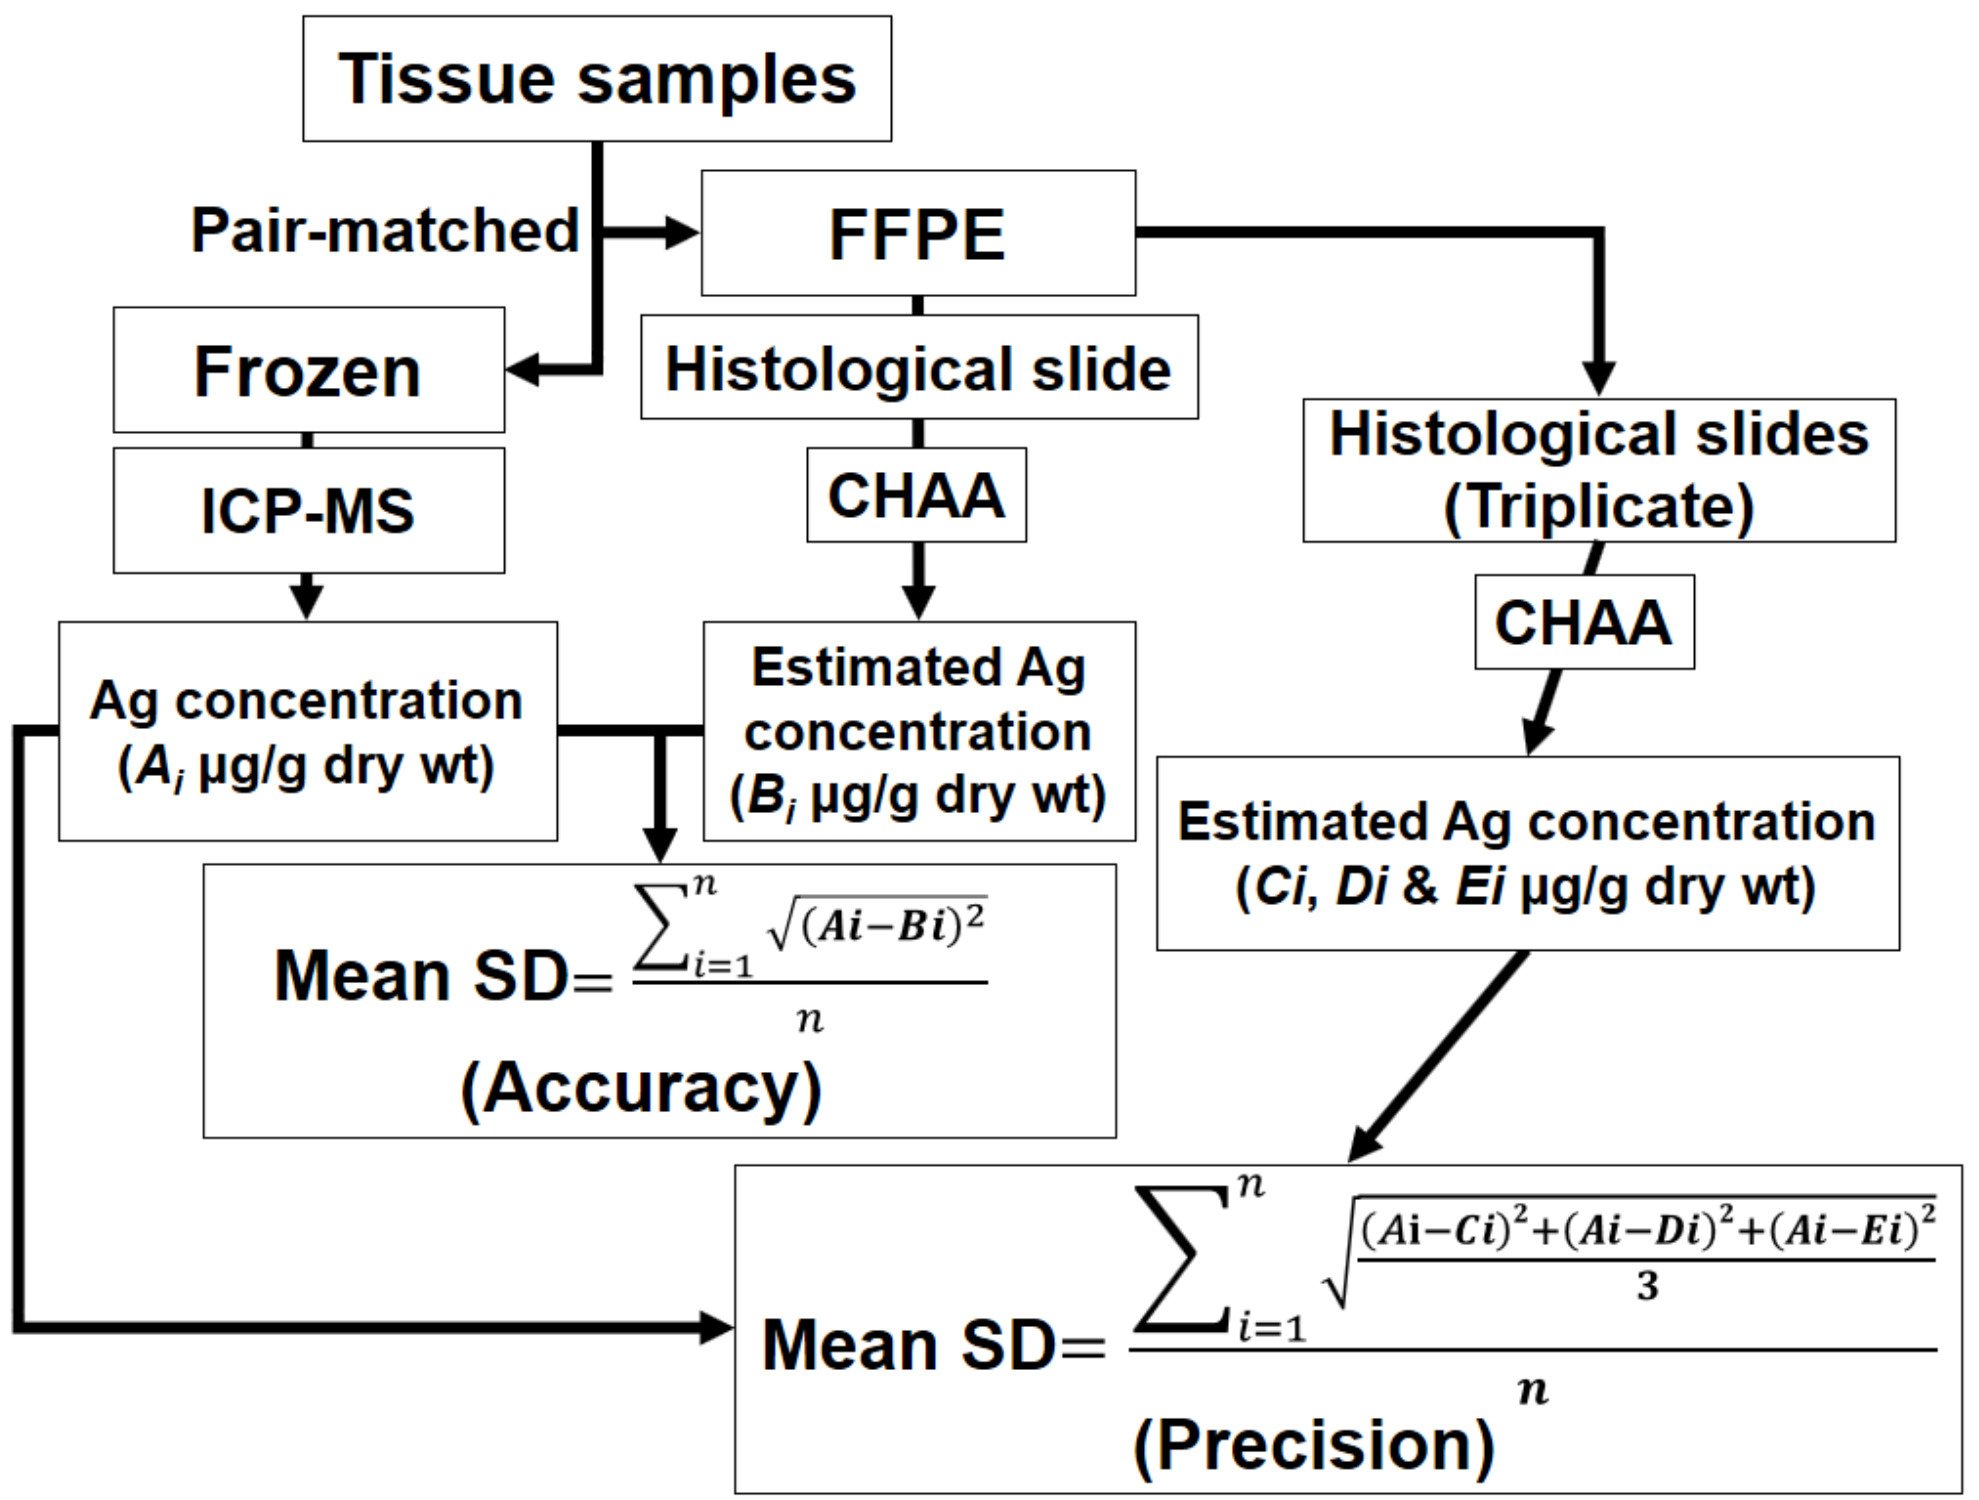
- Evaluate the accuracy and precision of the CHAA for liver and kidney tissues. The difference between precision and accuracy is illustrated in Figure 3.
- Accuracy: Calculate the mean standard deviation (SD) from differences between known and estimated Ag concentrations.
- Precision: Perform repeated measurement (at least triplicate) of AMG positive values of serial sections from the same FFPE tissues. Calculate the mean SD of measurements from liver or kidney tissues from differences between known and estimated Ag concentrations
Note: The methods of evaluating the accuracy and precision are depicted in Figure 4.

Figure 3: The difference between accuracy and precision. Accuracy means how close the measurement is to the true value (i.e., Ag concentration determined by ICP-MS); precision means the repeatability of the measurement (i.e., the consistency among the repeated measurements of AMG positive values from the triplicate tissue sections). Please click here to view a larger version of this figure.

Figure 4: The scheme depicting the methods of evaluating the accuracy and precision. CHAA = cetacean histological Ag assay; FFPE = Formalin-fixed, paraffin-embedded; ICP-MS = inductively coupled plasma mass spectroscopy; Ai = Each of the Ag concentrations determined by ICP-MS of each pair-matched tissue sample; Bi = Each of the Ag concentrations estimated by CHAA of each pair-matched tissue sample; Ci, Di, and Ei = Each of The Ag concentrations estimated by CHAA of triplicate samples from each pair-matched tissue sample; i = 1 to n. Please see raw data of the accuracy and precision tests in the section of representative results. Please click here to view a larger version of this figure.
5. Estimation of Ag Concentrations by CHAA.
- Collect the liver and kidney tissues from stranded cetaceans and fix them in 10% neutral buffered formalin.
- Process the formalin-fixed tissues routinely (please see step 2).
- Estimate the Ag concentrations of the cetacean liver and kidney tissues with unknown Ag concentrations by CHAA (please see steps 3 and 4).
Results
Representative images of the AMG positive signals in the cetacean liver and kidney tissues are shown in Figure 5. The AMG positive signals include variably-sized brown to black granules of various sizes in the cytoplasm of proximal renal tubular epithelium, hepatocytes, and Kupffer cells. Occasionally, amorphous golden yellow to brown AMG positive signals are noted in the lumen and basement membrane of some proximal renal tubules. There is a positive correlat...
Discussion
The purpose of the article study is to establish an adjuvant method to evaluate the Ag distribution at suborgan levels and to estimate Ag concentrations in cetacean tissues. The current protocols include 1) Determination of Ag concentrations in cetacean tissues by ICP-MS, 2) AMG analysis of pair-matched tissue samples with known Ag concentrations, 3) Establishment of the regression model (CHAA) for estimating the Ag concentrations by AMG positive values, 4) Evaluation of the accuracy and precision of CHAA, and 5) Estimat...
Disclosures
The authors have nothing to disclose.
Acknowledgements
We thank the Taiwan Cetacean Stranding Network for sample collection and storage, including the Taiwan Cetacean Society, Taipei; the Cetacean Research Laboratory (Prof. Lien-Siang Chou), the Institute of Ecology and Evolutionary Biology, National Taiwan University, Taipei; the National Museum of Natural Science (Dr. Chiou-Ju Yao), Taichung; and the Marine Biology & Cetacean Research Center, National Cheng-Kung University. We also thank the Forestry Bureau, Council of Agriculture, Executive Yuan for their permit.
Materials
| Name | Company | Catalog Number | Comments |
| HQ Silver enhancement kit | Nanoprobes | #2012 | |
| Surgipath Paraplast | Leica Biosystems | 39601006 | Paraffin |
| 100% Ethanol | Muto Pure Chemical Co., Ltd | 4026 | |
| Non-Xylene | Muto Pure Chemical Co., Ltd | 4328 | |
| Silane coated slide | Muto Pure Chemical Co., Ltd | 511614 | |
| Cover glass (25 x 50 mm) | Muto Pure Chemical Co., Ltd | 24501 | |
| Malinol | Muto Pure Chemical Co., Ltd | 20092 | |
| GM Haematoxylin Staining | Muto Pure Chemical Co., Ltd | 3008-1 | |
| 10% neutral buffered formalin solution | Chin I Pao Co., Ltd | --- | |
| Tip (1000 μL) | MDBio, Inc. | 1000 | |
| PIPETMAN Classic P1000 | Gilson, Inc. | F123602 | |
| 15 ml Centrifuge Tube | GeneDireX, Inc. | PC115-0500 | |
| Dogfish liver | National Research Council of Canada | DOLT-2 | |
| Dogfish muscle | National Research Council of Canada | DORM-2 | |
| Inductively coupled plasma mass spectrometry (ICP-MS) | PerkinElmer Inc. | PE-SCIEX ELAN 6100 DRC | |
| FreeZone 6 liter freeze dry system | Labconco | 7752030 | For freeze drying |
| BRAND® SILBERBRAND volumetric flask | Merck | Z326283 | |
| 30 mL standard vial, flat interior with 33 mm closure | Savillex Corporation | 200-030-12 | For diagestion |
| Nitric acid, superpur®, 65.0% | Merck | 1.00441 | For diagestion |
| Hot Plate/Stirrers | Corning® | PC-220 | For diagestion |
| High Shear lab mixer | Silverson | SL2T | For homogenization |
| Sterile polypropylene sample jar (250mL) | Thermo Scientific™ | 6186L05 | For homogenization |
| Digital camera | Nikon Corporation | DS-Fi2 | |
| Light microscope | Nikon Corporation | ECLIPSE Ni-U | |
| Shandon™ Finesse™ 325 manual microtome | Thermo Scientific™ | A78100001H | |
| Accu-Cut® SRM™ 200 rotary microtome | Sakura | 1429 | |
| Microtome blade S35 | FEATHER® | 207500000 | |
| Slide staining dish and cover | Brain Research Laboratories | #3215 | |
| Steel staining rack | Brain Research Laboratories | #3003 | |
| Shandon embedding center | Thermo Scientific™ | S-EC | |
| Shandon Citadel® tissue processor | Thermo Scientific™ | 69800003 | |
| Slide warmer | Lab-Line Instruments | 26005 | |
| Water bath | Shandon Capshaw | 3964 | |
| Filter paper | Merck | 1541-070 | |
| Prism 6.01 for windows | GraphPad Software | Statistic software | |
| ImageJ | National Institutes of Health | ||
| Stainless steel tissue embedding mould | Shenyang Roundfin Trade Co., Ltd | RD-TBM003 | For paraffin emedding |
References
- McGillicuddy, E., et al. Silver nanoparticles in the environment: Sources, detection and ecotoxicology. Science Total Environment. 575, 231-246 (2017).
- Yu, S. J., Yin, Y. G., Liu, J. F. Silver nanoparticles in the environment. Environmental Science: Processes and Impacts. 15 (1), 78-92 (2013).
- Hansen, S. F., et al. Nanoproducts- what is actually available to European consumers?. Environmental Science: Nano. 3 (1), 169-180 (2016).
- Vance, M. E., et al. Nanotechnology in the real world: Redeveloping the nanomaterial consumer products inventory. Beilstein Journal of Nanotechnology. 6, 1769-1780 (2015).
- Farre, M., Gajda-Schrantz, K., Kantiani, L., Barcelo, D. Ecotoxicity and analysis of nanomaterials in the aquatic environment. Analytical and Bioanalytical Chemistry. 393 (1), 81-95 (2009).
- Walters, C. R., Pool, E. J., Somerset, V. S. Ecotoxicity of silver nanomaterials in the aquatic environment: a review of literature and gaps in nano-toxicological research. Journal of Environmental Science and Health. Part A, Toxic/hazardous Substances & Environmental Engineering. 49 (13), 1588-1601 (2014).
- Levard, C., Hotze, E. M., Lowry, G. V., Brown, G. E. Environmental transformations of silver nanoparticles: impact on stability and toxicity. Environmental Science & Technology. 46 (13), 6900-6914 (2012).
- Massarsky, A., Trudeau, V. L., Moon, T. W. Predicting the environmental impact of nanosilver. Environmental Toxicology and Pharmacology. 38 (3), 861-873 (2014).
- Wang, H., et al. Toxicity, bioaccumulation, and biotransformation of silver nanoparticles in marine organisms. Environmental Science and Technology. 48 (23), 13711-13717 (2014).
- Buffet, P. E., et al. A marine mesocosm study on the environmental fate of silver nanoparticles and toxicity effects on two endobenthic species: the ragworm Hediste diversicolor and the bivalve mollusc Scrobicularia plana. Science of the Total Environment. 470, 1151-1159 (2014).
- Chen, M. H. Baseline metal concentrations in sediments and fish, and the determination of bioindicators in the subtropical Chi-ku Lagoon, S W Taiwan. Marine Pollution Bulletin. 44 (7), 703-714 (2002).
- Li, W. T., et al. Investigation of silver (Ag) deposition in tissues from stranded cetaceans by autometallography (AMG). Environmental Pollution. , 534-545 (2018).
- Chen, M. H., et al. Tissue concentrations of four Taiwanese toothed cetaceans indicating the silver and cadmium pollution in the western Pacific Ocean. Marine Pollution Bulletin. 124 (2), 993-1000 (2017).
- Li, W. T., et al. Immunotoxicity of silver nanoparticles (AgNPs) on the leukocytes of common bottlenose dolphins (Tursiops truncatus). Scientific Reports. , (2018).
- Bornhorst, J. A., Hunt, J. W., Urry, F. M., McMillin, G. A. Comparison of sample preservation methods for clinical trace element analysis by inductively coupled plasma mass spectrometry. American Journal of Clinical Pathology. 123 (4), 578-583 (2005).
- Bonta, M., Torok, S., Hegedus, B., Dome, B., Limbeck, A. A comparison of sample preparation strategies for biological tissues and subsequent trace element analysis using LA-ICP-MS. Analytical and Bioanalytical Chemistry. 409 (7), 1805-1814 (2017).
- Bischoff, K., Lamm, C., Erb, H. N., Hillebrandt, J. R. The effects of formalin fixation and tissue embedding of bovine liver on copper, iron, and zinc analysis. Journal of Veterinary Diagnostic Investigation. 20 (2), 220-224 (2008).
- Miller, D. L., Yu, I. J., Genter, M. B. Use of Autometallography in Studies of Nanosilver Distribution and Toxicity. International Journal of Toxicology. 35 (1), 47-51 (2016).
- Anderson, D. S., et al. Influence of particle size on persistence and clearance of aerosolized silver nanoparticles in the rat lung. Toxicological Sciences. 144 (2), 366-381 (2015).
- Kim, W. Y., Kim, J., Park, J. D., Ryu, H. Y., Yu, I. J. Histological study of gender differences in accumulation of silver nanoparticles in kidneys of Fischer 344 rats. Journal of Toxicology and Environmental Health, Part A. 72 (21-22), 1279-1284 (2009).
- Danscher, G. Applications of autometallography to heavy metal toxicology. Pharmacology Toxicology. 68 (6), 414-423 (1991).
- Deroulers, C., et al. Analyzing huge pathology images with open source software. Diagnostic Pathology. 8, 92 (2013).
- Shu, J., Dolman, G. E., Duan, J., Qiu, G., Ilyas, M. Statistical colour models: an automated digital image analysis method for quantification of histological biomarkers. BioMedical Engineering Online. 15, 46 (2016).
- Geraci, J. R., Lounsbury, V. J. Specimen and data collection. Marine mammals ashore: a field guide for strandings. , 167-230 (2005).
- Shih, C. -. C., Liu, L. -. L., Chen, M. -. H., Wang, W. -. H. . Investigation of heavy metal bioaccumulation in dolphins from the coastal waters off Taiwan. , (2001).
- Liang, C. S., et al. The relationship between the striatal dopamine transporter and novelty seeking and cognitive flexibility in opioid dependence. Progress in Neuro-Psychopharmacology and Biological Psychiatry. 74, 36-42 (2017).
- Spiess, A. N., Neumeyer, N. An evaluation of R2 as an inadequate measure for nonlinear models in pharmacological and biochemical research: a Monte Carlo approach. BMC Pharmacology. 10, 6 (2010).
- Stoltenberg, M., Danscher, G. Histochemical differentiation of autometallographically traceable metals (Au, Ag, Hg, Bi, Zn): protocols for chemical removal of separate autometallographic metal clusters in Epon sections. Histochemical Journal. 32 (11), 645-652 (2000).
- Dimitriadis, V. K., Domouhtsidou, G. P., Raftopoulou, E. Localization of Hg and Pb in the palps, the digestive gland and the gills in Mytilus galloprovincialis (L.) using autometallography and X-ray microanalysis. Environmental Pollution. 125 (3), 345-353 (2003).
- Loumbourdis, N. S., Danscher, G. Autometallographic tracing of mercury in frog liver. Environmental Pollution. 129 (2), 299-304 (2004).
- Stoltenberg, M., Larsen, A., Kemp, K., Bloch, D., Weihe, P. Autometallographic tracing of mercury in pilot whale tissues in the Faroe Islands. International Journal of Circumpolar Health. 62 (2), 182-189 (2003).
Reprints and Permissions
Request permission to reuse the text or figures of this JoVE article
Request PermissionThis article has been published
Video Coming Soon
Copyright © 2025 MyJoVE Corporation. All rights reserved