
A subscription to JoVE is required to view this content. Sign in or start your free trial.
Method Article
Online Explorative Study on the Learning Uses of Virtual Reality Among Early Adopters
In This Article
Summary
This article describes the profile of Spanish early adopters of virtual reality and their interests and preferences regarding learning and educational applications for this technology. To this aim, we designed an online questionnaire and interviewed 117 users of the main virtual reality forum on the Internet.
Abstract
Virtual reality (VR) has shown great educational potential because it makes it possible to simulate any desired situation or event, thus playing an important role in addressing current educational challenges. Despite the unlimited learning possibilities that VR may offer, unless users are willing to apply virtual devices to education, the investment of time, money, and effort will be fruitless. It is therefore crucial to assess the educational interest of the first generation of VR users and to identify their current needs. To this end, in this study we designed an online questionnaire and applied it through the SaaS (Software as a service) of a private server. The sample consisted of 117 early VR adopters recruited via a main portal of communication and information technologies in Spain. In order to engage participants, we posted a thread in the main forum, which is dedicated to the advances and potential uses of VR. Once the responses were gathered, we analyzed the relationship between 12 variables (mean contrasts with Snedecor's F, and contingency analysis with chi-square and Sommer's d). The results showed that the current profile of a VR user is a male over 35 years old, with university studies, and who has purchased his viewer recently (<1 year). As for the learning and teaching applications that these users were interested in, only 13.7% of the participants in this study use VR for educational purposes, although 28.2% were interested, indicating that perhaps the lack of applications or learning experiences may be hampering the use of VR within education. Almost half of the early adopters surveyed would like to learn using VR technology and are somehow optimistic about the relationship between VR and education, particularly those who are younger.
Introduction
Information and communication technologies are evolving rapidly to make it easier for human beings to communicate and relate to each other, and the distance and time that someone needs to contact and interact with someone else is reduced. However, this connection, when made through technology, is still much poorer and limited than face-to-face contact1.
VR provides a major advance in simulating physical experiences, allowing us to interact within a computer environment that feels real, giving us a sense of presence and closeness. This is one of the main reasons why VR occupies a privileged place in the plans of technology development of important companies. However, if they want to meet the needs of their potential customers, research on VR is essential to accomplish this goal2.
In Spain, as in most Western societies, the emergence of the first commercial head-mounted displays (HMD) capable of providing acceptable immersion experiences3 increased the interest in VR, leading to the development of software and VR experiences. For instance, some of the most important VR studies are currently Spanish, such as Vertical Robot, awarded multiple times for its products4, or the Tessera Studios and Dual Mirror Games, all of them of international prestige. The educational and scientific spheres have also experienced a whole explosion of research and applied educational experiences from 2015 onwards, as shown in the review by Aznar-Díaz, Romero-Rodríguez, and Rodríguez-García5.
Most universities are already aware of the crucial role that VR will play not only in the business and industry sector, but also in many scientific disciplines. Therefore, they are working on several research and innovation lines. For example, the Alfonso X el Sabio University is a pioneer worldwide in the use of VR simulation and augmented reality for training future doctors at the "UAX Virtual Simulation Hospital", unique in the world. Furthermore, this university applies VR in social, psychological, and educational research6.
Since the popularization of the Internet a few decades ago, different educational methodologies have evolved towards the so-called e-learning that a growing number of universities are adopting7,8. This online learning system is aimed at developing distance learning through technological means, some of which were developed specifically for it, while others were incorporated and adapted for educational purposes. However, e-learning is not exempt from limitations when it comes to social interaction. In this sense, VR considerably reduces some of these shortcomings, making interaction between people easier and much more realistic than any other technology. Also, it takes advantage of all the possibilities that technology offers us, creating an almost infinite world of opportunities3. For instance, VR would allow us to travel through the universe, or along the seabed, to see dinosaurs, to observe the microscopic world, or even to live emotions associated with certain experiences and social events in a simulated way. Therefore, VR could be a vital educational resource, helping teachers in their struggle to engage students with classroom topics 9,10,11.
However, not every aspect of VR is positive, and some downsides must be considered. As mentioned above, it would be useless to develop new and educational applications for VR if the potential trainees and students were not willing to use it or preferred other forms of e-learning, which could be narrower yet more aligned with their true interests and preferences. This is why the desired relationship between VR and learning not only depends on a world of exciting possibilities, but more importantly, on building this relationship upon real social needs and demands. We must bear in mind that VR was recently targeted by companies, and that less than 1% of the total worldwide population has used it. VR is also a technology that is still in its infancy and that cannot be understood if someone has not used it. This last point explains why VR is surrounded by so many prejudices that result either from ignorance or from the social fear of novelty12,13.
To bridge this gap between potential uses of VR and actual demand, it is necessary to find out the expectations of those early adopters that purchase HMDs as soon as they are available in the market. These users are so powerfully attracted to technological innovations that they do not fear purchasing new products that may succeed or fail commercially. Therefore, unlike the rest of the population, the uncertainty that surrounds these new products does not affect them. For this reason, they are the first to discover the real possibilities of VR technology not yet established in the market. Consequently, they can provide information at a real user level, making them a valuable source for this study.
As a sampling method, we designed an online examination questionnaire that was filled out by a representative convenience sample of early adopters. Participants were recruited from a VR forum in a Spanish portal for communication and information technologies, digital leisure, and video games with more than 460,000 users and ten million monthly visits14 (Table of Materials). We created a thread that received 2,000 visits in less than 2 months. The participants who accessed the questionnaire through the hyperlink responded to all the questions raised.
So far, in Spain this is the only website with a specific VR forum and more than 400 threads. Around 76,000 early VR adopters contributed messages and posts talking about all HMDs and platforms on the market15. For this reason, it is the best place to locate a homogeneous convenience sample of early VR adopters. According to Jager, Putnick, and Bornstein16, when a subgroup is homogeneous on one or more sociodemographic factors, we can estimate results with clearer generalizability, providing more accurate accounts of population effects and subpopulation differences. It also eliminates possible biases common in heterogenous convenience sampling.
Our research goals were: (1) to study the profile of early adopters; (2) to examine the current state of VR as an educational technology, determining its degree of implementation; (3) to assess the acceptance of VR as a learning tool among early adopters.
Protocol
The protocol was submitted to the Scientific and Ethical Committee of the Nebrija University, in which a group of external experts reviewed and validated the process. To be able to participate in the study, we required a written acceptance informed consent as recommended by the Declaration of Helsinki17, and it was made clear to the participants that they were not going to be involved in any experimental condition.
1. Design of the research instrument
- Design a first draft of the questionnaire to meet the goals of the study (see a sample draft of the questionnaire provided as Supplementary File 1).
NOTE: The draft is created with Microsoft Word so it can be easily shared and modified. Questions included single, multiple, and open answers that were grouped in different thematic pages:
- Page 1: Accept a written informed consent obligatorily.
- Page 2: Demographic and social data of participants.
- Page 3: Descriptive information of previous VR experience as well as frequency of usage.
- Page 4: Subjective opinions and attitudes regarding VR.
- Page 5: Beliefs about the future of VR in education3.
- Send a draft to three social scientists and experts in technology that are external to the research team. The task of this committee is to review the experimental design, including ethical aspects and study design according to scientific guidelines. Also, they must validate the tool, considering aspects such as item comprehension (both questions and possible answers) in relation to the research goals.
- Design a definitive version of the questionnaire (see Supplementary File 2), considering the suggestions made by the group of experts, so it can be submitted to a scientific and ethical committee along with a research report of the project.
NOTE: We obtained a positive evaluation both in the scientific and ethical areas of the Nebrija University committee (see the positive evaluation of the Nebrija University committee provided as Supplementary File 3). Also, there was a follow-up of the entire research process conducted by the same committee.
2. Adapting the questionnaire to the online specification of a secure server
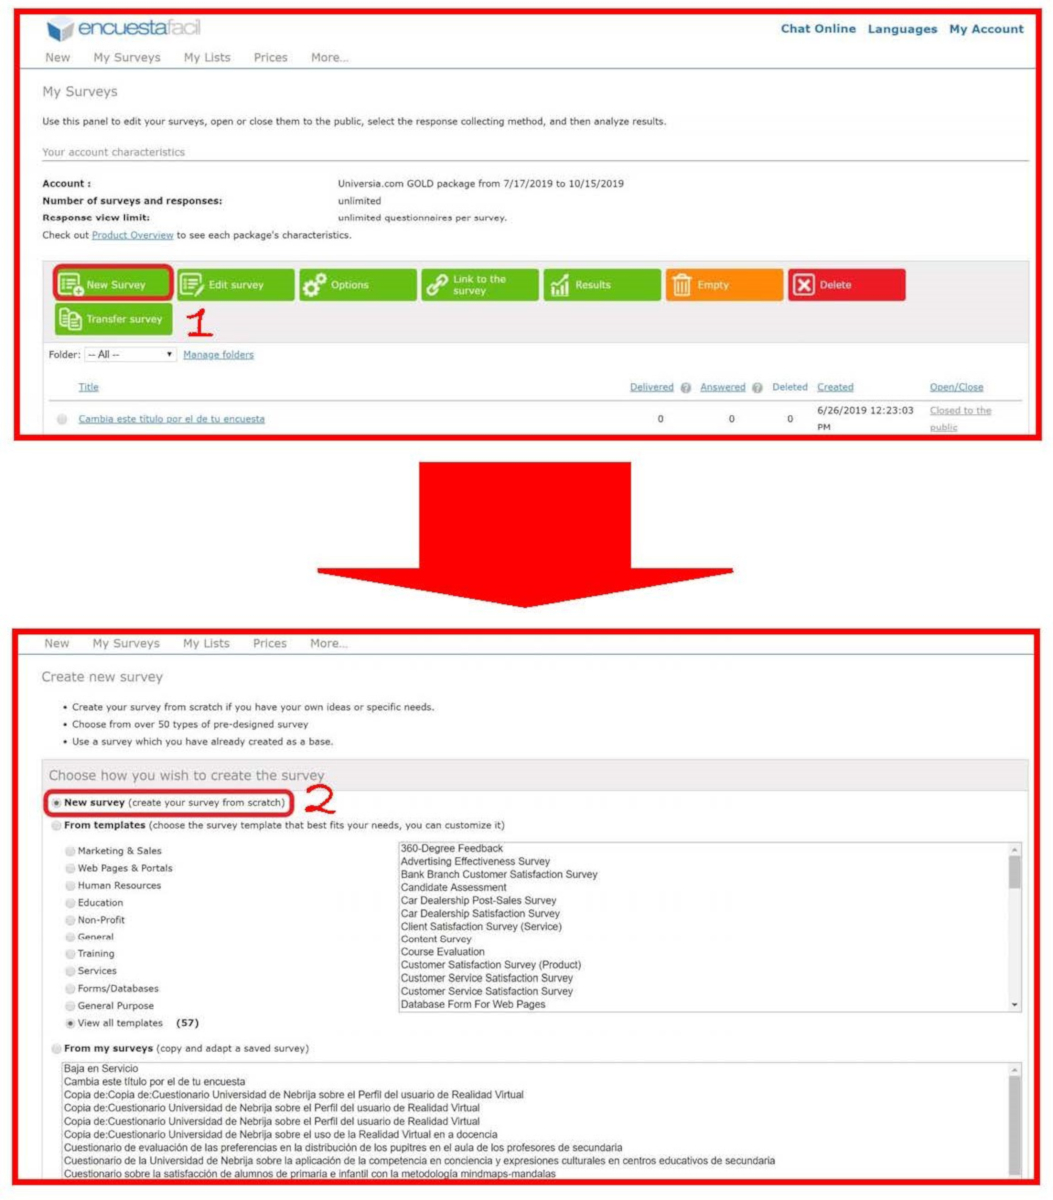
- Go to the main page of the software as a service (SaaS) with a private server (see Table of Materials) as a registered user of the platform (a registration process that must be done previously by adding personal data) and select Create your survey from scratch (see Figure 1).

Figure 1: How to create the questionnaire from scratch. (1) Click on New Survey icon; (2) Select Create Your Survey from Scratch. Please click here to view a larger version of this figure.
- Create several pages of the questionnaire with the questions as well as with possible answers through the SaaS with a private server.
NOTE: In this step it is important to follow the recommendations received during the validation process by the group of experts. Also, in the instructions to the participants explain the question posed correctly and the type of answer (e.g., open, closed, one- or multiple-choice, etc.) that must be filled out (see Figure 2).

Figure 2: How to design the questionnaire. (1) Edit the survey; (2) Add and configure pages and questions; (3–5) Develop pages, questions, and answers. Please click here to view a larger version of this figure.
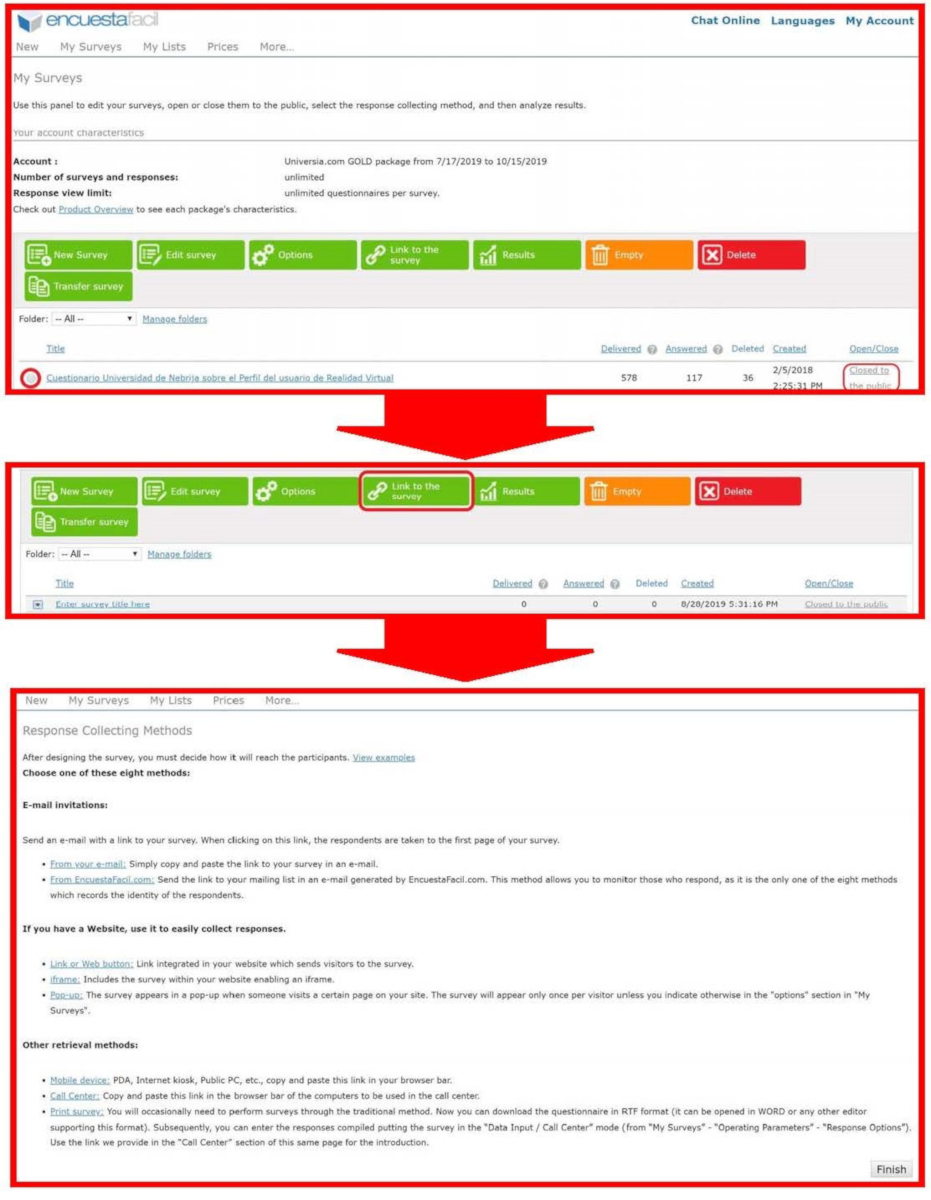
- Once the survey is created and saved (see the final questionnaire in Supplemental File 2), return to the main menu of the platform, select the questionnaire, and click on the icon Open | Close Public Survey to make it available to participants. After that, click on the icon Obtain a Link to the Survey, choosing one of several options by which participants will access the survey (e.g., a link embedded in an email or in a website, an iframe in a website, a pop up in a website, a link to computers of a call center, see Figure 3).
NOTE: The criterion to develop the final tool were that (1) the questionnaire had to be completed with any electronic device with Internet access (e.g., tablets, personal computers, smartphones); (2) participants had to fill out the questionnaire just one time (to this end, the chosen system must be able to keep the information of users who have already participated by identifying the IP of the device that was used to access and complete the survey); (3) the selected system had to guarantee the anonymity of the participants at all times, allowing the data to be stored on a secure private server.

Figure 3: How to obtain a link to the survey. (1) Open the survey; (2) Click on Obtain a Link to the Survey icon; (3) Select the chosen method. Please click here to view a larger version of this figure.
3. Sampling method
- Go to the internet portal as a registered user (registration that must be done before completing all the personal data) and create a thread in the VR forum to detail the study (see Table of Materials). Post a hyperlink to the survey hosted in the online private server (see Figure 4).

Figure 4: How to launch a thread in the VR forum. (1) Click on the Sistemas VR icon; (2) Click on NUEVO HILO icon; (3,4) Write a post with the questionnaire link included. Please click here to view a larger version of this figure.
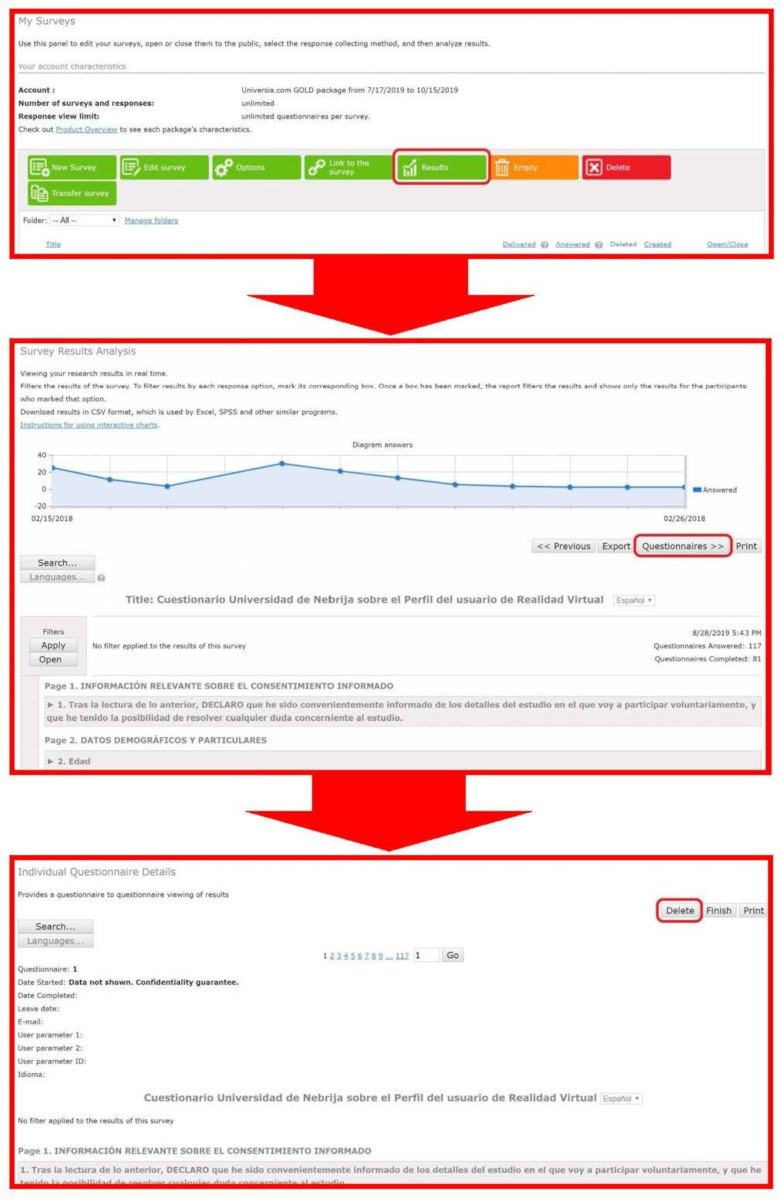
- Go to the main page of the SaaS as a registered user of the platform, select the questionnaire created, and click on Results. On the pop-up menu, click on the icon Questionnaire to access the filled-out questionnaires directly. Eliminate all the incomplete or erroneous questionnaires through the SaaS (see Figure 5).

Figure 5: How to eliminate all the incomplete or erroneous questionnaires. (1) Click on Results icon; (2) click on Export icon; (3) Eliminate all the incomplete or erroneous questionnaires. Please click here to view a larger version of this figure.
- Once the questionnaires reach the minimum number of participants (>100) after excluding incomplete questionnaires, go to the main page of the SaaS as a registered user of the platform, select the questionnaire, and click on the icon Open/Close Public Survey to finish the survey, so no one else can participate again (see step 1 in Figure 3 again).
NOTE: The participants of this study were 117 VR users (21 females and 96 males) who owned a VR HMD (any available in Spain). Note that the final sample of 117 participants resulted from a screening and filtering of 578 questionnaires, of which we excluded many undelivered cases, as well as 36 questionnaires that were incomplete, without applying any other filter to the data. As for the mean age of the participants, μ = 36.91 years old with a standard deviation of σX = 6.39 (μ = 36.19 and σX = 7.50 for females, and μ = 37.07 and σX = 6.15 for males).
4. Statistical analyses
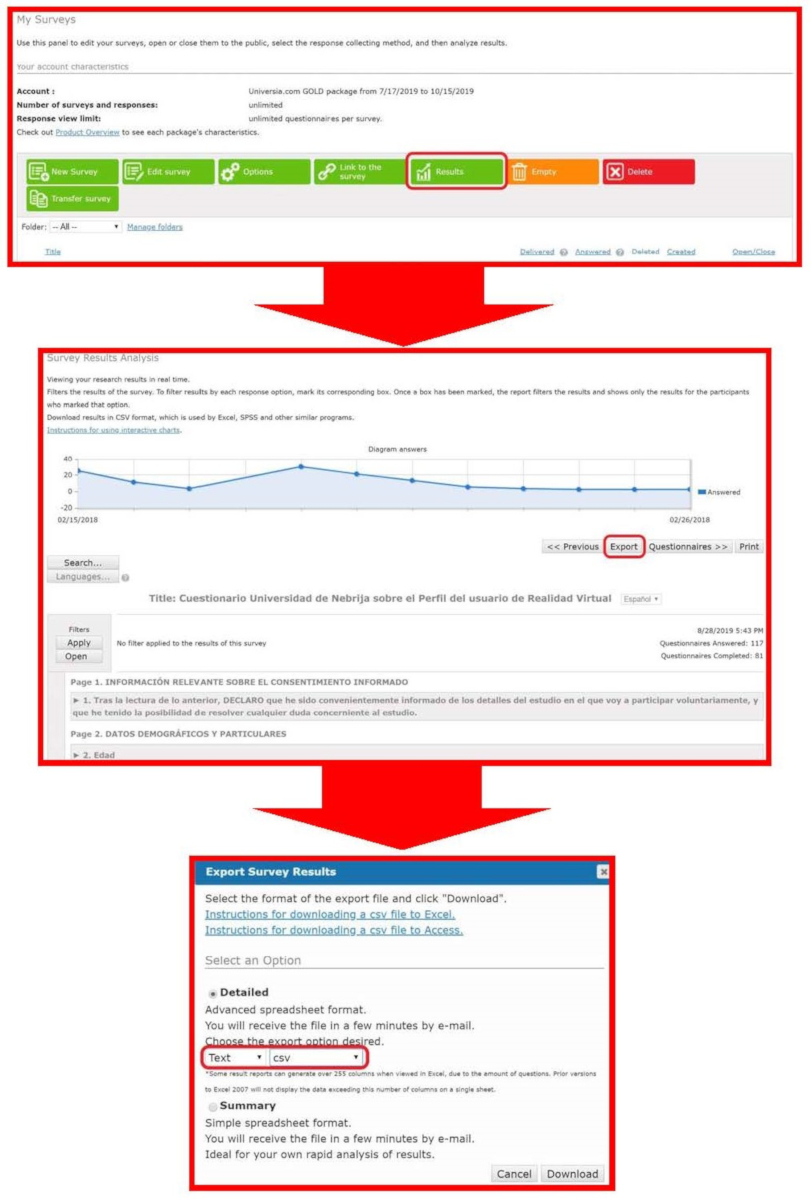
- Go to the main page of the SaaS as a registered user of the platform, select the survey created and click on the icon Results. On the pop-up menu, click on Export and select the pop-up options of the report detailed (advanced spreadsheet format), in Text and with .csv extension (see Figure 6). Once the questionnaires are completed by the participants, export them to an email account in .csv format, so these can be kept in a safe, private, and protected place.

Figure 6: How to export data to use in the statistical software package. (1) Click on Results icon; (2) Click on Questionnaires icon; (3) Select Text and csv in the Detailed option. Please click here to view a larger version of this figure.
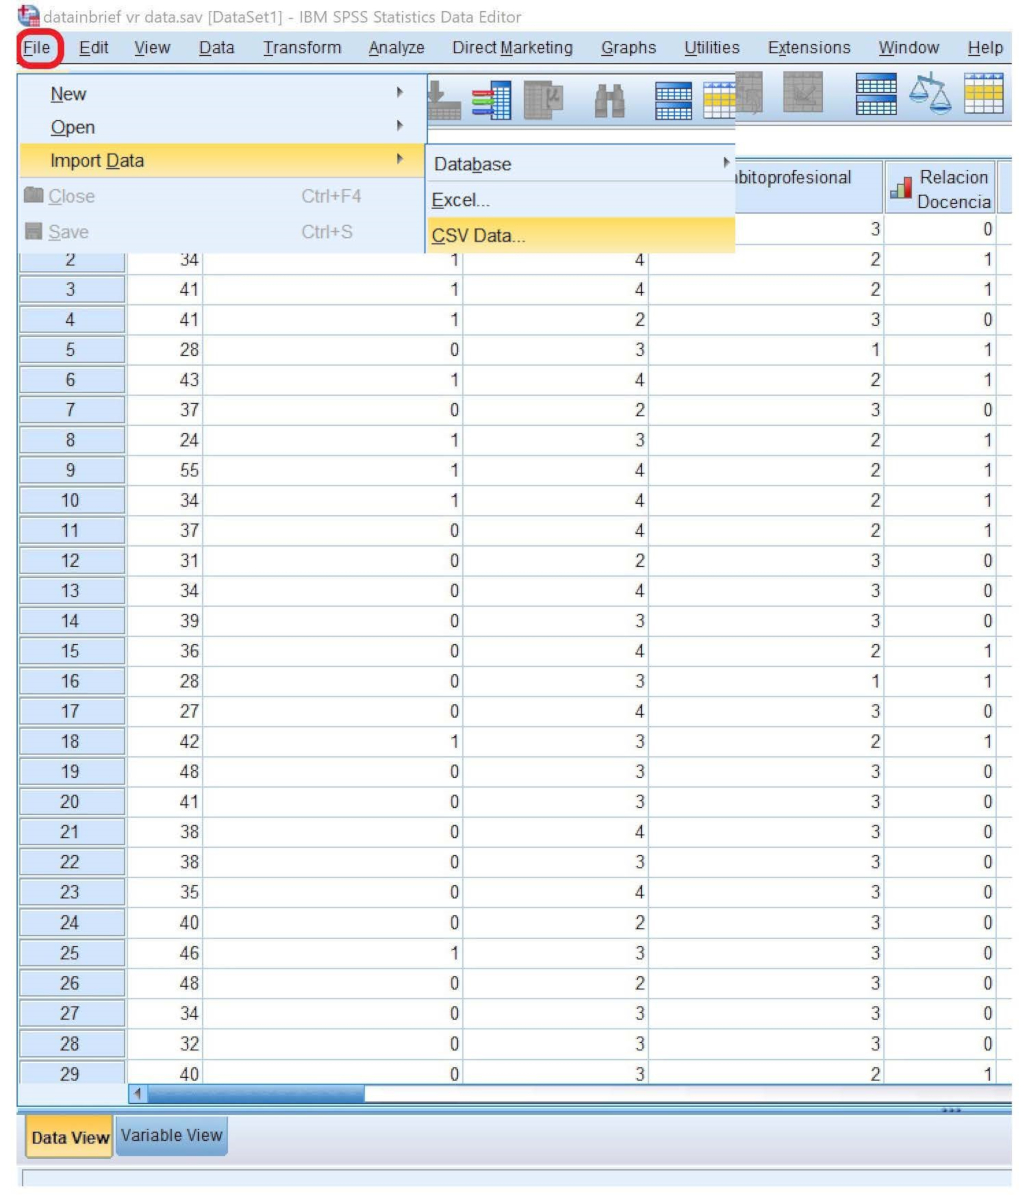
- Open the statistical software (see Table of Materials) and select File Menu | Import Data | CSV Data. Select the.csv file previously saved. This process allows transformation of the anonymous data into the analysis format required by the statistical software package (see Figure 7).

Figure 7: How to import data in the statistical software package. Select File Menu | Import Data | CSV Data. Please click here to view a larger version of this figure.
- Select the variables to analyze statistically ("Gender", "Age", "Educational Qualification", "Current Direct Relationship with Formal Education", "Previous Experiences with Sophisticated VR HMD", "Level of the Private VR HMD", "Number of Years Using VR", "Usage Frequency", "VR Usage for Educational Purposes", "Interest in VR for Educational Purposes", "Optimism Regarding the Future Pedagogical Possibilities of Virtual Reality" and "Optimism Regarding the Future Pedagogical Possibilities of Virtual Reality") and delete the rest of the information imported by the .sav file generated by the statistical software package.
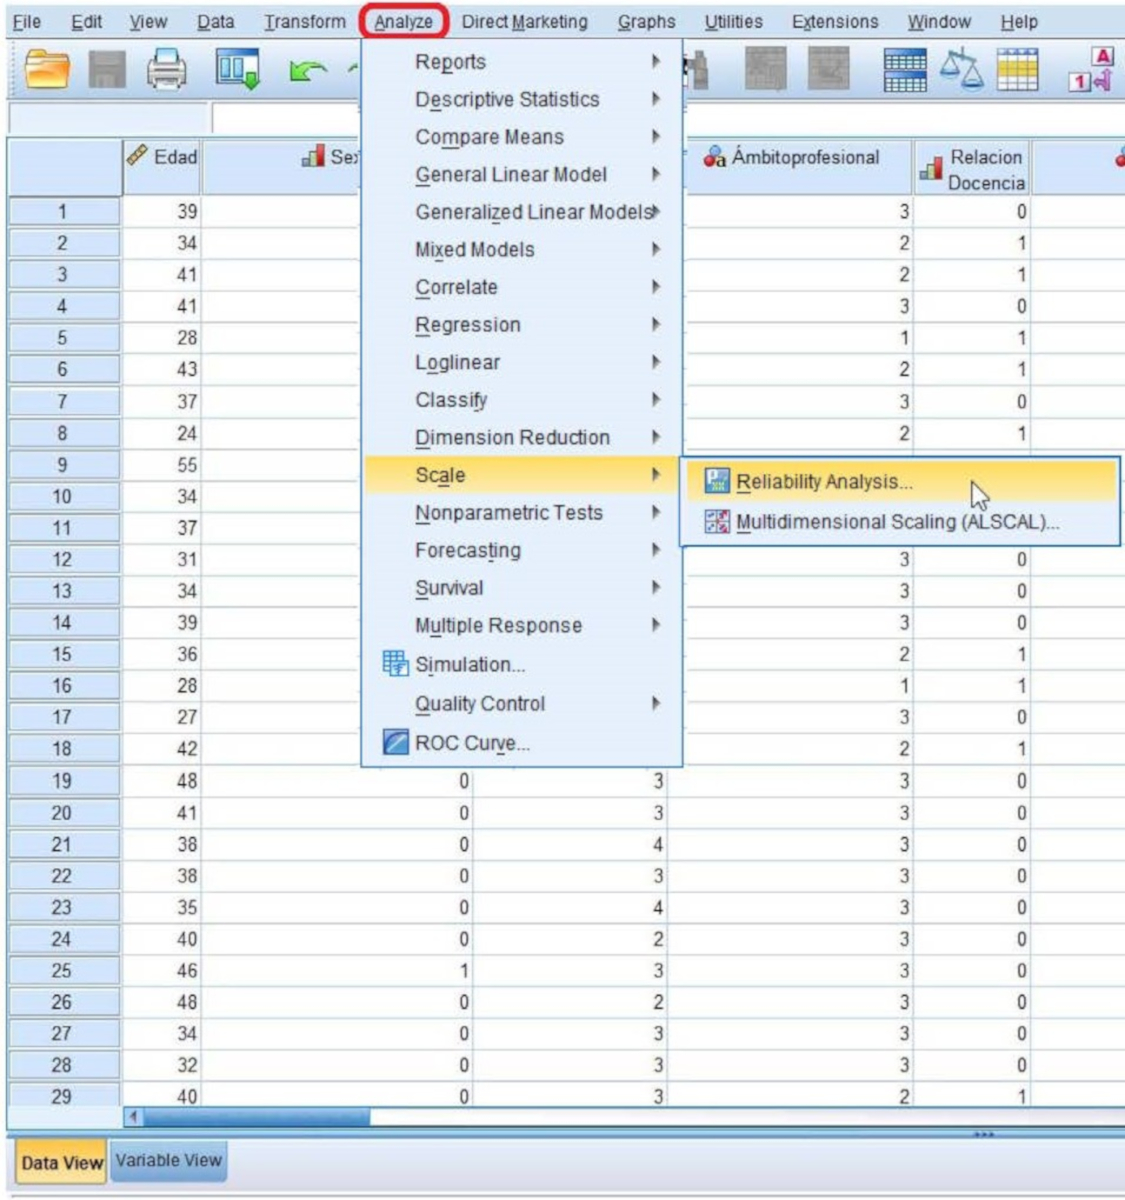
- Assess the internal consistency of the questionnaire with the Alpha's Cronbach with the statistical software package. To this end, select the Analyze Menu | Scale | Reliability Analysis, and transfer all the variables to the Reliability Analysis dialogue box. Finally, click on the OK icon to generate the desired output (see Figure 8).
NOTE: The questionnaire had a high reliability and internal consistency, measured through the Alpha's Cronbach (α = 0.826).

Figure 8: How to assess the internal consistency of the questionnaire. Select Analyze Menu | Scale | Reliability Analysis. Please click here to view a larger version of this figure.
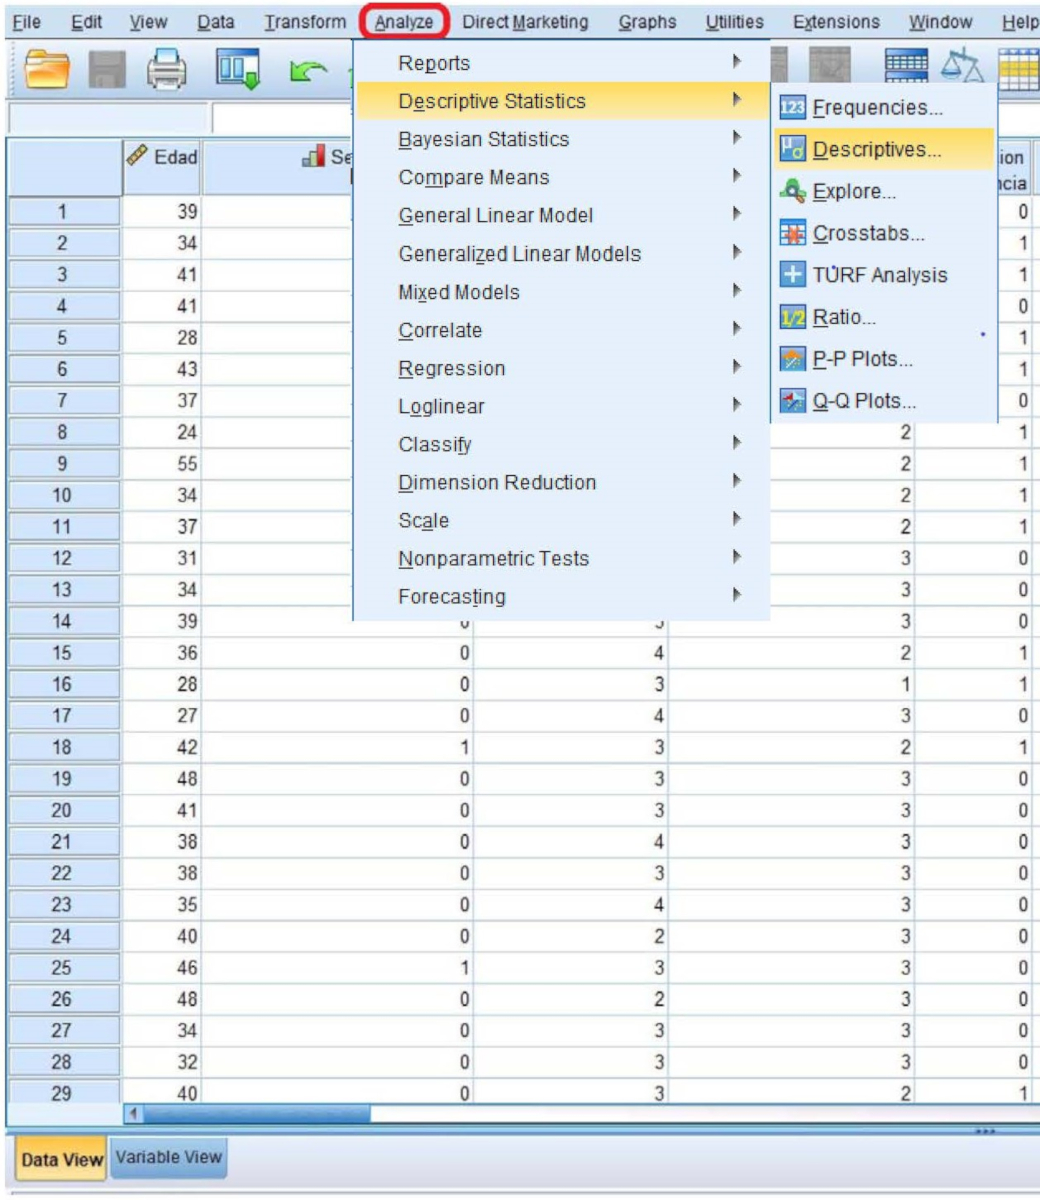
- Carry out the descriptive analysis with the statistical software package. Explore descriptive statistics such as the arithmetic mean and the standard deviation for the quantitative variable "Age". Study frequency distribution in the rest of the variables. To carry this analysis out, select Analyze Menu | Descriptive Statistics | Frequencies and, after the output, Analyze | Descriptive Statistics | Descriptive (see Figure 9).

Figure 9: How to carry out the descriptive analysis of the data. Select Analyze Menu | Descriptive Statistics | Frequencies and, after the output, Analyze | Descriptive Statistics | Descriptive. Please click here to view a larger version of this figure.
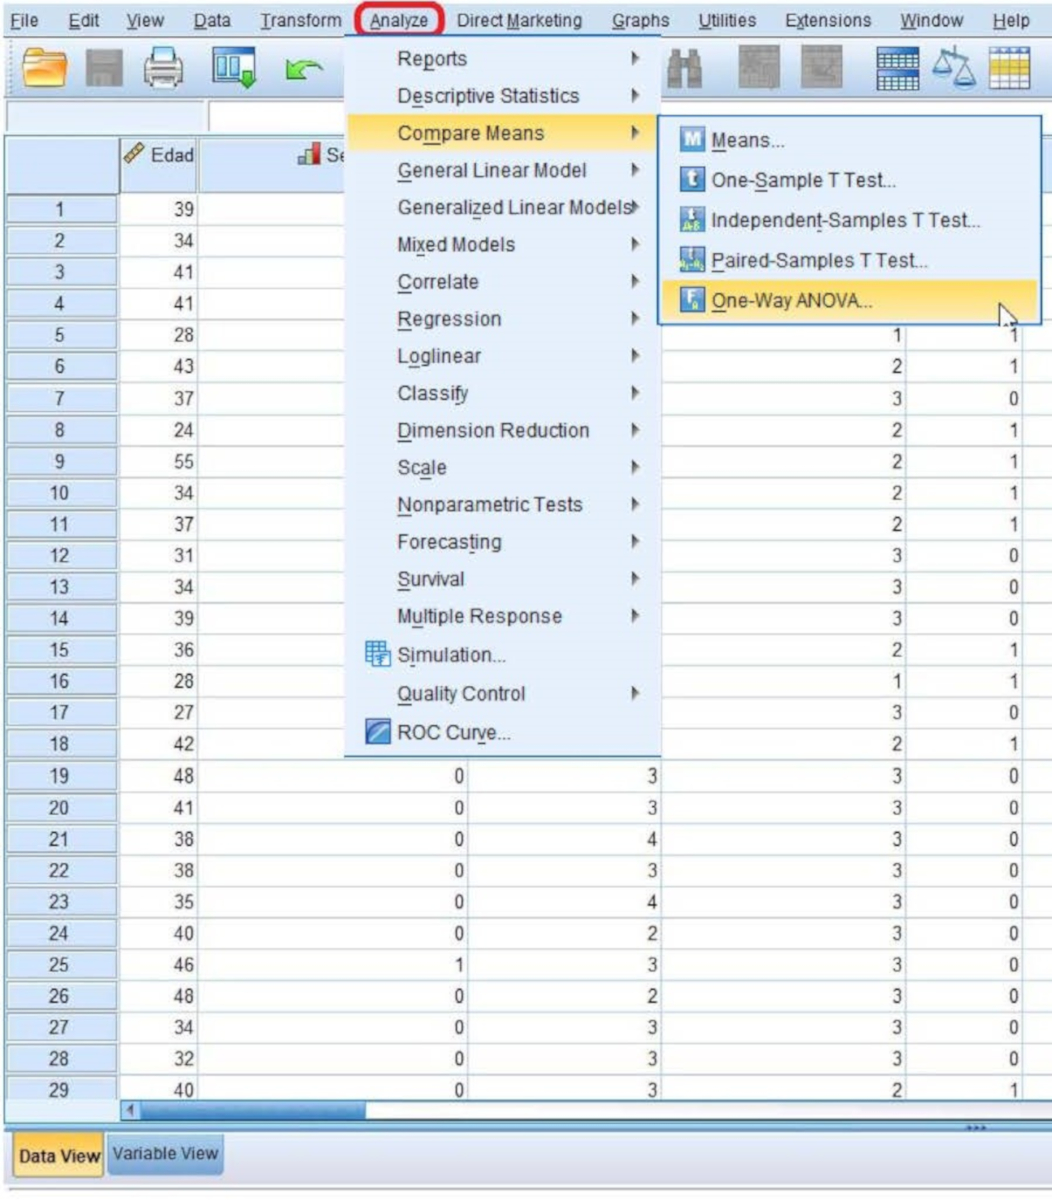
- Conduct One-Way ANOVA analysis with the statistical software package. To this end, select Analyze Menu | Compare Means | One-Way ANOVA, and in the One-Way ANOVA dialogue box put "Age" as the factor and the rest of the variables as dependent variables (see Figure 10).
NOTE: This process should be done for each of the nominal ("Gender", "Current Direct Relationship with Formal Education", "Previous Experiences with Sophisticated VR HMD", "VR Usage for Educational Purposes", "Interest in VR for Educational Purposes", "Optimism Regarding the Future Pedagogical Possibilities of Virtual Reality", and "Optimism Regarding the Future Pedagogical Possibilities of Virtual Reality") and ordinal variables ("Educational Qualification", "Level of the Private VR HMD", "Number of Years Using VR", and "Usage Frequency"). The output shows the statistical significance of "Age" as a discrete quantitative variable by comparing means with the Snedecor's F distribution (non-considering equality of variances).

Figure 10: How to conduct One-Way ANOVA analysis. Select Analyze Menu | Compare Means | One-Way ANOVA. Please click here to view a larger version of this figure.
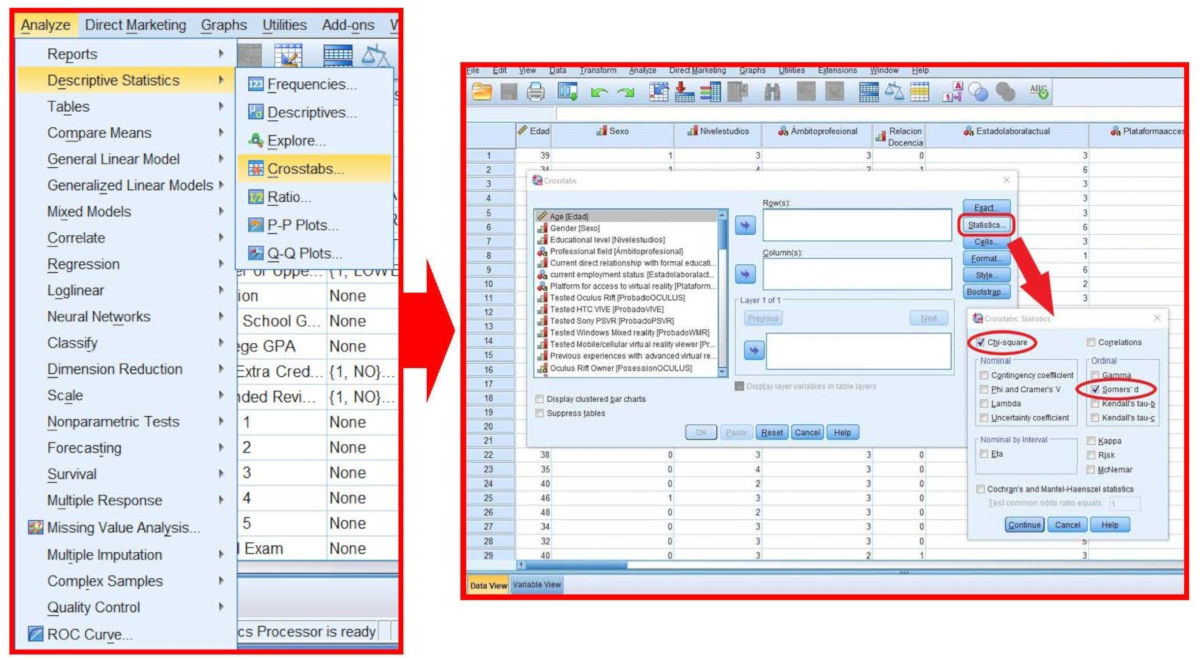
- Conduct the Chi-squared test on contingency tables to test whether or not there is a relationship between the variables, and Somers' d to reflect the strength and direction of the associations. To this end, go to Analyze menu | Descriptive Statistics | Crosstabs and, in the Crosstabs dialogue box, click on Statistics and select options Chi-squared and Somers' d and click on Continue (see Figure 11).
- In the Crosstabs dialogue box, transfer one of the nominal or ordinal variables as rows and the rest as columns. This process must be repeated for each of the variables in the rows, eliminating the ones already analyzed, to obtain all the correlations between them.

Figure 11: How to conduct Chi-squared and Somers d test. (1) Select Analyze Menu | Descriptive Statistics | Crosstabs; (2) Select Chi-squared and Somers' d options. Please click here to view a larger version of this figure.
Results
Table 1 presents the frequency distribution of the categorical variables (nominal, dichotomous, and ordinal variables) along with the mean and standard deviation of the interval scale variable "Age".
...| CATEGORICAL VARIABLES | |||
| Gender | Levels | Frequency | Percentage |
Discussion
This study explores the profile of Spanish early adopters of VR, assessing their interest in the use of VR as a learning tool. Therefore, along with other studies, it offers a fresh perspective on the real possibilities of VR and its applications to the classroom9.
The users of VR devices live literally everywhere, so there is not a physical place to identify and locate them. For this reason, the only possible way to find them is through VR forums and websites that VR u...
Disclosures
The authors have nothing to disclose.
Acknowledgements
The authors are very thankful to the managing team of Elotrolado.net, because without their help this study would have been impossible to conduct. We are also grateful to Encuestafacil.com, which offered us their services free of charge so that we could create the questionnaire and use their servers to gather the data. Finally, we appreciate the feedback and support received from the Scientific and Ethical Committee of the Nebrija University and from Alfonso X el Sabio University.
Materials
| Name | Company | Catalog Number | Comments |
| Encuestafacil.com Saas (Software as a Service) | Encuestafacil.com | 2019 | Software as a Service in the Encuestafacil.com private data server |
| Statistical Package for the Social Sciences (SPSS) | IBM | 24 | Software package used in statistical analysis of data |
| VR Forum in Elotrolado.net online portal | New EOL, S.L. | 2019 | The elotrolado.net is a Spanish website for communication and information technologies, digital leisure and video games, with more than 460,000 users and ten million of monthly visits. So far, it is the only Spanish website with a specific VR forum with more than 400 threads. Around 76,000 early VR adopters contribute with messages and posts talking about all HMD, and platforms on the market. |
References
- Norman, K. L. . Cyberpsychology: An introduction to human-computer interaction. , (2017).
- Cipresso, P., Giglioli, I. A. C., Raya, M. A., Riva, G. The past, present, and future of virtual and augmented reality research: a network and cluster analysis of the literature. Frontiers in Psychology. 9, (2018).
- Sánchez-Cabrero, R., et al. Demographic data, habits of use and personal impression of the first generation of users of virtual reality viewers in Spain. Data in Brief. 21, 2651-2657 (2018).
- Aznar-Díaz, I., Romero-Rodríguez, J. M., Rodríguez-García, A. M. La tecnología móvil de Realidad Virtual en educación: una revisión del estado de la literatura científica en España. EDMETIC, Revista de Educación Mediática y TIC. 7 (1), 256-274 (2018).
- Tecnología y Medicina, una fusión para mejorar la salud. El Mundo Available from: https://www.elmundo.es/promociones/native/2018/06/22 (2018)
- Kentnor, H. E. Distance education and the evolution of online learning in the United States. Curriculum and Teaching Dialogue. 17 (1), 21-34 (2015).
- Moreira, F., Pereira, C. S., Durão, N., Ferreira, M. J. A comparative study about mobile learning in Iberian Peninsula Universities: Are professors ready. Telematics and Informatics. 35 (4), 979-992 (2018).
- Sánchez-Cabrero, R., et al. Early virtual reality adopters in Spain: sociodemographic profile and interest in the use of virtual reality as a learning tool. Heliyon. 5 (3), 01338 (2019).
- Fernández-Robles, B. Factores que influyen en el uso y aceptación de objetos de aprendizaje de realidad aumentada en estudios universitarios de Educación Primaria. Edmetic, Revista de Educación Mediática y TIC. 6 (1), 203-219 (2017).
- Yildirim, G. The users' views on different types of instructional materials provided in virtual reality technologies. European Journal of Education Studies. 3 (11), 150-172 (2017).
- Rosedale, P. Virtual reality: The next disruptor: A new kind of worldwide communication. IEEE Consumer Electronics Magazine. 6 (1), 48-50 (2017).
- Sherman, W. R., Alan, B. C. . Understanding virtual reality: Interface, application, and design. , (2018).
- Traffic overview of Elotrolado.net. Similarweb Available from: https://www.similarweb.com/website/elotrolado.net (2019)
- Foro de Sistemas VR in Multiplataforma. Elotrolado.net Available from: https://www.elotrolado.net/foro_multiplataforma-sistemas-vr_224 (2018)
- Jager, J., Putnick, D. L., Bornstein, M. H. More than just convenient: The scientific merits of homogeneous convenience samples. Monographs of the Society for Research in Child Development. 82 (2), 13-30 (2017).
- WMA Declaration of Helsinki-Ethical principles for medical research involving human subjects. World Medical Association Available from: https://www.wma.net/policies-post/wma-declaration-of-helsinki-ethical-principles-for-medical-research-involving-human-subjects (2013)
- Statista. Unit shipments of virtual reality (VR) devices worldwide from 2017 to 2018 (in millions), by vendor. Technology & Telecommunications Consumer Electronics Global virtual reality device shipments by vendor 2017-2018 Available from: https://www.statista.com/statistics/671403/global-virtual-device-shipments-by-vendor/ (2019)
- Newzoo's 2017 Report: Insights into the $108.9 Billion Global Games Market. Newzoo Available from: https://newzoo.com/insights/articles/newzoo-2017-report-insights-into-the-108-9-billion-global-games-market/ (2019)
- AR & VR Headsets Market Share. IDC Corporate USA Available from: https://www.idc.com/promo/arvr (2019)
- Educational experiences/apps for the Oculus Rift. Unimersiv Available from: https://unimersiv.com/reviews/oculus-rift (2019)
Reprints and Permissions
Request permission to reuse the text or figures of this JoVE article
Request PermissionThis article has been published
Video Coming Soon
Copyright © 2025 MyJoVE Corporation. All rights reserved