
A subscription to JoVE is required to view this content. Sign in or start your free trial.
Method Article
Terahertz Imaging and Characterization Protocol for Freshly Excised Breast Cancer Tumors
In This Article
Summary
Freshly excised human breast cancer tumors are characterized with terahertz spectroscopy and imaging following fresh tissue handling protocols. Tissue positioning is taken into consideration to enable effective characterization while providing analysis in a timely manner for future intraoperative applications.
Abstract
This manuscript presents a protocol to handle, characterize, and image freshly excised human breast tumors using pulsed terahertz imaging and spectroscopy techniques. The protocol involves terahertz transmission mode at normal incidence and terahertz reflection mode at an oblique angle of 30°. The collected experimental data represent time domain pulses of the electric field. The terahertz electric field signal transmitted through a fixed point on the excised tissue is processed, through an analytical model, to extract the refractive index and absorption coefficient of the tissue. Utilizing a stepper motor scanner, the terahertz emitted pulse is reflected from each pixel on the tumor providing a planar image of different tissue regions. The image can be presented in time or frequency domain. Furthermore, the extracted data of the refractive index and absorption coefficient at each pixel are utilized to provide a tomographic terahertz image of the tumor. The protocol demonstrates clear differentiation between cancerous and healthy tissues. On the other hand, not adhering to the protocol can result in noisy or inaccurate images due to the presence of air bubbles and fluid remains on the tumor surface. The protocol provides a method for surgical margins assessment of breast tumors.
Introduction
Terahertz (THz) imaging and spectroscopy has been a rapidly growing area of research in the past decade. The continued development of more efficient and consistent THz emitters in the range of 0.1–4 THz has made their applications grow significantly1. One area where THz has shown promise and significant growth is the biomedical field2. THz radiation has been shown to be nonionizing and biologically safe at the power levels generally used to analyze fixed tissues3. As a result, THz imaging and spectroscopy has been used to classify and differentiate various tissue features such as water content to indicate burn damage and healing4, liver cirrhosis5, and cancer in excised tissues6,7. Cancer assessment in particular covers a broad range of potential clinical and surgical applications, and has been investigated for cancers of the brain8, liver9, ovaries10, gastrointestinal tract11, and breast7,12,13,14,15,16,17,18,19.
THz applications for breast cancer are primarily focused on supporting breast conserving surgery, or lumpectomy, via margin assessment. The objective of a lumpectomy is to remove the tumor and a small layer of surrounding healthy tissue, in contrast to full mastectomy, which removes the entire breast. The surgical margin of the excised tissue is then assessed via pathology once the sample has been fixed in formalin, sectioned, embedded in paraffin, and mounted in 4 µm–5 µm slices on microscope slides. This process can be time-consuming and requires a secondary surgical procedure at a later time if a positive margin is observed20. Current guidelines by the American Society of Radiation Oncology define this positive margin as having cancer cells contacting the surface-level margin ink21. THz imaging for high-absorption hydrated tissue is primarily limited to surface imaging with some varying penetration based on tissue type, which is sufficient for meeting the surgical needs of rapid margin assessment. A quick analysis of margin conditions during the surgical setting would greatly decrease surgical costs and follow-up procedure rate. To date, THz has proven effective in differentiating between cancer and healthy tissue in formalin-fixed, paraffin-embedded (FFPE) tissues, but additional investigation is needed to provide reliable detection of cancer in freshly excised tissues7.
This protocol details the steps for performing THz imaging and spectroscopy on freshly excised human tissue samples obtained from a biobank. THz applications built on freshly excised human breast cancer tissues have seldom been used in published research7,18,22,23, especially by research groups not integrated with a hospital. The use of freshly excised tissues is likewise rare for other cancer applications, with most non-breast human cancer examples being reported for colonic cancer24,25. One reason for this is that FFPE tissue blocks are far easier to access and handle than freshly excised tissue unless the THz system being used for the study is part of the surgical workflow. Similarly, most commercial laboratory THz systems are not prepared to handle fresh tissue, and those that do are still in the stages of using cell line growth or have only started to look at excised tissue from animal models. To apply THz to an intraoperative setting requires that imaging and characterization steps be developed for fresh tissue in advance so that the analysis does not interfere with the ability to perform standard pathology. For applications that are not inherently meant to be intraoperative, the characterization of fresh tissue is still a challenging step that must be addressed to work towards in vivo applications and differentiation.
The objective of this work is to provide a guideline for THz application for freshly excised tissue using a commercial THz system. The protocol was developed on a THz imaging and spectroscopy system26 for murine breast cancer tumors13,17,19 and was extended to human surgical tissue obtained from biobanks7,18. While the protocol was generated for breast cancer, the same concepts can be applied to similar THz imaging systems and other types of solid-tumor cancers that are treated with surgery where success depends on margin assessment27. Due to a fairly small amount of published THz results on freshly excised tissues, this is the first work to the authors’ knowledge to focus on the protocol of fresh tissue handling for THz imaging and characterization.
Protocol
This protocol follows all the requirements set by the Environmental Health and Safety department at the University of Arkansas.
1. Set Up the Tissue Handling Area
- Take a stainless-steel metal tray and cover it with the biohazard bag as shown in Figure 1. Any handling of the biological tissues will be performed within the tray area (i.e., the tissue handling area).
- Prepare laboratory tweezers, tissue wipes, paper towels, filter paper pack, tissue dye bottles, bleach bottle, and ethanol bottle around the tray for easy access when required. Keep any used tissues, wipes, and gloves on the biohazard material surface to dispose of at the end of the protocol.
- Fill a 50 mL centrifuge tube with up to 45 mL of 10% neutral buffered formalin and place it in the centrifuge storage tray near the tissue handling tray.

Figure 1: Setup of tissue handling area. Please click here to view a larger version of this figure.
2. Handling Fresh Breast Cancer Tumor for THz Transmission Spectroscopy
CAUTION: Before handling any live tissues, put on nitrile hand gloves, eye protection goggles, a face mask, and a lab coat. Always use laboratory tweezers to handle tissues and avoid touching them directly with the hands. All work with fresh tissue outside of a sealed container or the scanning stage should be conducted at the tissue handling area established in step 1.1.
NOTE: All tissues handled in this work were shipped in Dulbecco's Modified Eagle's medium (DMEM) and antibiotic solution from the biobank.
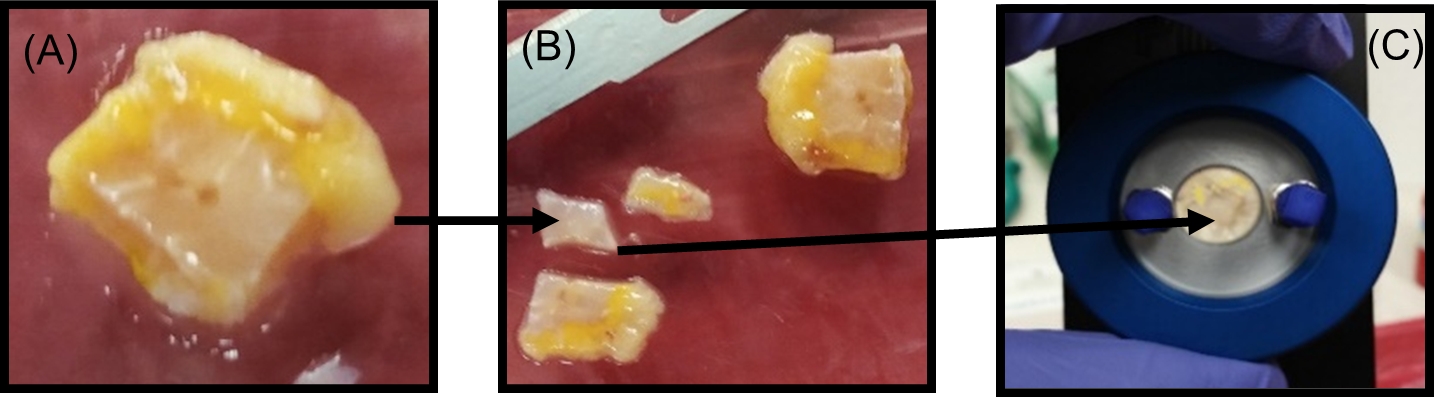
- Remove the bulk tumor from the DMEM solution and place it in a Petri dish on the tissue handling area (see Figure 2A).
- From gross inspection, identify distinct tumor regions from which to slice small pieces for transmission characterization. Cut a 0.5 mm thick segment of tumor from the identified points using a stainless steel low profile blade, as shown in Figure 2B. Place this sliced section between two quartz windows with a spacer of 0.1 mm thickness in a liquid sample holder, as shown in Figure 2C.

Figure 2: Tumor sectioning for the THz transmission spectroscopy measurements. (A) Photograph of the bulk tumor. (B) Photograph of the small sections (0.5 mm) of the tumor cut from the bulk tumor. (C) The sliced tumor section placed in the liquid sample holder between the two quartz windows with a 0.1 mm polytetrafluoroethylene spacer for spectroscopy measurement. Figure republished from T. Bowman et al.18 with permission from SPIE. Please click here to view a larger version of this figure.
3. THz Transmission Spectroscopy Measurements
- Set the transmission spectroscopy module inside the THz core chamber by aligning the module handles over the mounting posts in the core system and sliding the stage down into the system. Tighten the two mounting screws in the upper right and lower left corners of the module as shown in Figure 3A.
- Purge the system with dry nitrogen gas at 5 L/min (LPM) during the entire spectroscopy procedure to remove water vapor from the sample space.
- Open the THz transmission spectroscopy measurement software from the desktop connected to the THz system. It will open up the main window.
- Click on the Scan tab on the top of the window. A Spectra Scan Setup window will appear. From the drop-down menu of the Measurement Mode tab on the top right of the window, select Transmission to set up transmission spectroscopy. If the peak is not automatically visible, check the Enable option under the Manual Peak Search tab and manually step the optical delay to bring the peak into view.
- After 30 min of purging, record an air reference signal by following the steps below.
- Under the Scan Settings tab in the spectra scan setup window, input an appropriate Name for the reference file, set Num Scans to 1,800, and set the Start Delay (s) to 0. Leave the other settings as their default values.
- Click on Measure Reference in the scan setup window to take the air reference measurement. Then click on Measure Sample to measure the transmission signal through air as a sample average of 1,800 signals over ~1 min.

Figure 3: THz transmission spectroscopy module setup. (A) THz core chamber with the transmission module mounted on it. (B) A photograph of the liquid sample holder. (C) The sample holder placed inside the core chamber for the measurements. Please click here to view a larger version of this figure.
- Measure the two quartz windows in the liquid sample holder as shown in Figure 3B.
- Place the two quartz windows in the liquid sample holder without a spacer in between.
- Open the THz core chamber. Mount the liquid sample holder on the transmission spectroscopy module, as shown in Figure 3C. Close the chamber.
- Click on the Scan tab on the main window. Repeat steps 3.5.1–3.5.2 for the quartz sample, but update Start Delay (s) to 900. This allows time to purge any water vapor before measurement.
- If the quartz is desired as a reference for additional samples, click on the Clear Reference tab under the Scan Settings. This clears the air reference. Then click on the Measure Reference tab to record the quartz measurements as a new reference.
- Place the sliced tumor section between the two quartz windows inside the liquid sample holder and position the holder inside the chamber for a single point transmission measurement of the tissue. To record the measurement, repeat step 3.6.3.
- Take the liquid sample holder out of the chamber when the measurements are completed and bring it to the area designated for tissue handling. Disassemble the liquid sample holder, wipe the tumor section from the quartz windows with the tissue wipes, and place the used tissue wipes in the same tray to dispose in the biohazard bag along with the other biohazard waste.
- Repeat steps 2.2, 3.7, and 3.8 as necessary to characterize additional tumor slices. When the measurements are completed, go to the main window and click on the File tab to save the measurement data. Close the software window.
4. Handling Fresh Breast Cancer Tumor for THz Reflection Mode Imaging
- Remove the fresh tumor sample from the DMEM and antibiotics solution and place it on a Petri dish. Using gross inspection, select a side of the tumor to be imaged that is sufficiently flat and has little blood and few blood vessels. Avoid imaging tissue with blood or blood vessels if possible.
- Place the tumor with the side to be imaged on grade 1 filter paper to dry the excess DMEM and clear the tissue of fluid or secretions from the tumor, as shown in Figure 4A. Reposition the tumor on the filter paper to a dry spot as the paper saturates. Dry the tumor for ~5 min.

Figure 4: Fresh tumor sample preparation for THz imaging. (A) Tumor placed on filter paper to dry. (B) Tumor placed on polystyrene plate over the imaging window with tissue wipe pads to absorb excess fluids. (C) Tumor viewed from below to track orientation and check for air bubbles. Please click here to view a larger version of this figure.
- Unmount the transmission spectroscopy module and set the reflection imaging module (RIM) mirror base on the THz core system as shown in Figure 5A. Upon setting the mirrors, mount the RIM scanning stage above the mirror base and screw it into the core system (see Figure 5B).
- Purge the system with dry nitrogen gas at 5 LPM for 30 min prior to the imaging procedure to remove water vapor from the sample compartment. After 30 min, reduce the amount of dry nitrogen gas to 3 LPM for the rest of time the system is in use.
- Place a polystyrene plate of thickness ~1.2 mm on the scanning window of diameter ~37 mm. Center the scanning window along with the polystyrene plate on the sample stage.

Figure 5: System setup for reflection imaging. (A) Reflection imaging module mirror base. (B) Scanning stage. Please click here to view a larger version of this figure.
NOTE: Other thicknesses and plate materials are suitable for step 4.5 but should have a uniform thickness and be of low enough absorption to not impede the THz signal.
- Open the THz reflection imaging measurement software from the desktop connected to the THz system. A window will pop up showing several dialog icons for specific functions and two subwindows for THz field plots, (arbitrary units a.u.) against the time and frequency, respectively.
- To set the parameters for the RIM set-up, click on the Image Parameter Dialog icon at the top of the window. An Image Acquisition Parameters window will pop up. Select RIM from the drop-down menu of the Template tab for reflection imaging set up. Hit OK and go back to the main window of the software.
- On the main window, click on the Fixed-point Scan icon. This will activate the THz antennas to start sending the incident THz signal and receiving the reflected THz signal from a single point on the polystyrene plate.
- Click on the Motor Stage Dialog icon on the top of the main window. The motor control window will open up. Adjust the optical delay axis by clicking on the forward/reverse direction arrows to center the reflected pulse from the polystyrene in the main window.
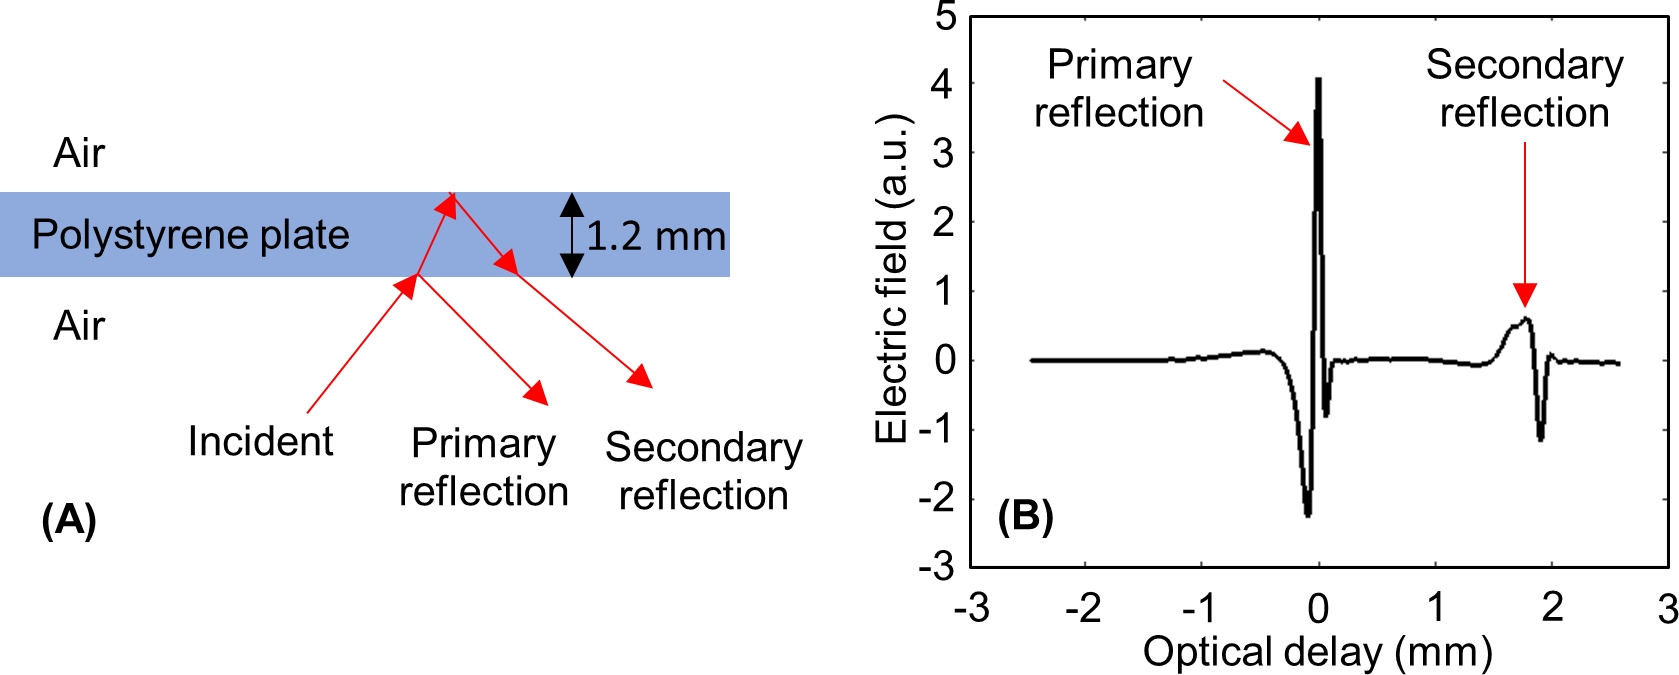
NOTE: After adjusting the optical delay axis, two pulses should appear on the window, as shown in Figure 6: one from the lower interface of the polystyrene plate (primary reflection), and one from the upper interface of the polystyrene plate (secondary reflection). - Window out the primary reflection from the polystyrene plate and keep the secondary reflection in the window, which will contribute to the reflections from the tissue during the imaging procedure. This is done in two steps.
- First, click on the DAQ Settings button at the top of the main window to open the DAQ settings dialog window. Change the optical delay value from 5 V (default) to 4 V.
- Second, adjust the scanning stage’s vertical position with the micrometer scale on the scanning stage until the minima of the secondary pulse is the strongest. Adjust the optical delay of the axis in the Motor Control Window to put the primary reflection outside of the range of the reflected signal being measured.
NOTE: For a 1.2 mm thick polystyrene plate, the primary reflection is windowed out when the secondary reflection minimum peak is approximately -0.3 mm on the optical delay axis of the time domain window.

Figure 6: THz reflections from the lower and upper interfaces of the polystyrene plate. (A) THz signal incident to and reflected from a 1.2 mm thick polystyrene plate. (B) Measured primary and secondary THz time domain signals from the polystyrene. Please click here to view a larger version of this figure.
- Level the sample stage and record the reference signal.
- Select two points on each axis (A-axis and B-axis) that denote locations on the polystyrene plate near the edge of the sample window. For example, for the A-axis ranging from -15 mm–15 mm, the two position points can be -10 mm and 10 mm; and for the B-axis ranging from -15 mm–15 mm, the two position points can be -10 mm and 10 mm.
- Click on the Motor Control Dialog button to open the motor control window. Reposition the motor control window and the main software window so that the time domain signal is visible while adjusting the motor positions. Set both the A-axis and B-axis to 0 mm.
- Level the A-axis using following steps. A -10 mm–10 mm range is used as an example.
- In the Motor Control Window, change the value of the A-axis from 0 to -10 and hit Enter. The stage moves to the -10 mm position on the A-axis and a shift in the signal position on the main window is observed.
- Use the adjustable micrometer scale on the scanning stage shown in Figure 5B to move the minimum peak of the signal back to the position set in step 4.10.2.
- Change the A-axis value to +10 and hit enter. The stage will now move from the -10 mm position to the +10 mm position on the A-axis and a shift in the signal is observed again. Note the direction and the distance that the signal shifted from its previous position and change the A-axis value again to -10. The signal will go back to the position set in step 4.11.5.
- Rotate the leveling screw on the A-axis of the scanning stage, as shown in Figure 5B and shift the signal to double the distance in the same direction it moved from the original position. Use the micrometer on the scanning stage to shift the signal back to the original position (-0.3 mm for 1.2 mm of polystyrene).
- Repeat steps 4.11.6–4.11.7 until the signal at +10 and -10 are equal and the peak for both positions is focused at the original position (-0.3 mm on the optical axis).
- Once the leveling of the A-axis is achieved, change the A-axis value to 0 and repeat the same procedure for the B-axis. Start by changing the value of the B-axis on the motor control window from 0 to the most positive value (for example +10 mm). Also, while leveling, use the leveling screw on the B-axis of the scanning stage, which is shown in Figure 5B.
- Once both axes are leveled, return both the A-axis and the B-axis to 0 mm. Close the Motor Control Window and verify that the signal is in its original position in case it is shifted a little.
- Record this signal as the reference.
- Go to the set DAQ Properties window. Change the averaging value to 5 and keep all other parameters as default.
- Click on New Reference. The averaging counter in the top right of the window will count from 0–20. Once the counter reaches 20, change the averaging value to 1 and click OK. The reflected signal from the polystyrene will be saved as the reference for any scans taken later.
NOTE: If only the THz imaging procedure has to be performed, then it is best to perform steps 4.3–4.14 before taking the tumor tissue out of the DMEM solution.
- Mount the tumor on the polystyrene plate covering the scanning stage window.
- Remove the imaging window from the scanning stage and bring it to the tissue handling area. Place the tumor on a polystyrene plate, as shown in Figure 4B.
- Ensure that there are no significant air bubbles between the plate and the tumor. If air bubbles are observed, press the tumor with tweezers or lift the tumor and gently roll it onto the polystyrene until the air gaps are minimized.
- Place absorptive spacers at regular intervals around the test sample as shown in Figure 4B. Place another polystyrene plate above the tumor and press gently in order to make the tumor surface as flat as possible. Tape down this polystyrene-tumor-polystyrene arrangement on the sample window.
- Flip the sample window as shown in Figure 4C, and take photos of the tumor to keep a record of its orientation. Return the sample window with the tumor to the scanning stage.
- Click on the Image Parameter Dialog button to open the Image Acquisition Parameters window. Set the values of Axis1min, Axis1max, Axis2min, and Axis2max to fully enclose the position of the tumor in the imaging window
NOTE: By default, Axis1 is the A-axis and Axis2 is the B-axis. - Set Axis1step and Axis2step to 0.2 mm for the imaging scan.
NOTE: Setting the Axis1step and Axis2step will set the stepper motors' step size to 200 µm increments during the scanning process. The total scan time can be estimated in the Image Acquisition Parameters window. - Click on the Measure tab on the main window and select the Flyback 2D Scan option. In the window that pops up, indicate the directory and file name under which to save the scan data.
5. Postprocessing the Fresh Tissue in Preparation for Histopathology Procedure
- Upon completion of the scanning process, remove the sample window, polystyrene plates, and sample from the core THz system and move them to the area designated for hazardous waste. Remove the tumor from the polystyrene plate and place it on a flat piece of cardboard of a size comparable to that of the tumor. Make sure the orientation of the tumor is the same as it was on the polystyrene, with the imaging face touching the cardboard.
- Dip a cotton swab in red tissue dye and stain the left side of the tumor down to where the edge of the tumor contacts the cardboard. Similarly, stain the right side of the tumor with blue tissue dye. Stain the exposed surface of the tumor with a line of yellow tissue dye connecting the red stain to the blue stain to denote the back of the sample, as shown in Figure 7A.
NOTE: To prevent the ink from staining the formalin solution, apply only a thin layer to the tissue. This can be accomplished by dabbing the cotton swab on a different surface before staining the tissue or using a clean cotton swab to wipe off any excess dye. Avoid letting the dye contact the skin or clothing. This tumor-staining process is conducted as a reference to provide information about the tumor’s imaging side and its orientation to the pathologist.

Figure 7: Post processing on the tumor after THz imaging. (A) Tumor placed face down on cardboard holder and dyed with tissue marking dye. (B) Filter paper placed over tumor and taped to maintain contact. (C) Stained tumor fixed on the cardboard immersed in 10% neutral buffered formalin solution and sealed with parafilm. Please click here to view a larger version of this figure.
- Let the ink dry for around 3–4 min. Cut a piece of filter paper with the same approximate dimensions as the cardboard. Place it on the tumor and wrap a piece of tape completely around the filter paper and cardboard as shown in Figure 7B. The tape and filter paper should secure the tumor against the cardboard without applying any significant pressure.
- Immerse the stained tissue affixed to the cardboard in 10% neutral buffered formalin solution and seal the centrifuge tube using a paraffin film, as shown in Figure 7C. Designate the sample number, date, tissue type, and tumor number for the sample on the tube label. Send the tumor to the pathologist for further histopathology processing.
6. Hazardous Waste Disposal
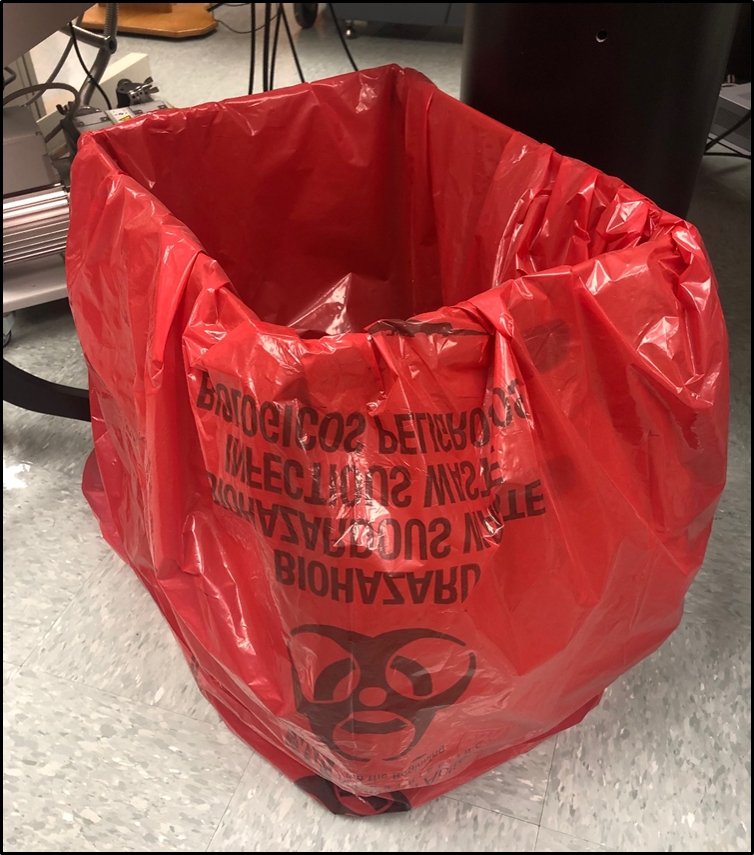
- Collect all the waste from the tissue handling tray along with the biohazard bag used to cover the tray and put it in a new biohazard bag, as shown in Figure 8. Bring the bag to the designated biohazardous waste area in the building and set an appointment with the Environmental Health and Safety (EH&S) department for the waste pickup. Clean the tissue handling tray and the surrounding area on the table with 10% bleach solution and ethanol.

Figure 8: Photograph of the biohazardous waste bag. Please click here to view a larger version of this figure.
- Take the liquid sample holder with the spacers and quartz windows, sampling window on which tumor was mounted, polystyrene plates, and laboratory tweezers to the washing area. Rinse all materials with water and then 10% bleach solution, wiping with paper towels as necessary to remove tissue debris. Rinse again with water, scrub with alconox solution, and rinse thoroughly. For glass and plasticware, rinse in 70% isopropyl alcohol and set aside to dry.
NOTE: Once the tumor is in formalin and the sample space is clean, data processing can be handled at the same time as imaging or a later time.
7. Data Processing to Construct THz images
- Export the saved .tvl data files from the THz system. The raw data files obtained from the system are written in Python and are best read in Python before saving as MATLAB data files.
- To construct the THz image of the scanned fresh tissue, convert the raw time domain reflection imaging data into the frequency domain using Fourier transform on the third dimension of the raw data matrix (i.e., the time dimension). Also take the Fourier transform of the reference data.
NOTE: A typical frequency domain spectrum should provide data ranging from 0.1 THz–4 THz. - Normalize the sample data with the reference data and perform the power spectra based on the integration of the normalized data over the frequency range from f1 = 0.5 THz to f2 = 1.0 THz using the following equation19:

NOTE: Here Esample is the frequency domain reflection imaging data of the tissue sample and Ereference is the frequency domain of a single point reflection data of the reference signal. - Construct the two-dimensional image by plotting the calculated power spectra data at each point in the matrix defined by the A-axis and B-axis. This is known as the power spectra THz image.
NOTE: The method to obtain a tomographic THz image instead is detailed in steps 7.5–7.7. - For characterization, calculate the theoretical frequency-dependent reflection for a range of potential tissue properties using the following equation18:

NOTE: Here ρT,ij is the complex Fresnel reflection coefficient between region i and region j;dj is the thickness of region j; and θj is the angle of propagation in region j related to the angle of incidence by Snell’s Law. is the complex propagation coefficient in region j, where ω is the angular frequency, c is the speed of light in vacuum, nj is the real part of the refractive index, and αabs,j is the absorption coefficient18. Region 1 is air, Region 2 is the polystyrene plate, and Region 3 is the tissue.
 - Calculate the reflection in equation (2) for a range of user-defined refractive indexes and absorption coefficients for Region 3 (n3 and αabs,3) and compare with the measured signal at each point to calculate the combined mean squared error for the magnitude and phase.
NOTE: The solution for the refractive index and absorption coefficient is the pair of values that give the lowest error. - Construct the tomographic THz image from the extracted refractive index and absorption coefficient data (n3 and αabs,3) at each pixel. Analyze the tumor regions by comparing with the pathology slide image obtained from the pathologist. Representative results are shown in Figure 9, with examples of insufficient adherence to the protocol in Figure 10 and Figure 11.
8. Extraction of Electrical Properties of the Tissue Using Transmission Spectroscopy Data
- On the main window of the THz transmission spectroscopy measurement software, go to the File tab and click on the Export option. A window will pop up to select the Data Type and Sample to export. Choose Transmittance and Transmittance Phase data types for the quartz and tissue sample measurements.
- Calculate the theoretical frequency-dependent transmission for a range of potential tissue properties using the following equation15:

NOTE: Here is the ratio between Fresnel transmission coefficients for the sample and reference setups; γ1 and γ3 are the complex propagation constants of air and tissue, respectively; and d is the thickness of the tissue. The propagation constant in general is defined as
  . ñ is the complex refractive index defined as
  , where n is the real part of the refractive index; c is the speed of light; ω is the angular frequency; and αabs is the absorption coefficient15.
 - Calculate the combined mean squared error between the magnitude and phase of the transmission in equation (3) and the measurement data from the system for a range of user-defined n and αabs values.
NOTE: The solution for the refractive index and absorption coefficient is the pair of values that give the lowest error. - Plot the extracted refractive index and absorption coefficient data against the frequency range from 0.15–3.5 THz. Representative results are shown in Figure 12.
Results
The THz imaging results18 obtained following the abovementioned protocol of human breast cancer tumor specimen #ND14139 received from the biobank are presented in Figure 9. According to the pathology report, the #ND14139 tumor was a I/II grade infiltrating ductal carcinoma (IDC) obtained from a 49-year-old woman via a left breast lumpectomy surgery procedure. The photograph of the tumor is shown in Figure 9A, the pathology image in
Discussion
Effective THz reflection imaging of fresh tissue is primarily dependent on two critical aspects: 1) the proper consideration of tissue handling (sections 2 and 4.15); and 2) the stage setup (primarily section 4.11). Insufficient drying of the tissue can result in increased reflection and inability to visualize regions due to high reflections of DMEM and other fluids. Meanwhile, poor tissue contact with the imaging window creates rings or spots of low reflection in the THz reflection image that obscure the results. Extra ...
Disclosures
The authors declare that they have no conflict of interest.
Acknowledgements
This work was funded by the National Institutes of Health (NIH) Award # R15CA208798 and in part by the National Science Foundation (NSF) Award # 1408007. Funding for the pulsed THz system was obtained through NSF/MRI Award # 1228958. We acknowledge the use of tissues procured by the National Disease Research Interchange (NDRI) with support from the NIH grant U42OD11158. We also acknowledge the collaboration with Oklahoma Animal Disease Diagnostic Laboratory at the Oklahoma State University for conducting the histopathology procedure on all the tissues handled in this work.
Materials
| Name | Company | Catalog Number | Comments |
| 70% isopropyl alcohol | VWR | 89108-162 | Contains 70% USP grade isopropanol and 30% USP grade deionized water |
| Alconox powder detergent | VWR | 21835-032 | Concentrated detergent to remove organic contaminants from glass, metal, stainless steel, porcelain, ceramic, plastic, rubber, and fiberglass |
| Bio Hazard Bags | Fisher Scientific | 19-033-712 | Justrite FM-Approved Biohazard Waste Container Replacement Bags |
| Cardboard holder | N/A | N/A | Scrap cardboard to keep tissue imaging face intact when immersed in formalin |
| Centrifuge Tubes | VWR | 10026-078 | Centrifuge Tubes with Flat Caps, Conical-Bottom, Polypropylene, Sterile, Standard Line |
| Cotton Swabs | Walmart | 551398298 | Q-tips Original Cotton Swabs used to dye the tissue |
| Ethyl Alcohol | VWR | 71002-426 | KOPTECH Pure (undenatured) anhydrous (200 proof/100%) ethyl alcohol |
| Eye protection goggles | VWR | 89130-918 | Kimberly-clark professional safety glasses |
| Face Mask | VWR | 95041-774 | DUKAL Corporation surgical masks |
| Filter paper | Sigma Aldrich | Z240087 | Whatman grade 1 cellulose filters |
| Formalin solution | Sigma Aldrich | HT501128-4L | 10% neutral buffered formalin |
| Human freshly excised tumors (Infilterating Ductal Carcinoma (IDC)) | National Disease Research Interchange (NDRI biobank | N/A | A protocol is signed with the NDRI for the type of tumors required |
| IRADECON Bleach solution | VWR | 89234-816 | Pre-diluted Sodium Hypochlorite Bleach solution |
| KIMTECH SCIENCE wipes | VWR | 21905-026 | Kimberly-clark professional Kim wipes |
| Laboratory Coat | VWR | 10141-342 | This catalog number is for medium size coat |
| Laboratory tweezers/Forceps | VWR | 82027-388 | Any laboratory tweezers can be used as long as it does not damage the tissue |
| Liquid sample holder (two quartz windows with a 0.1 mm teflon spacer) | TeraView, Ltd | N/A | 1" diameter, and 0.1452" thick quartz windows |
| Nitrile hand gloves | VWR | 82026-426 | This catalog number is for medium size gloves |
| Nitrogen cylinder | Airgas | NI UHP300 | NITROGEN UHP GR 5.0 SIZE 300 |
| Paper towel | VWR | 14222-321 | 11" x 8.78" Sheets, 1 Ply |
| Parafilm | VWR | 52858-076 | Flexible thermoplastic. Rolled, waterproof sheet interwound with paper to prevent self-adhesion. |
| Petri Dish | VWR | 470210-568 | VWR Petri Dish, Slippable, Mono Plate (undivided bottom) |
| Polystyrene Plate | Home Depot | 1S11143A | ~ 10 cm x 10 cm square piece cut from a 11" x 14" x 0.05" Non-glare styrene sheet |
| ScanAcquire Software | TeraView, Ltd | N/A | System Software for THz reflection imaging measurements |
| Stainless steel low-profile blade (#4689) | VWR | 25608-964 | Tissue-Tek Accu-Edge Disposable Microtome Blades |
| Stainless steel metal tray | Quick Medical | 10F | Polar Ware Stainless Steel Medical Instrument Trays |
| Tissue Marking Dyes | Ted Pella, Inc | Yellow Dye #27213-1 Red Dye #27213-2 Blue Dye #27213-4 | Used to orient excised tissue samples sent to the histopathology laboratory |
| TPS Spectra 3000 | TeraView, Ltd | N/A | THz imaging and spectroscopy system |
| TPS Spectra Software | TeraView, Ltd | N/A | System Software for THz transmission spectroscopy measurements |
References
- Burford, N. M., El-Shenawee, M. O. Review of terahertz photoconductive antenna technology. Optical Engineering. 56 (1), 010901 (2017).
- Sun, Q., et al. Recent advances in terahertz technology for biomedical applications. Quantitative Imaging in Medicine and Surgery. 7 (3), 345-355 (2017).
- Wilmink, G. J., et al. In vitro investigation of the biological effects associated with human dermal fibroblasts exposed to 2.52 THz radiation. Lasers in Surgery and Medicine. 43 (2), 152-163 (2011).
- Arbab, M. H., et al. Terahertz spectroscopy for the assessment of burn injuries in vivo. Journal of Biomedical Optics. 18 (7), 077004 (2013).
- Sy, S., et al. Terahertz spectroscopy of liver cirrhosis: investigating the origin of contrast. Physics in Medicine and Biology. 55 (24), 7587-7596 (2010).
- Yu, C., Fan, S., Sun, Y., Pickwell-Macpherson, E. The potential of terahertz imaging for cancer diagnosis: A review of investigations to date. Quantitative Imaging in Medicine and Surgery. 2 (1), 33-45 (2012).
- El-Shenawee, M., Vohra, N., Bowman, T., Bailey, K. Cancer detection in excised breast tumors using terahertz imaging and spectroscopy. Biomedical Spectroscopy and Imaging. 8 (1-2), 1-9 (2019).
- Yamaguchi, S., et al. Brain tumor imaging of rat fresh tissue using terahertz spectroscopy. Scientific Reports. 6 (30124), 1-6 (2016).
- Rong, L., et al. Terahertz in-line digital holography of human hepatocellular carcinoma tissue. Scientific Reports. 5 (8445), 1-6 (2015).
- Park, J. Y., Choi, H. J., Nam, G., Cho, K., Son, J. In Vivo Dual-Modality Terahertz / Magnetic Resonance Imaging Using Superparamagnetic Iron Oxide Nanoparticles as a Dual Contrast Agent. IEEE Transactions on Terahertz Science and Technology. 2 (1), 93-98 (2012).
- Ji, Y. B., et al. Feasibility of terahertz reflectometry for discrimination of human early gastric cancers. Biomedical Optics Express. 6 (4), 1413-1421 (2015).
- Bowman, T., et al. A Phantom Study of Terahertz Spectroscopy and Imaging of Micro- and Nano-diamonds and Nano-onions as Contrast Agents for Breast Cancer. Biomedical Physics and Engineering Express. 3 (5), 055001 (2017).
- Chavez, T., Bowman, T., Wu, J., Bailey, K., El-Shenawee, M. Assessment of Terahertz Imaging for Excised Breast Cancer Tumors with Image Morphing. Journal of Infrared, Millimeter, and Terahertz Waves. 39 (12), 1283-1302 (2018).
- Bowman, T. C., El-Shenawee, M., Campbell, L. K. Terahertz Imaging of Excised Breast Tumor Tissue on Paraffin Sections. IEEE Transactions on Antennas and Propagation. 63 (5), 2088-2097 (2015).
- Bowman, T., El-Shenawee, M., Campbell, L. K. Terahertz transmission vs reflection imaging and model-based characterization for excised breast carcinomas. Biomedical Optics Express. 7 (9), 3756-3783 (2016).
- Bowman, T., Wu, Y., Gauch, J., Campbell, L. K., El-Shenawee, M. Terahertz Imaging of Three-Dimensional Dehydrated Breast Cancer Tumors. Journal of Infrared, Millimeter, and Terahertz Waves. 38 (6), 766-786 (2017).
- Bowman, T., et al. Pulsed terahertz imaging of breast cancer in freshly excised murine tumors. Journal of Biomedical Optics. 23 (2), 026004 (2018).
- Bowman, T., Vohra, N., Bailey, K., El-Shenawee, M. Terahertz tomographic imaging of freshly excised human breast tissues. Journal of Medical Imaging. 6 (2), 023501 (2019).
- Vohra, N., et al. Pulsed Terahertz Reflection Imaging of Tumors in a Spontaneous Model of Breast Cancer. Biomedical Physics and Engineering Express. 4 (6), 065025 (2018).
- Jacobs, L. Positive margins: the challenge continues for breast surgeons. Annals of Surgical Oncology. 15 (5), 1271-1272 (2008).
- Moran, M. S., et al. Society of Surgical Oncology--American Society for Radiation Oncology Consensus Guideline on Margins for Breast-Conserving Surgery With Whole-Breast Irradiation in Stages I and II Invasive Breast Cancer. International Journal of Radiation Oncology. 88 (3), 553-564 (2014).
- Fitzgerald, A. J., et al. Terahertz Pulsed Imaging of human breast tumors. Radiology. 239 (2), 533-540 (2006).
- Ashworth, P. C., et al. Terahertz pulsed spectroscopy of freshly excised human breast cancer. Optics Express. 17 (15), 12444-12454 (2009).
- Doradla, P., Alavi, K., Joseph, C., Giles, R. Detection of colon cancer by continuous-wave terahertz polarization imaging technique. Journal of Biomedical Optics. 18 (9), 090504 (2013).
- Reid, C. B., et al. Terahertz pulsed imaging of freshly excised human colonic tissues. Physics in Medicine and Biology. 56 (1), 4333-4353 (2011).
- . Teraview.com Available from: https://teraview.com (2019)
- Orosco, R. K., et al. Positive Surgical Margins in the 10 Most Common Solid Cancers. Scientific Reports. 8 (1), 1-9 (2018).
- Bowman, T., et al. Statistical signal processing for quantitative assessment of pulsed terahertz imaging of human breast tumors. 2017 42nd International Conference on Infrared, Millimeter, and Terahertz Waves (IRMMW-THz). , 1-2 (2017).
- Gavdush, A. A., et al. Terahertz spectroscopy of gelatin-embedded human brain gliomas of different grades: a road toward intraoperative THz diagnosis. Journal of Biomedical Optics. 24 (2), 027001 (2019).
Reprints and Permissions
Request permission to reuse the text or figures of this JoVE article
Request PermissionThis article has been published
Video Coming Soon
Copyright © 2025 MyJoVE Corporation. All rights reserved