
5.3 : تحليل المنخل ومنحنيات التصنيف
تحليل المنخل هو طريقة تستخدم لتحديد توزيع حجم الجسيمات لمواد التجميع. تتضمن هذه العملية الخطوات التالية:
- يتم وزن الكمية المطلوبة من عينة التجميع المجففة.
- يتم غربلة الكتل الموزونة من خلال مجموعة من المناخل ذات الفتحات المربعة مرتبة بترتيب تنازلي لحجم الفتحة، مع وضع أكبر شبكة في الأعلى (العمود 1 من الجدول 1).
- يتم رج أو اهتزاز كومة المناخل لتسهيل فرز الجسيمات حسب الحجم.
- بعد الغربلة لفترة محددة، يتم وزن المادة المحتجزة على كل منخل (العمود 2 من الجدول 1).
- يتم التعبير عن وزن الجسيمات المحتجزة على كل منخل كنسبة مئوية من كتلة العينة الإجمالية (العمود 3 من الجدول 1).

- يتم حساب النسبة المئوية التراكمية التي تمر عبر كل منخل لأقرب نسبة مئوية من المنخل الأكثر دقة المتحرك لأعلى (العمود 4 من الجدول 1).
- يتم رسم منحنى التصنيف على رسم بياني (الشكل 1) حيث تمثل قيم الإحداثيات النسبة المئوية التي تمر (العمود 4 من الجدول 1)، وتُظهر قيم المحور السيني فتحات المنخل (العمود 1 من الجدول 1)، مضبوطة على مقياس لوغاريتمي.
الجدول 1: بيانات تحليل المنخل على الرمل
| العمود 1 | العمود 2 | العمود 3 | العمود 4 |
|---|---|---|---|
| منخل ASTM | الوزن المحتجز على كل منخل (غ) | النسبة المئوية للوزن المحتجز (%) | النسبة المئوية التراكمية المارة (%) |
| ⅜ بوصة (9.5 مم) | 0 | 0 | 98+2 = 100 |
| رقم 4 (4.75 مم) | 10 | 2 | 88+10 = 98 |
| رقم 8 (2.36 مم) | 50 | 10 | 79+9 = 88 |
| رقم 16 (1.18 مم) | 45 | 9 | 61+18 = 79 |
| رقم 30 (600 ميكرون) | 90 | 18 | 29+32 = 61 |
| رقم 50 (300 ميكرون) | 160 | 32 | 10+19 = 29 |
| رقم 100 (150 ميكرون) | 95 | 19 | 10 |
| الوعاء السفلي | 50 | 10 | |
| إجمالي وزن الركام = 500 غ | |||
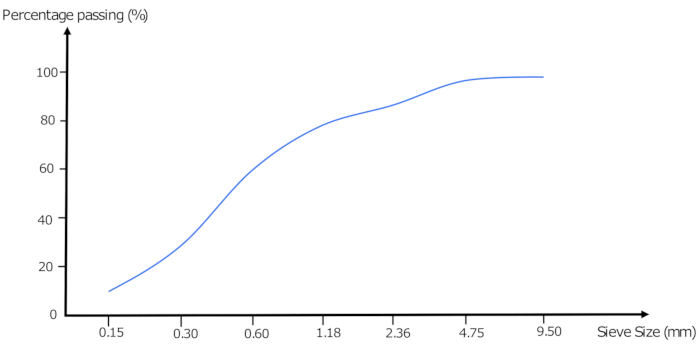
تبسط منحنيات التصنيف بصريًا توزيع أحجام الجسيمات وهي ضرورية لضمان أن تلبي الكتل مواصفات التصنيف المطلوبة لمشاريع البناء.
From Chapter 5:

Now Playing
5.3 : تحليل المنخل ومنحنيات التصنيف
Aggregates and Water
313 Views

5.1 : عدم سلامة الركام بسبب تغير الحجم
Aggregates and Water
98 Views

5.2 : المواد الضارة في المجموع
Aggregates and Water
153 Views

5.4 : معامل النعومة
Aggregates and Water
284 Views

5.5 : أنواع التقدير الإجمالي
Aggregates and Water
426 Views

5.6 : الحد الأقصى لحجم الركام
Aggregates and Water
86 Views

5.7 : جودة المياه
Aggregates and Water
87 Views

5.8 : اختبار جودة المياه
Aggregates and Water
103 Views

5.9 : تصنيف الركام
Aggregates and Water
305 Views

5.10 : شكل وملمس الركام الخشن
Aggregates and Water
197 Views

5.11 : ترابط الركام وقوته الخرسانية
Aggregates and Water
140 Views

5.12 : صلابة الركام ومتانته
Aggregates and Water
248 Views

5.13 : الوزن النوعي للركام
Aggregates and Water
223 Views

5.14 : الكثافة الظاهرية للركام
Aggregates and Water
417 Views

5.15 : مسامية وامتصاص الركام
Aggregates and Water
264 Views
See More
Copyright © 2025 MyJoVE Corporation. All rights reserved