
5.3 : Analisi del setaccio e curve di classificazione
L'analisi del setaccio è un metodo utilizzato per determinare la distribuzione granulometrica dei materiali aggregati. Questo processo comporta i seguenti passaggi:
- Viene pesata la quantità richiesta di campione essiccato di aggregato.
- Gli aggregati pesati vengono setacciati attraverso una serie di setacci con aperture delle maglie disposte in ordine decrescente, con il setaccio la maglia più grande in alto (colonna 1 della tabella 1).
- La pila di setacci viene scossa o fatta vibrare per facilitare la selezione delle particelle in base alle dimensioni.
- Dopo aver setacciato per un periodo di tempo specifico, il materiale trattenuto su ciascun setaccio viene pesato (colonna 2 della tabella 1).
-
Il peso delle particelle trattenute su ciascun setaccio è espresso come percentuale della massa totale del campione (colonna 3 della tabella 1).

- La percentuale cumulativa che passa attraverso ciascun setaccio viene calcolata arrotondata all'uno percento più vicino, a partire dal setaccio più fine e procedendo verso l'alto (colonna 4 della tabella 1).
- La curva di classificazione è tracciata su un grafico (Figura 1) in cui i valori delle ordinate rappresentano la percentuale di passaggio (Colonna 4 della Tabella 1) e i valori delle ascisse mostrano le aperture del setaccio (Colonna 1 della Tabella 1), impostate su una scala logaritmica.
Tabella 1: Dati per l'analisi del setaccio sulla sabbia
| Colonna 1 | Colonna 2 | Colonna 3 | Colonna 4 |
| UNI EN (Apertura maglie) | Peso trattenuto su ogni setaccio (g) | Percentuale di peso trattenuto su ogni setaccio (%) | Percentuale cumulativa che passa ogni setaccio (%) |
| (9,5 mm) | 0 | 0 | 98+2 = 100 |
| UNI EN(4,75 mm) | 10 | 2 | 88+10 = 98 |
| UNI EN(2,36 mm) | 50 | 10 | 79+9 = 88 |
| UNI EN(1,18 mm) | 45 | 9 | 61+18 = 79 |
| UNI EN(0,6 mm) | 90 | 18 | 29+32 = 61 |
| UNI EN(0,3 mm) | 160 | 32 | 10+19 = 29 |
| UNI EN(0,15 mm) | 95 | 19 | 10 |
| Fondo della padella | 50 | 10 | |
| Peso totale dell'aggregato = 500 g | |||
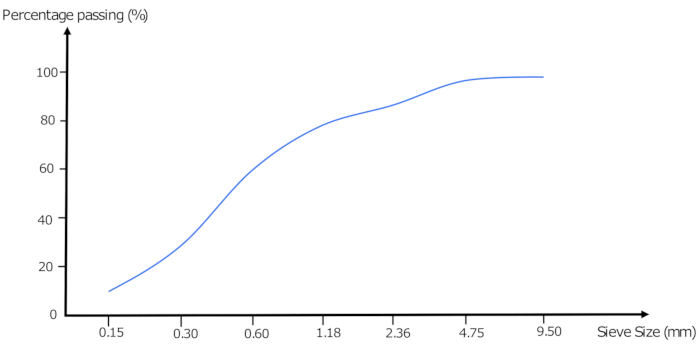
Le curve di classificazione semplificano visivamente la distribuzione delle dimensioni delle particelle e sono essenziali per garantire che gli aggregati soddisfino le specifiche di classificazione richieste per i progetti di costruzione.
Dal capitolo 5:

Now Playing
5.3 : Analisi del setaccio e curve di classificazione
Aggregates and Water
314 Visualizzazioni

5.1 : Inadeguatezza dell'aggregato a causa della variazione di volume
Aggregates and Water
98 Visualizzazioni

5.2 : Sostanze nocive in aggregato
Aggregates and Water
153 Visualizzazioni

5.4 : Modulo di Finezza
Aggregates and Water
285 Visualizzazioni

5.5 : Tipi di classificazione degli aggregati
Aggregates and Water
428 Visualizzazioni

5.6 : Dimensione massima dell'aggregato
Aggregates and Water
88 Visualizzazioni

5.7 : Qualità dell'acqua
Aggregates and Water
88 Visualizzazioni

5.8 : Test della qualità dell'acqua
Aggregates and Water
103 Visualizzazioni

5.9 : Classificazione degli aggregati
Aggregates and Water
305 Visualizzazioni

5.10 : Forma e consistenza degli aggregati grossolani
Aggregates and Water
197 Visualizzazioni

5.11 : Legame e resistenza dell'aggregato
Aggregates and Water
140 Visualizzazioni

5.12 : Tenacità e durezza dell'aggregato
Aggregates and Water
248 Visualizzazioni

5.13 : Peso specifico degli aggregati
Aggregates and Water
223 Visualizzazioni

5.14 : Densità apparente dell'aggregato
Aggregates and Water
417 Visualizzazioni

5.15 : Porosità e assorbimento degli aggregati
Aggregates and Water
265 Visualizzazioni
See More
Personale delle biblioteche
Copyright © 2025 MyJoVE Corporation. Tutti i diritti riservati