
5.3 : 체 분석 및 등급 곡선
체 분석은 골재 재료의 입자 크기 분포를 결정하는 데 사용되는 방법입니다. 이 프로세스에는 다음 단계가 포함됩니다.
- 건조된 골재 시료의 필요한 양을 칭량한다.
- 무게를 잰 골재는 구멍 크기가 가장 큰 것을 맨 위에 두고, 구멍 크기가 큰 순서대로 정사각형 구멍이 있는 체 세트로 체질합니다(표 1의 열 1).
- 체 더미를 흔들거나 진동시켜 입자를 크기에 따라 분류하기 쉽게 합니다.
- 일정 기간 동안 체질한 후, 각 체에 남은 물질을 무게 측정합니다(표 1의 2열).
-
각 체에 잔류한 입자의 무게는 총 샘플 질량의 백분율로 표시됩니다(표 1의 3열).

- 각 체를 통과하는 누적 백분율은 가장 미세한 체에서 위쪽으로 이동할 때 가장 가까운 1%까지 계산됩니다(표 1의 4열).
- 등급 곡선은 그래프(그림 1)에 표시되며, 여기서 세로축 값은 통과율(표 1의 열 4)을 나타내고 가로축 값은 체 구멍(표 1의 열 1)을 나타내며 이는 대수적 눈금으로 설정됩니다.
표 1: 모래에 대한 체 분석 데이터
| 1열 | 2열 | 3열 | 4번째 열 |
| ASTM 체 (체 크기) | 각 체에 유지된 무게(g) | 각 체에 잔류한 중량 백분율(%) | 각 체를 통과하는 누적 백분율(%) |
| 3/8인치(9.5mm) | 0 | 0 | 98+2 = 100 |
| 4호(4.75mm) | 10 | 2 | 88+10 = 98 |
| 8호(2.36mm) | 50 | 10 | 79+9 = 88 |
| 16호(1.18mm) | 45 | 9 | 61+18 = 79 |
| 30호(600μ) | 90 | 18 | 29+32 = 61 |
| 50호(300μ) | 160 | 32 | 10+19 = 29 |
| 100호(150μ) | 95 | 19 | 10 |
| 바닥 팬 | 50 | 10 | |
| 골재 총 중량 = 500g | |||
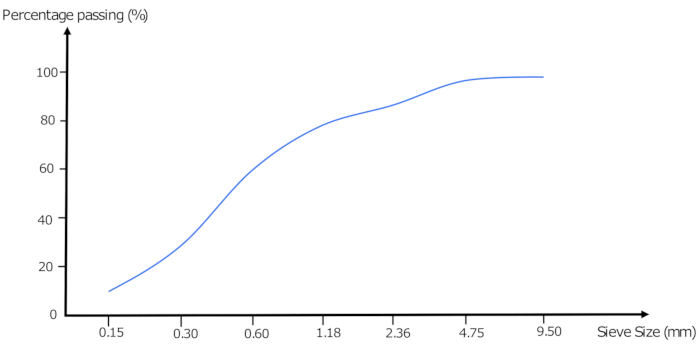
등급 곡선은 입자 크기 분포를 시각적으로 단순화해 주며, 골재가 건설 프로젝트에 필요한 등급 사양을 충족하는지 확인하는 데 필수적입니다.
장에서 5:

Now Playing
5.3 : 체 분석 및 등급 곡선
Aggregates and Water
313 Views

5.1 : Volume Change로 인한 골재의 불건전성
Aggregates and Water
98 Views

5.2 : 집합체의 유해 물질
Aggregates and Water
153 Views

5.4 : 섬도 계수
Aggregates and Water
284 Views

5.5 : 골재 등급 지정의 유형
Aggregates and Water
426 Views

5.6 : 골재의 최대 크기
Aggregates and Water
86 Views

5.7 : 수질의 질
Aggregates and Water
87 Views

5.8 : 수질 테스트
Aggregates and Water
103 Views

5.9 : 골재 분류
Aggregates and Water
305 Views

5.10 : 굵은 골재의 모양과 질감
Aggregates and Water
197 Views

5.11 : 골재의 결합 및 강도
Aggregates and Water
140 Views

5.12 : 골재의 인성과 경도
Aggregates and Water
248 Views

5.13 : 골재의 비중
Aggregates and Water
223 Views

5.14 : 골재의 부피 밀도
Aggregates and Water
417 Views

5.15 : 골재의 다공성과 흡수
Aggregates and Water
264 Views
See More
Copyright © 2025 MyJoVE Corporation. 판권 소유