
5.3 : Ситовой анализ и кривые гранулометрического состава
Ситовой анализ — это метод, используемый для определения гранулометрического состава заполнителей. Этот процесс включает следующие этапы:
- Взвешивается необходимое количество высушенного образца заполнителя.
- Взвешенные заполнители просеивают через набор сит с квадратными отверстиями, расположенными в порядке убывания размера ячеек, причем сетка с самыми большими отверстиями находится сверху (столбец 1 таблицы 1).
- Стопку сит встряхивают или подвергают вибрации для облегчения сортировки частиц по размеру.
- После просеивания в течение определенного периода, материал, оставшийся на каждом сите, взвешивается (столбец 2 таблицы 1).
- Масса частиц, задержавшихся на каждом сите, выражается в процентах от общей массы образца (столбец 3 таблицы 1).

- Совокупный процент прохождения каждого сита рассчитывается с точностью до одного процента от самого мелкого сита по мере продвижения вверх (столбец 4 таблицы 1).
- Кривая гранулометрического состава наносится на график (рисунок 1), где значения ординат представляют процент прохождения (столбец 4 таблицы 1), а значения абсцисс показывают отверстия сита (столбец 1 таблицы 1), в логарифмическом масштабе.
Таблица 1: Данные ситового анализа песка
| Столбец 1 | Столбец 2 | Столбец 3 | Столбец 4 |
| Сито ASTM(Размер сита) | Вес, оставшийся на каждом сите (г) | Процент веса, оставшегося на каждом сите (%) | Совокупный процент прохождения через каждое сито (%) |
| ⅜ дюйма (9.5 mm) | 0 | 0 | 98+2 = 100 |
| № 4 (4.75 mm) | 10 | 2 | 88+10 = 98 |
| № 8 (2.36mm) | 50 | 10 | 79+9 = 88 |
| № 16 (1.18 mm) | 45 | 9 | 61+18 = 79 |
| № 30 (600 µ) | 90 | 18 | 29+32 = 61 |
| № 50 (300 µ) | 160 | 32 | 10+19 = 29 |
| № 100 (150 µ) | 95 | 19 | 10 |
| Нижий поддон | 50 | 10 | |
| Общий вес заполнителя = 500 g | |||
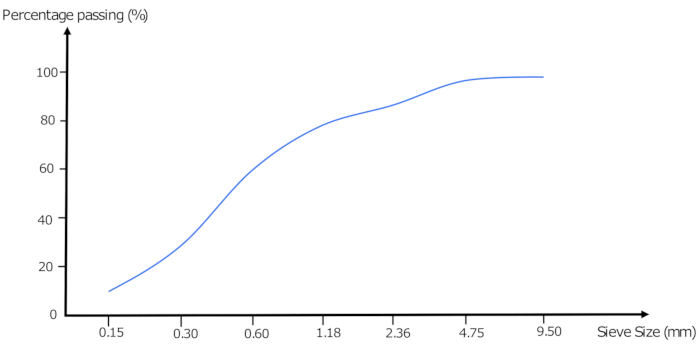
Кривые гранулометрического состава визуально упрощают распределение размеров частиц и необходимы для обеспечения соответствия заполнителей требуемым характеристикам гранулометрического состава для строительных проектов.
Из главы 5:

Now Playing
5.3 : Ситовой анализ и кривые гранулометрического состава
Aggregates and Water
313 Просмотры

5.1 : Непрочность заполнителя из-за изменения объема
Aggregates and Water
98 Просмотры

5.2 : Вредные вещества в совокупности
Aggregates and Water
153 Просмотры

5.4 : Модуль тонкости помола
Aggregates and Water
284 Просмотры

5.5 : Типы сортировки заполнителей
Aggregates and Water
426 Просмотры

5.6 : Максимальный размер заполнителя
Aggregates and Water
86 Просмотры

5.7 : Качество воды
Aggregates and Water
87 Просмотры

5.8 : Проверка качества воды
Aggregates and Water
103 Просмотры

5.9 : Классификация заполнителей
Aggregates and Water
305 Просмотры

5.10 : Форма и текстура крупных заполнителей
Aggregates and Water
197 Просмотры

5.11 : Связывание и прочность заполнителя
Aggregates and Water
140 Просмотры

5.12 : Прочность и твердость заполнителя
Aggregates and Water
248 Просмотры

5.13 : Удельный вес заполнителей
Aggregates and Water
223 Просмотры

5.14 : Насыпная плотность заполнителя
Aggregates and Water
417 Просмотры

5.15 : Пористость и абсорбция заполнителя
Aggregates and Water
264 Просмотры
See More
Авторские права © 2025 MyJoVE Corporation. Все права защищены