
5.3 : Análisis de tamices y curvas de clasificación
El análisis granulométrico es un método que se utiliza para determinar la distribución del tamaño de las partículas de los materiales agregados. Este proceso implica los siguientes pasos:
- Se pesa la cantidad necesaria de muestra seca de agregado.
- Los agregados pesados se tamizan a través de un conjunto de tamices con aperturas cuadradas dispuestas en orden descendente de tamaño de apertura, con la malla más grande en la parte superior (Columna 1 de la Tabla 1).
- La pila de tamices se agita o vibra para facilitar la clasificación de las partículas por tamaño.
- Después de tamizar durante un período específico, se pesa el material retenido en cada tamiz (Columna 2 de la Tabla 1).
- El peso de las partículas retenidas en cada tamiz se expresa como porcentaje de la masa total de la muestra (Columna 3 de la Tabla 1).

- El porcentaje acumulativo que pasa por cada tamiz se calcula al uno por ciento más cercano a partir del tamiz más fino que se mueve hacia arriba (Columna 4 de la Tabla 1).
- La curva de clasificación se representa en un gráfico (Figura 1) donde los valores de ordenadas representan el porcentaje de aprobación (Columna 4 de la Tabla 1), y los valores de abscisas muestran las aperturas del tamiz (Columna 1 de la Tabla 1), establecidos en una escala logarítmica.
Tabla 1: Datos del análisis granulométrico de la arena
| Columna 1 | Columna 2 | Columna 3 | Columna 4 |
| Tamiz ASTM (Tamaño del tamiz) | Peso retenido en cada tamiz (g) | Porcentaje de peso retenido en cada tamiz (%) | Porcentaje acumulado que pasa por cada tamiz (%) |
|---|---|---|---|
| ⅜ de pulgada (9,5 mm) | 0 | 0 | 98+2 = 100 |
| N.º 4 (4,75 mm) | 10 | 2 | 88+10 = 98 |
| No. 8 (2.36mm) | 50 | 10 | 79+9 = 88 |
| N.º 16 (1,18 mm) | 45 | 9 | 61+18 = 79 |
| No. 30 (600 µ) | 90 | 18 | 29+32 = 61 |
| No. 50 (300 µ) | 160 | 32 | 10+19 = 29 |
| No. 100 (150 µ) | 95 | 19 | 10 |
| Sartén inferior | 50 | 10 | |
| Peso total del agregado = 500 g | |||
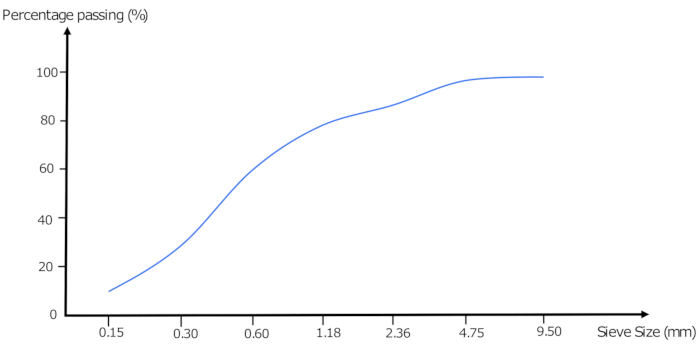
Las curvas de clasificación simplifican visualmente la distribución de tamaños de partículas y son esenciales para garantizar que los agregados cumplan con las especificaciones de clasificación requeridas para los proyectos de construcción.
Del capítulo 5:

Now Playing
5.3 : Análisis de tamices y curvas de clasificación
Aggregates and Water
308 Vistas

5.1 : Falta de solidez del agregado debido al cambio de volumen
Aggregates and Water
98 Vistas

5.2 : Sustancias nocivas en conjunto
Aggregates and Water
153 Vistas

5.4 : Módulo de finura
Aggregates and Water
281 Vistas

5.5 : Tipos de clasificación de agregados
Aggregates and Water
417 Vistas

5.6 : Tamaño máximo del agregado
Aggregates and Water
79 Vistas

5.7 : Calidad del agua
Aggregates and Water
87 Vistas

5.8 : Pruebas de la calidad del agua
Aggregates and Water
103 Vistas

5.9 : Clasificación de áridos
Aggregates and Water
305 Vistas

5.10 : Forma y textura de los áridos gruesos
Aggregates and Water
195 Vistas

5.11 : Adherencia y resistencia de los áridos
Aggregates and Water
140 Vistas

5.12 : Tenacidad y dureza de los áridos
Aggregates and Water
246 Vistas

5.13 : Gravedad específica de los áridos
Aggregates and Water
223 Vistas

5.14 : Densidad aparente de los áridos
Aggregates and Water
415 Vistas

5.15 : Porosidad y absorción de los áridos
Aggregates and Water
264 Vistas
See More
ACERCA DE JoVE
Copyright © 2025 MyJoVE Corporation. Todos los derechos reservados