
5.3 : ניתוח ניפוי ועקומות דירוג
ניתוח ניפוי היא שיטה המשמשת לקביעת התפלגות גודל החלקיקים של חומרי אגרגט. תהליך זה כולל את השלבים הבאים:
- נשקלת כמות מדויקת של דגימה מיובשת של אגרגט.
- האגרגטים הנשקלים מנופים דרך סט של נפות עם פתחים מרובעים, המסודרים בסדר יורד לפי גודל הפתח, כאשר הנפה עם הפתחים הגדולים ביותר נמצאת בראש (עמודה 1 של טבלה 1).
- ערמת הנפות מנוערת או מורטטת כדי לסייע במיון החלקיקים לפי גודלם.
- לאחר ניפוי במשך פרק זמן מסוים, נשקל החומר שנשאר על כל נפה (עמודה 2 של טבלה 1).
- משקל החלקיקים שנשאר על כל נפה מבוטא כאחוז מהמשקל הכולל של הדגימה (עמודה 3 של טבלה 1).

- האחוז המצטבר העובר בכל נפה מחושב ומעוגל לאחוז הקרוב ביותר, מהנפה העדינה ביותר ומעלה (עמודה 4 של טבלה 1).
- עקומת הדירוג מצוירת על גרף (איור 1), שבו הערכים בציר האנכי מייצגים את אחוז המעבר (עמודה 4 של טבלה 1), והערכים בציר האופקי מציגים את פתיחת הנפות (עמודה 1 של טבלה 1), בקנה מידה לוגריתמי.
טבלה 1: נתונים לניתוח ניפוי על חול
| טור 1 | טור 2 | טור 3 | טור 4 |
|---|---|---|---|
| נפת ASTM (גודל נפה) | משקל שנשמר על כל נפה (גרם) | אחוז משקל שנשמר על כל נפה (%) | אחוז מצטבר עובר בכל נפה (%) |
| ⅜ אינץ' (9.5 מ"מ) | 0 | 0 | 98+2 = 100 |
| מספר 4 (4.75 מ"מ) | 10 | 2 | 88+10 = 98 |
| מספר 8 (2.36 מ"מ) | 50 | 10 | 79+9 = 88 |
| מספר 16 (1.18 מ"מ) | 45 | 9 | 61+18 = 79 |
| מספר 30 (600 µ) | 90 | 18 | 29+32 = 61 |
| מספר 50 (300 µ) | 160 | 32 | 10+19 = 29 |
| מספר 100 (150 µ) | 95 | 19 | 10 |
| תבנית תחתונה | 50 | 10 | |
| משקל כולל של אגרגט = 500 גרם. | |||
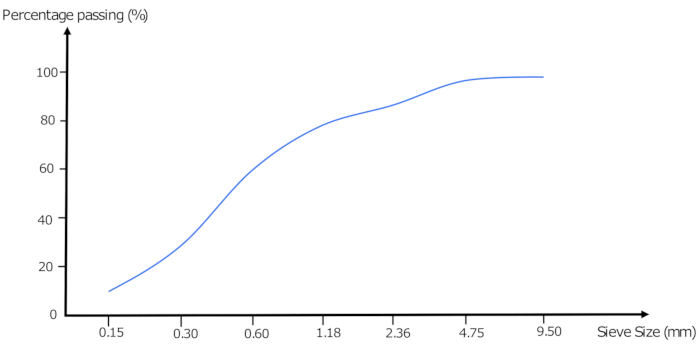
עקומות דירוג מפשטות ויזואלית את התפלגות גדלי החלקיקים, והן חיוניות כדי להבטיח שהאגרגטים עומדים בדרישות הדירוג הדרושות עבור פרויקטי בנייה.
From Chapter 5:

Now Playing
5.3 : ניתוח ניפוי ועקומות דירוג
Aggregates and Water
313 Views

5.1 : אי תקינות של צבירה עקב שינוי עוצמת הקול
Aggregates and Water
98 Views

5.2 : חומרים מזיקים במצטבר
Aggregates and Water
153 Views

5.4 : מודולוס עדינות
Aggregates and Water
284 Views

5.5 : סוגי דירוג מצטבר
Aggregates and Water
426 Views

5.6 : גודל מרבי של צבירה
Aggregates and Water
86 Views

5.7 : איכות המים
Aggregates and Water
87 Views

5.8 : בדיקת איכות המים
Aggregates and Water
103 Views

5.9 : סיווג אגרגטים
Aggregates and Water
305 Views

5.10 : צורה ומרקם של אגרגטים גסים
Aggregates and Water
197 Views

5.11 : קשר וחוזק של אגרגטים
Aggregates and Water
140 Views

5.12 : קשיחות וקשיות של אגרגט
Aggregates and Water
248 Views

5.13 : משקל סגולי של אגרגטים
Aggregates and Water
223 Views

5.14 : צפיפות נפחית של אגרגטים
Aggregates and Water
417 Views

5.15 : נקבוביות ויכולת ספיגה של אגרגטים
Aggregates and Water
264 Views
See More
Copyright © 2025 MyJoVE Corporation. All rights reserved