
表面染料流可视化:观察超音速流中条纹模式的定性方法
Overview
周围或身体上的流量可视化是空气动力学研究的重要工具。它提供了一种定性和定量研究流结构的方法,也有助于研究者对流体流动行为进行理论研究和验证。流可视化可以分为两类:场外可视化和表面流可视化。场外流动可视化技术涉及确定感兴趣主体周围的流动特征。它们包括但不限于粒子图像速度测量 (PIV)、Schlieren 成像和烟流可视化。这些技术可以提供身体周围流动的定性和定量数据。但是,这些技术通常成本高昂且难以设置。另一方面,表面流可视化技术涉及用染料涂覆感兴趣的主体,以研究表面的流动。这些技术在实践中更具侵入性,包括染料流动可视化,最近还使用压敏涂料,从而提供身体表面流动的详细图像。这使得研究人员能够可视化不同的流动特征,包括层状气泡、边界层过渡和流分离。染料流可视化是当前实验中感兴趣的技术,它提供了表面流的定性图像,是最简单、最具成本效益的表面流可视化方法之一,专门用于可视化身体。
本实验中,在超音速流中研究了六个物体的表面流动行为。利用染料流可视化技术获得条纹图案,从流图像中识别和研究流道、流动附着和分离程度以及冲击的位置和类型。
Procedure
-
在超音速流中观察条纹
- 将荧光染料粉末和矿物油混合在塑料碗中。以增量向染料中加入少量矿物油,持续混合,直到获得半粘性混合物。混合物不应该是稀血的。
- 将刺痛安装在超音速风洞试验室上方,并将其锁定到位。本演示使用了测试部分为 6 in x 4 且工作马赫数范围为 1.5 到 4 的吹落超音速风洞,如图1所示。通过调整块设置(更改测试部分的面积比),马赫数会发生变化。
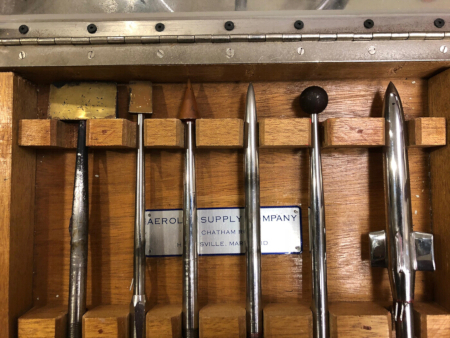
- 将 2D 楔形模型拧到刺安装上并固定楔块的方向,使楔形表面面向风洞测试部分的透明侧壁。所有模型如图2所示。
- 使用画笔将足够数量的染料混合物涂到模型上。确保染料不会从模型上滴下来。请参阅图 3以寻求参考。
- 调整所需自由流马赫数的块设置。
- 关闭并固定风洞面板。
- 运行风洞 6 秒。
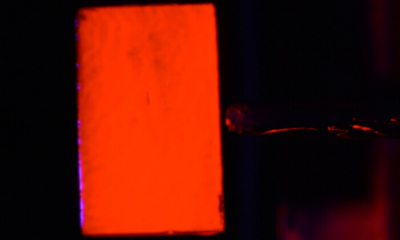
- 运行完成后,将紫外线照射到模型上以照亮染料。使用相机捕获条纹图像。
- 根据表 1 中列出的模型和重复步骤 1.
Results
Application and Summary
Tags

跳至...
此集合中的视频:

Now Playing
表面染料流可视化:观察超音速流中条纹模式的定性方法
Aeronautical Engineering
4.9K Views

模型飞机的空气动力学性能:DC-6B
Aeronautical Engineering
8.3K Views

推进器特性:音高、直径和叶片数在性能上的变化
Aeronautical Engineering
26.5K Views

机翼行为:克拉克Y-14翼上的压力分布
Aeronautical Engineering
21.2K Views

Clark Y-14 翼性能:高提升设备的部署(片和板条)
Aeronautical Engineering
13.4K Views

湍流球法:评估风洞流量质量
Aeronautical Engineering
8.7K Views

交叉圆柱流:测量压力分布和估计阻力系数
Aeronautical Engineering
16.2K Views

喷嘴分析:沿聚合和融合分流喷嘴的马赫数和压力的变化
Aeronautical Engineering
38.0K Views

施利伦成像:一种可视化超音速流特性的技术
Aeronautical Engineering
11.7K Views

水隧道中的流量可视化:在三角洲翼上观察前沿涡流
Aeronautical Engineering
8.2K Views

皮托静态管:测量气流速度的设备
Aeronautical Engineering
49.2K Views

恒温测量:研究湍流边界层流的工具
Aeronautical Engineering
7.3K Views

压力传感器:使用皮托静态管进行校准
Aeronautical Engineering
8.5K Views

实时飞行控制:嵌入式传感器校准和数据采集
Aeronautical Engineering
10.3K Views

多直升机空气动力学:六轴飞行器上的特征推力
Aeronautical Engineering
9.2K Views
版权所属 © 2025 MyJoVE 公司版权所有,本公司不涉及任何医疗业务和医疗服务。