Method Article
デジタル顕微鏡を用いた細胞死開始の研究
要約
ここでは、細胞死誘導後に接種された葉を連続的にイメージングすることにより、プログラムされた細胞死開始率を研究するためのプロトコルを提示します。
要約
過敏性反応(HR)が与える耐性は、 N個の 耐性遺伝子によって決定できる効果的な防御応答です。HRは、接種された葉の細胞死帯の形成として現れます。ここでは、デジタル顕微鏡を用いて、細胞死開始から細胞死出現までの期間に接種した葉をイメージングすることにより、細胞死開始率を研究するためのプロトコルを提示する。デジタルマイクロスコープは、所望の間隔で連続的なイメージングプロセスを可能にし、従来の方法では数時間かかっていた細胞死開始率を数分まで正確に正確に測定することができます。また、デジタルマイクロスコープによるイメージングは光に依存しないため、植物の概日リズムを乱すことなく、昼夜を問わず使用できます。プログラムされた細胞死発生をもたらすさまざまな病理系は、このプロトコルを使用してわずかな修正で研究できます。全体として、このプロトコルは、細胞死開始率の単純で正確かつ安価な同定を可能にします。
概要
ジャガイモは世界で最も広く栽培されている食用作物の1つであり、米、小麦、トウモロコシに次ぐ第4位です。しかし、ジャガイモの生産は、現在最も重要なウイルス病原体と考えられているジャガイモウイルスY(PVY)によって深刻な影響を受ける可能性があります1,2。ジャガイモの植物ではcv。Rywal、PVYのいくつかの株(PVY株N-Wilgaを含む)は、感染部位への病原体の制限が接種された葉の壊死性病変として現れる過敏反応(HR)付与耐性を引き起こします3。この病態系では、低温で栽培された植物は壊死性病変を効率的に発症するため、HRは温度依存的なNy-1耐性遺伝子によって媒介されますが、高温(28°C)で恒常的に栽培された植物では、抵抗性の流産が病変形成の欠如と全身性ウイルスの拡散として実証されます3,4.植物を低温(22°C)に移すと、細胞死が開始され、細胞死の開始から細胞死の出現までの期間に接種された葉をイメージングすることにより、細胞死の開始速度を追跡するために利用することができます。
このプロトコルはデジタル顕微鏡を使用して細胞死の開始率の決定のための簡単な方法を示す。28°Cから22°Cに移した後、接種した葉をデジタル顕微鏡で撮影することで、所望の間隔で葉を連続観察することができます。他の方法(例えば、共焦点顕微鏡または肉眼による病変形成の観察)の使用とは異なり、これにより、病変形成の正確な時間、したがって、前述の方法の数時間とは対照的に、数分までの細胞死開始率を正確に決定することができます5,6。また、デジタル顕微鏡は光に左右されないため、昼夜を問わず使用できます。このプロトコルがまた細胞死の開始にかかわる部品を識別するか、または使用された植物がtransgenic、興味の部品のレベルを変えられたら細胞死の開始率に対する異なった部品の効果を定めるのに使用することができる。
プロトコル
注:セクション1および2では、Lukanらによって概説された方法に基づいて植物材料調製のための修正されたプロトコルについて説明します7。具体的には、制御された環境条件と接種物の準備にいくつかの変更が加えられました。
1.ジャガイモの栽培
- 健康なジャガイモのCVを育てます。茎節組織培養におけるライワル植物8.
- 6〜8週間後、滅菌ピンセットとメスナイフを使用して、滅菌条件下で滅菌紙にジャガイモの苗の節を含む長さ1cmの外植片を10個切り取ります。
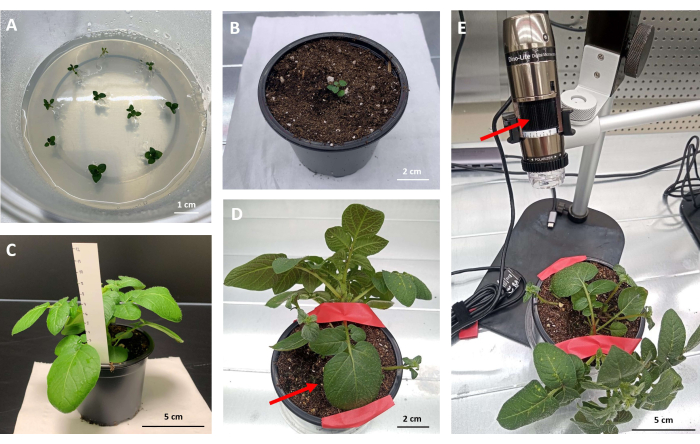
- それらをMurashige and Skoog(MS30)培地(図1A)と一緒にプラスチックの箱に移し、制御された環境条件(250μEまたはμmol/m2/sの放射線と16時間の日長、相対湿度55%±5%)で、明るい場所で22°C、暗所で19°Cで増殖させます。
- マイクロプロパゲーションの2週間後に土壌に移します。
- 鉢(r = 10 cm)に土を入れます。鉢の真ん中の土に指で深さ3〜4cmの穴を開け、穴に水を入れて吸収されるのを待ちます。
- 鉢ごとに1つの植物を穴に入れ、葉を表面の上に残します。根を土でそっと覆います(図1B)。
注:一部の植物は根を発達させない場合があります。これらの植物を分析から除外します。
- 制御された環境条件(光で22°C、暗所で19°C、相対湿度55%±5%、放射量250μmol/m2/s、日長16時間)で、成長チャンバー内の土壌中で植物を育てます。
- 3〜4週間後、植物の準備が整います。これらの植物を使用して接種します。
注:植物には、リーフレットが見える完全に発達した葉が少なくとも3〜4枚必要です(図1C)。PVYによる病変と間違われる可能性のある目に見える症状(黄色または茶色の葉)がなく、健康に見えるはずです。同等の結果を得るには、植物の免疫応答と病変形成に対する概日リズムの影響を回避するために、すべての実験で植物に同時に(例えば、午前9時に)接種する必要があります9,10,11。
2.接種の準備とジャガイモの接種
- 植物にPVY株N-Wilga(PVYN-Wi;アクセッション番号。EF558545)接種剤(下記参照)
注:複数のデジタル顕微鏡が利用可能な場合は、より多くの植物を並行して接種できます。植物は、接種前に少なくとも3枚の完全に発達した葉を持っている必要があります(図1C)。PVYN-Wi は、ジャガイモのcv.ペントランドで乗算され、維持されます。- 接種のために、ジエチルジチオカルバミン酸ナトリウム(DIECA)を添加したリン酸緩衝液を調製します:1.3 mLの0.2 M NaH 2 PO 4、8.7 mLの0.2 M Na2HPO4、および0.225 gのDIECAを混合します。ddH20を使用して容量を100 mLに構成する。1 M NaOH または 1 M HCl 溶液を添加して pH を 7.6 に調整します。
- 生後6〜8週間のPVYN-Wi に感染したジャガイモのcvを収穫します。組織培養からペントランド植物をフィルターネット(6株あたり0.5g)で抽出バッグに入れ、DIECA(植物材料の4倍の質量、質量:体積比)を添加したリン酸緩衝液を添加します。ハンドホモジナイザーを1〜2分間使用して、均一な溶液を得ます。
- 生後3〜4週間のジャガイモ植物(ステップ1.6から)の最初の3つの底の完全に発達した葉にカーボランダムパウダーを軽くまぶします。
注意: カーボランダムパウダーの量を調整します。多すぎると損傷が発生し、少なすぎると感染が無効になる可能性があります。最適には、0.1 mg/cmのカーボランダム粉末が使用され、これは平均的なサイズ(約15 cm2)の葉あたり約1.5 mgの粉末です。 - 接種物(葉あたり~100μL)で葉をやさしくこすります。10分後、水道水で葉をよく洗います。
- 葉を傷つけないように注意してください。潜伏時間を超えないようにしてください。葉の大きさに応じて接種量を調整します-6.5μL / cm、これは平均サイズ(約15cm2)の葉あたり約100μLです。
- 植物を成長チャンバーに移し、制御された環境条件(光で28°C、暗所で28°C、相対湿度55%±5%、放射量250μmol/m2/s、日長16時間)で3日間栽培します。
3. 植物の調製と病変発生の記録のためのデジタルマイクロスコープの使用
- 接種した植物を、接種後3日後に28°Cに維持した成長チャンバーから22°Cの育成チャンバーに移し、ステップ1.5に記載した他の条件で移す。
- 観察する植物を選択します。2枚目の接種した葉をテープで固定します(図1D)。イメージングを開始する前に、目的の葉が完全に固定されていることを確認してください(図1D)。
- ラップトップコンピュータに画像キャプチャ用のソフトウェアアプリケーションをインストールします。デジタルマイクロスコープをコンピューターに接続します。ソフトウェアを開きます。
メモ: 植物、デジタル顕微鏡、およびラップトップが、コンピュータを接続するためのソケットの近くの棚に配置されていることを確認してください。モニターする葉の選択に関する決定は、研究された生物学的問題、例えば、限定的にプログラムされた細胞死の形成につながるプロセスの種類に依存する可能性があります。 - 固定された葉の上で顕微鏡を調整します。デジタルマイクロスコープのダイヤルを使用してピントを合わせます( 図1Eを参照)。
- 病変の形成を捉える可能性を高めるために、視線ができるだけ広く、病変の外観を見つけるのに十分な大きさであることを確認してください(通常、25倍の倍率が使用されます)。
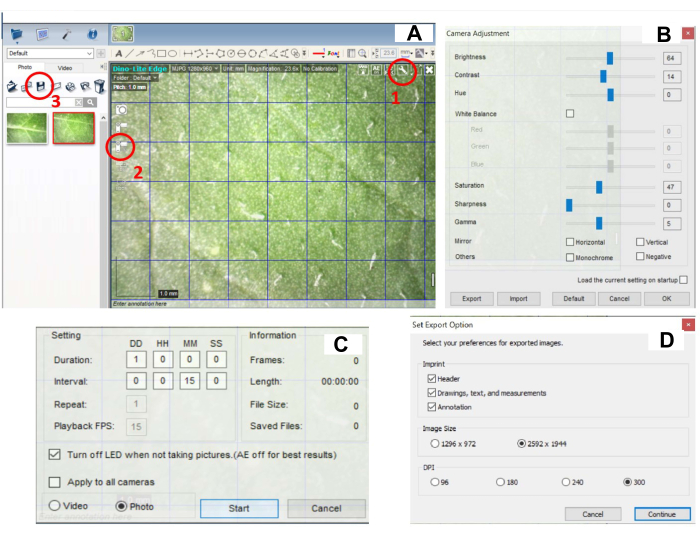
- カメラの設定を行います。画像の右上隅にある[設定]ボタン(図2A、丸で囲んだ部分1)をクリックし、カメラ設定を調整します:明るさ(60-70)、コントラスト(10-15)、色相(0)、ホワイトバランス、彩度(45-50)、シャープネス(0)、ガンマ(5)(図2B)。この調査で使用した設定は、明るさ (64)、コントラスト (14)、色相 (0)、彩度 (47)、シャープネス (0)、ガンマ (5) でした。
注意: 最高の画質を確保するために、カメラの設定を外光に合わせて調整する必要があります。設定は、成長チャンバー内のユーザーの条件に応じて調整できます。 - Image Capture(画像キャプチャ)のアイコンをクリックして、画像キャプチャ設定を行います(図2C、丸で囲んだ部分2)。[Time-Lapsed Video](タイムラプスビデオ)ボタンをクリックし、15分ごとに24時間画像キャプチャを設定します(図2C)。
注:撮影した画像と撮影時間の間の間隔は完全に柔軟であり、実験のニーズに応じて調整できます。撮影の合間には、LEDライトが消灯します。LEDライトは、画像撮影中に自動的に点灯します。 - STARTボタンをクリックして、画像キャプチャを開始します(図2C)。
注:28°Cから22°Cに移した後、植物は24時間以内に病変を発症し始めるはずです。そうでない場合は、効果のない予防接種の兆候である可能性があります。カーボランダム粉末の量を調整し、葉の接種インキュベーション時間が正しいことを確認し、qPCRによって接種中のウイルス量を測定します。 - 画像を保存するには、すべての画像を選択し、[ 保存 ]アイコンをクリックします(図2B、丸で囲んだ部分3)。 エクスポート オプションを設定します。DPIを最大(300)に設定します(図2D)。保存後、プログラム内のすべての画像を削除します。
- 画像解析には、画像を表示/編集するためのプログラムで十分です。画像編集用のフリーソフト「ImageJ」の使い方について、以下で説明します。
- 1 つの視野から画像の時系列をインポートします (左上隅の [ファイル] をクリックし、[ インポート] を選択してから [画像シーケンス] を選択します)。保存した画像のディレクトリのパスを貼り付け、[ OK ]ボタンを押して変換を開始します。
- 変換後、ソフトウェアは自動的に内部ビデオプレーヤーを開き、最終的なビデオを表示します。[ ファイル]>[名前を付けて保存 ]オプションをクリックし、[ AVI形式]を選択して、ビデオファイルをエクスポートします。小さなウィンドウが開きます。 フレームレート を0.3 fpsに設定し、[ OK ]を押してビデオをAVIビデオファイルとして保存します。
注:病変の発生時期は、すべての画像を手動でチェックし、病変が現れる画像を見つけることによっても決定できます。
結果
この研究は、ジャガイモのcvの病変発生による細胞死の開始を研究するための段階的なプロトコルを示しています。デジタル顕微鏡を持つライワル。これにより、プログラムされた細胞死開始の正確な時間を決定することができます。
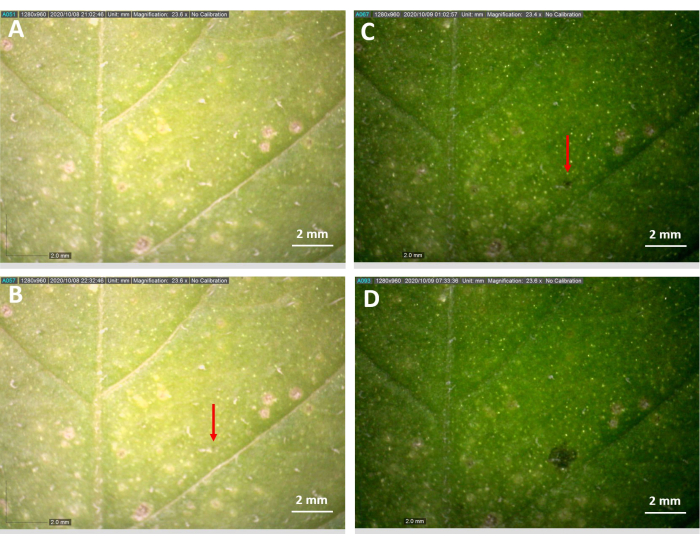
根を張った植物は、ジャガイモのcvの2週間後に土に入れました。Rywalマイクロプロパゲーション(図1A、B)。記載された条件下で3〜4週間成長した後、少なくとも3〜4枚の完全に発達した葉を持ち、健康そうで、脱落の兆候がないように見える植物をさらなる分析に使用しました(図1C)。このプロトコルに記載されているデジタル顕微鏡を使用して、接種した葉の同じ領域を15分間隔で観察し、病変の発生と時間の拡張を決定しました(図3)。病変は15時間30分に発生しました(図3)。

図1:デジタル顕微鏡で分析するための植物の準備 。 (A)MS 30培地とジャガイモのcvが入ったプラスチックの箱。ノードを含むRywal植物の外植片。(B)ジャガイモのcv。土壌中のライワル植物(マイクロプロパゲーション後2週間)。(C) ジャガイモ cv.接種の準備ができた(土に入れられてから4週間後)Rywal植物は、少なくとも3つの完全に発達した葉を持っています。(D)ジャガイモcvの2回目の接種葉(矢印)。ライワル工場はテープで位置決めされ、固定(矢印)されています。(E)デジタル顕微鏡の下に配置された植物で、矢印がピント合わせに使用されるダイヤルを指しています。 この図の拡大版をご覧になるには、ここをクリックしてください。

図2:病変の発生を記録するためのデジタルソフトウェア設定。 (A)ソフトウェアインターフェース - 赤丸で囲まれた部分は、(1)カメラ設定、(2)画像撮影設定、(3) 画像保存のボタンのオプションです。(B)パネルAの(1)をクリックすると開くカメラ設定のウィンドウ。 明るさ、コントラスト、彩度、シャープネス、ガンマを適切に調整する必要があります。(C)パネルAの(2)をクリックすると開く画像キャプチャ設定のウィンドウ。 (D)パネルAの(3)をクリックすると開く画像保存設定のウィンドウ。

図3:デジタル顕微鏡で観察した接種葉の病変形成。 PVY接種したジャガイモの葉の中央部をデジタル顕微鏡で見た倍率23.6倍の画像(5分間隔で撮影)。接種した植物を28°Cで3日間放置し、3日目は7:00に22°Cのデジタル顕微鏡による観察を開始しました。(A)21:02には病変はまだ見えず、(B)90分後の22:32には病変が見えます。(C)病変の拡大は01:02に、(D)翌朝07:32に観察された。実験を2回繰り返したところ、細胞死開始からそれぞれ8時間15分後と12時間後に病変が発生した。 この図の拡大版をご覧になるには、ここをクリックしてください。
ディスカッション
実証されたプロトコルにより、ユーザーは、デジタル顕微鏡を使用して細胞死の開始から細胞死の外観までの時間に接種された葉を連続的にイメージングすることにより、細胞死の開始率を正確に決定できます。病変や植物病害の発生をモニタリングする方法は数多くありますが12,13,14,15、このプロトコルは、測定と測定の間に光がオフになるため、植物の概日リズムを乱すことなく、光に依存しない測定という利点があります。
接種後、植物は28°Cで3日間成長するはずです。過敏反応を誘導する Ny-1 耐性遺伝子は温度依存的であり、高温で栽培された植物では、耐性の流産につながり、病変形成の欠如と全身性ウイルスの拡散として現れます3。植物を22°Cに移した後、細胞死が始まるため、正確な結果を得るには、この移し替え後できるだけ早くデジタル顕微鏡による観察を開始する必要があります。イメージングのための植物の準備におけるもう一つの重要なステップは、イメージング中に植物が成長し続けるため、観察された葉の焦点が合わなくなったり、そのようなセットアップでは望ましい結果が得られなかったりするため、葉の固定化です(図1D)。
記載されたプロトコルが、細胞死の開始に関与すると仮定された、関心のある成分が変更されたトランスジェニック植物で使用される場合、プロトコルは、研究された成分の減少レベルが細胞死開始の速度に影響を与えるかどうかをユーザーが決定することを可能にします。これにより、このプロトコルを使用して、プログラムされた細胞死が発生する病理系で細胞死の開始に関与する成分を同定できます。これらの成分を同定するための他の方法は、例えば、RNA-seqなどのトランスクリプトーム解析や、高価で時間のかかる様々な形態の顕微鏡検査である16。このプロトコルで記述されている方法はtransgenic植物と対照植物間の細胞死の開始率の相違の観察によって細胞死の開始にかかわる部品の容易で、安価な同一証明を可能にする。このようなセットアップでは、トランスジェニック植物を同じ実験内で対照植物と並行して分析する必要があるため、2台のデジタルカメラを使用するのが理想的です。
このプロトコルでは、PVY株N-Wilgaを使用しました。しかし、このウイルスの他の株、例えばGFPタグ付きPVY(PVY-N605(123)-GFP)7も使用することができる。さらに、プログラムされた細胞死発生をもたらす他の病理系は、このプロトコルを使用してわずかな修正で研究できます。
開示事項
著者らは、利益相反がないことを宣言します。
謝辞
Barbara Jaklič氏の技術支援に感謝します。本研究は、スロベニア研究イノベーション庁(研究コア資金番号P4-0165およびプロジェクトZ4-3217:ウイルスに対するジャガイモ耐性における酸化還元関連シグナル伝達の相互接続性の解読)の資金援助を受けました。
資料
| Name | Company | Catalog Number | Comments |
| Alcohol burner | Mikro+Polo | SH-234002455 | For tweezers and scalpel sterilization |
| Autoclave A-21 CAV | Kambi | N/A | |
| Bacto Agar | Becton, Dickinson and Company | 214010 | |
| Carborundum powder | VWR Chemicals | 22505297 | |
| DinoCapture 2.0 | Dino-Lite | Version 2.0 | software for digital microscope |
| Dino-Lite Edge AM7915MZTL digital microscope | AnMo Electronics Corporation | AM7915MZTL | |
| Ethanol, 70% | Stella Tech | P94000 | For tweezers and scalpel sterilization |
| Extraction bags | Bioreba | 420100 | |
| Growth chamber FS-WI | Photon Systems Insturments | N/A | |
| Hand homogenizer | Bioreba | 400010 | |
| Hawita Special Substrate | HAWITA Gruppe | 2000000071701 | Ready to use substrate, made using peat (H4-H6 and H6-H8) |
| Hydrochloric acid (HCl) | Merck | 109057 | |
| Label tape | Sigma | L8144-5EA | |
| Laptop computer with installed DinoCapture 2.0 | HP | Z2V77EA#BED | Computer needs to be transferable as experiment takes part in a growth chamber |
| Murashige and Skoog medium | Duchefa Biochemie | M02220100 | |
| Na2HPO4 | Emsure | 1065860500 | |
| NaH2PO4 | Emsure | 1064700250 | |
| Pasteur pipette 0.5 mL | Brand | 21500209 | |
| pH-meter | Mettler Toledo | ML1601 | |
| Plastic boxes | Cvetlice Dornig | VCG10.5 | Radius = 10.5 cm |
| Plastic pots | Lab Associates | DIS40003 | Radius = 11.5 cm (top), Radius = 9.8 cm (bottom) |
| Saccharose | Kemika d.d. | 1800408 | |
| Sodium Diethyldithiocarbamate (DIECA) | Sigma-Aldeich | 228680 | Sodium diethyldithiocarbamate trihydrate, ACS reagent |
| Sodium hydroxide (NaOH) | Merck | 106462 | |
| Sterile surgical blades | Braun | 4511733633 | |
| Tweezers | Braun | BD033R |
参考文献
- Karasev, A. V., Gray, S. M. Continuous and emerging challenges of potato virus y in potato. Annual Review of Phytopathology. 51, 571-586 (2013).
- Quenouille, J., Vassilakos, N., Moury, B. Potato virus Y: A major crop pathogen that has provided major insights into the evolution of viral pathogenicity. Molecular Plant Pathology. 14 (5), 439-452 (2013).
- Szajko, K., et al. The novel gene Ny-1 on potato chromosome IX confers hypersensitive resistance to Potato virus Y and is an alternative to Ry genes in potato breeding for PVY resistance. Theoretical and Applied Genetics. 116 (2), 297-303 (2008).
- Szajko, K., Strzelczyk-Żyta, D., Marczewski, W. Ny-1 and Ny-2 genes conferring hypersensitive response to potato virus Y (PVY) in cultivated potatoes: Mapping and marker-assisted selection validation for PVY resistance in potato breeding. Molecular Breeding. 34 (1), 267-271 (2014).
- Lukan, T., et al. Cell death is not sufficient for the restriction of potato virus Y spread in hypersensitive response-conferred resistance in potato. Frontiers in Plant Science. 9, 168 (2018).
- Baebler, &. #. 3. 5. 2. ;., et al. Salicylic acid is an indispensable component of the Ny-1 resistance-gene-mediated response against Potato virus y infection in potato. Journal of Experimental Botany. 65 (4), 1095-1109 (2014).
- Lukan, T., Coll, A., Baebler, &. #. 3. 5. 2. ;., Gruden, K. Analysis of virus spread around the cell death zone at spatiotemporal resolution using confocal microscopy. Methods in Molecular Biology. 2447, 261-270 (2022).
- Vinterhalter, D., Dragiüeviü, I., Vinterhalter, B. Potato in vitro culture techniques and biotechnology. Fruit, Vegetable and Cereal Science and Biotechnology. 2, 16-45 (2008).
- Wang, W., et al. Timing of plant immune responses by a central circadian regulator). Nature. 470, 110-115 (2011).
- Roden, L. C., Ingle, R. A. Lights, rhythms, infection: The role of light and the circadian clock in determining the outcome of plant-pathogen interactions. Plant Cell. 21 (9), 2546-2552 (2009).
- Srivastava, D., et al. Role of circadian rhythm in plant system: An update from development to stress response. Environmental and Experimental Botany. 162, 256-271 (2019).
- Mulaosmanovic, E., et al. High-throughput method for detection and quantification of lesions on leaf scale based on trypan blue staining and digital image analysis. Plant Methods. 16, 62 (2020).
- Martinelli, F., et al. Advanced methods of plant disease detection. A review. Agronomy for Sustainable Development. 35, 1-25 (2015).
- Ali, M., Bachik, N., Muhadi, N. A., Tuan Yusof, T. N., Gomes, C. Non-destructive techniques of detecting plant diseases: A review. Physiological and Molecular Plant Pathology. 108, 101426 (2019).
- Sankaran, S., Mishra, A., Ehsani, R., Davis, C. A review of advanced techniques for detecting plant diseases. Computers and Electronics in Agriculture. 72 (1), 1-13 (2010).
- Rowarth, N. M., et al. RNA-Seq analysis reveals potential regulators of programmed cell death and leaf remodelling in lace plant (Aponogeton madagascariensis). BMC Plant Biology. 21 (1), 375 (2021).
転載および許可
このJoVE論文のテキスト又は図を再利用するための許可を申請します
許可を申請さらに記事を探す
This article has been published
Video Coming Soon
Copyright © 2023 MyJoVE Corporation. All rights reserved