Method Article
生蛍光顕微鏡を用いたヒト結腸オルガノイドにおけるサイトカイン誘発性細胞死の定量化(英語)
要約
このプロトコールは、サイトカインなどの細胞傷害性摂動に応答してヒト結腸オルガノイドの細胞死を調査および定量するためのシンプルで費用対効果の高い方法について説明しています。このアプローチでは、蛍光細胞死色素(SYTOX Green Nucleic Acid Stain)、ライブ蛍光顕微鏡、およびオープンソースの画像解析ソフトウェアを使用して、細胞傷害性刺激に対する単一オルガノイドの応答を定量化します。
要約
腸管上皮細胞(IEC)死は、潰瘍性大腸炎(UC)やクローン病(CD)などの炎症性腸疾患(IBD)の患者で増加します。これは、腸のバリア機能の欠陥、炎症の悪化、および疾患の免疫病因の一因となる可能性があります。サイトカインと死受容体リガンドは、このIEC死の増加に部分的に関与しています。TNF-αやIFN-γなどのIBD関連サイトカインは、単独でも組み合わせてもIECに対して細胞毒性があります。このプロトコールは、蛍光細胞死色素(SYTOX Green Nucleic Acid Stain)、ライブ蛍光顕微鏡、およびオープンソースの画像解析ソフトウェアを使用して、CD患者由来結腸オルガノイドのサイトカイン誘発性細胞毒性を定量するためのシンプルで実用的なアッセイについて説明しています。また、Bliss独立性数理モデルを使用して、オルガノイドの細胞毒性に基づく摂動相互作用係数(CPI)を計算する方法も示します。CPIは、サイトカインの組み合わせまたは他のタイプの摂動との間の相互作用が拮抗的、相加的、または相乗的であるかどうかを判断するために使用できます。このプロトコールは、患者由来の結腸オルガノイドを使用して、サイトカインおよびその他の摂動物の細胞毒性活性を調査するために実施できます。
概要
腸上皮は、腸内腔の内容物とその下にある組織との間に物理的な半透性の障壁を作り出します。このバリアを効果的に維持するために、腸管上皮細胞(IEC)は非常に高い細胞代謝回転を経験し、細胞死と再生の継続的なサイクルを伴います。しかし、炎症性腸疾患(IBD)などの炎症性疾患では、異常な細胞死が高レベルに発生します1。これにより、バリア機能の破壊と免疫系の活性化が促進され、さらなる炎症を引き起こす可能性があります。IBDの一種であるクローン病(CD)では、サイトカインシグナル伝達がIEC死のレベル上昇に寄与することが示されています2。サイトカインシグナル伝達がIECの細胞死をどのように誘導するかを研究することにより、IBDやその他の腸内炎症性疾患の患者に対して改善された治療法を開発できることが期待されています1。
生物学や創薬標的研究において、シナジーは、個々の刺激の組み合わせで処理された生物学的システムが、単一の刺激のみの組み合わせによる相加効果よりも大きな反応を示す場合に発生すると一般に理解されています。サイトカイン間の相乗的相互作用は、自然抗ウイルス反応の促進において十分に実証されています3。サイトカインは、IECsを含む相乗的に細胞死を誘導することも知られています4。しかし、相乗的な細胞傷害性サイトカインシグナル伝達がIBDなどの腸内炎症性疾患で果たす役割は十分に研究されていません。
ヒト腸管オルガノイドは、腸管上皮幹細胞から作製されたin vitroで作製された3次元微小組織です。腸管オルガノイドは、IBD患者から採取した腸粘膜生検から増殖させることができ、この疾患の多くの特徴を保持しています5,6。オルガノイドは、腸の炎症の状況でサイトカイン細胞毒性を研究するための理想的なモデルシステムであることが証明されています7,8。これまで、当グループでは、CD患者由来結腸オルガノイド(コロノイド)におけるIBD関連サイトカインIFN-γおよびTNF-αの相乗的殺傷効果を特徴づけてきました9,10。しかし、この形態の相乗的細胞死の媒介に関与する正確なメカニズムは、依然としてとらえどころのないままです。また、腸の炎症性疾患に関連する、特徴付けられていない細胞傷害性サイトカイン相互作用がさらに多く存在する可能性があります。
腸オルガノイド10,11,12,13の細胞死を研究するために、いくつかのプロトコルが利用可能です。ただし、それぞれに欠点があります。これらの技術の中には、細胞生存率を測定するだけで細胞死を直接測定しないもの、単一オルガノイドの応答を評価することができないもの、高価な機器や複雑なプロトコルを必要とするものがあります。腸管オルガノイドにおけるオルガノイド細胞死と相互作用の摂動を定量化するためには、堅牢でわかりやすい方法論が必要です。私たちが提示するプロトコルは、細胞傷害性サイトカインに対する単一オルガノイド応答を測定するためのシンプルで安価なアプローチですが、あらゆるタイプの刺激や摂動に使用できます。また、Bliss独立性シナジーモデルを使用して、細胞傷害性サイトカイン相互作用を記述する摂動相互作用係数(CPI)を計算する方法も示します。
プロトコル
結腸粘膜生検は、標準治療の一環として定期的な大腸内視鏡検査を受けているCD患者から採取されました。患者組織サンプルの使用とこれらのサンプルからの結腸オルガノイドラインの生成に関する倫理的承認は、コーク教育病院の臨床研究倫理委員会(CREC)から取得されました。書面によるインフォームドコンセントは、ヘルシンキ宣言に同意してすべての患者から得られました。患者の生検とコロノイドを伴うすべての組織培養作業は、BSL2安全プロトコルに従ってバイオセーフティキャビネット内で行う必要があります。使用する前に、すべてのプラスチック摩耗が滅菌されていることを確認してください。このプロトコールで使用されるすべての材料、試薬、機器、およびソフトウェアに関連する詳細については、 材料表 を参照してください。
私たちのグループが陰窩単離とオルガノイド培養に使用するプロトコルは、確立された方法14,15,16から適応され、以前に発表されました9,10,17。以下のプロトコルでは、オルガノイド増殖培地を使用してコロノイドを培養しました(表1)。オルガノイド増殖培地を使用して増殖したコロノイドは未分化であり、結腸幹細胞に濃縮されています。オルガノイド増殖培地の主成分は、腸管幹細胞ニッチ成長因子Wnt-3A(W)、R-spondin 3(R)、およびNoggin(N)15を含む50%L-WRNコンディショニング培地です。オルガノイド増殖培地は、L-WRN馴化培地と無血清培地を1:1で組み合わせ、その後ニコチンアミドと化学阻害剤を補給することで調製します(表1)。
1.結腸陰窩の分離とコロノイド培養
- 48ウェルマイクロタイタープレートを37°C、5%CO2 で最低72時間プレイインキュベートしてから、陰窩で播種します。
注:プレートを事前にインキュベートすると、播種中の基底膜抽出物(BME)の重合が促進されます。 - 地下室の分離の前夜に、BMEを4°Cの氷上で解凍します。
- 結腸生検を15 mLの生検採取培地(表1)が入ったサンプル採取チューブに集め、処理の準備ができるまで4°Cで保存します。
- ピペットを使用して、できるだけ多くの生検採取培地を慎重に取り出します。2.5 μg/mL のアムホテリシン B と 100 μg/mL のゲンタマイシンを添加した氷冷 DPBS 15 mL をサンプルチューブに追加して、生検を洗浄します。サンプルチューブを激しく振って、生検から粘液や破片を解離させます。生検を重力で落ち着かせ、ピペットを使用してできるだけ多くのDPBSを慎重に除去します。
- ステップ1.4の洗浄手順を2回(2回)繰り返します。
- 2.5 μg/mL のアムホテリシン B と 200 μg/mL のゲンタマイシンを添加した 10 mL の酵素フリー細胞解離試薬をサンプルチューブに加え、室温で 15 分間インキュベートし、30 rpm でロッキングします。
- インキュベーション後、サンプルチューブを手で左右に激しく振って、結腸陰窩を解放します。低倍率の光学顕微鏡を使用してチューブを検査し、放出された陰窩と懸濁中の陰窩の断片を探します。見えない場合は、チューブを振って再度確認してください。陰窩が吊り下げられているのが見えるまで繰り返します。
- 70 μmのセルストレーナを50 mLのチューブに取り付け、クリプト懸濁液をストレーナーでろ過します。氷冷したオルガノイド洗浄培地10 mL(表1)を空のサンプルチューブに加え、培地を取り出して細胞ストレーナーに通します。
- ろ過した陰窩を2本の15 mLチューブ(チューブあたり10 mL)に移し、4°Cで150 × gで5分間遠心分離します。
- 各15 mLチューブから上清を慎重に取り除き、クリプトペレットを500 μLの氷冷オルガノイド洗浄培地に再懸濁し、両方の15 mLチューブからクリプト溶液を1本の1.5 mLマイクロ遠心チューブに移し、4°Cで400 × gで3分間遠心分離します。
- 微量遠心チューブから上清を慎重に取り除き、クリプトペレットを70 μLのBME(ウェルあたり20 μL、10 μLの追加デッドボリューム)に再懸濁します。
- インキュベート済みの48ウェルプレート(ステップ1.1)を使用して、20 μLのBME/クリプト懸濁液を各ウェルの中央に播種します(ウェルあたり1つのBMEドーム)。プレートをスムーズかつ着実に反転させ、37°C、5%CO2 で20分間インキュベートします。
注:プレートを反転させることで、細胞がウェルのプラスチック表面に付着するのを防ぎ、BME内での細胞の分布を確保します。 - インキュベーターからプレートを取り外します。BMEが完全に重合したことを確認してから、350 μLの予熱したオルガノイド増殖培地に100 μg/mLの広範囲の抗菌試薬を添加してドームをオーバーレイします。プレートを37°C、5%CO2でインキュベートします。
注:広範囲の抗菌試薬は、結腸生検に関連する粘膜微生物からの汚染を防ぐためのものです。これは、陰窩の分離後の培養の最初の週にのみ必要です。 - 培地を1週間に2〜3回交換し、温めたオルガノイド増殖培地を使用し、培養の最初の1週間は広範囲の抗菌試薬を補充します。この期間が経過したら、試薬を取り出します。
- コロノイド培養が完全に確立されたら(単離後1〜2週間)、10 μMのROCK-I/II阻害剤Y-27632を添加した酵素解離試薬を使用してコロノイドを解離します(コロノイド解離の詳細についてはセクション2を参照)。
注:最初の2つのパッセージ(P0-1、P1-2)では、コロノイドは1:1/2の比率を使用して拡張する必要があります。P2の後、コロノイドは1:3/4の比率を使用して継代することができます。 - 手順1.11-1.13に従ってコロノイドを播種し、維持します(オルガノイド増殖培地に広範囲の抗菌試薬を添加しないでください)。
2. 細胞死アッセイのための大腸系化合物の調製
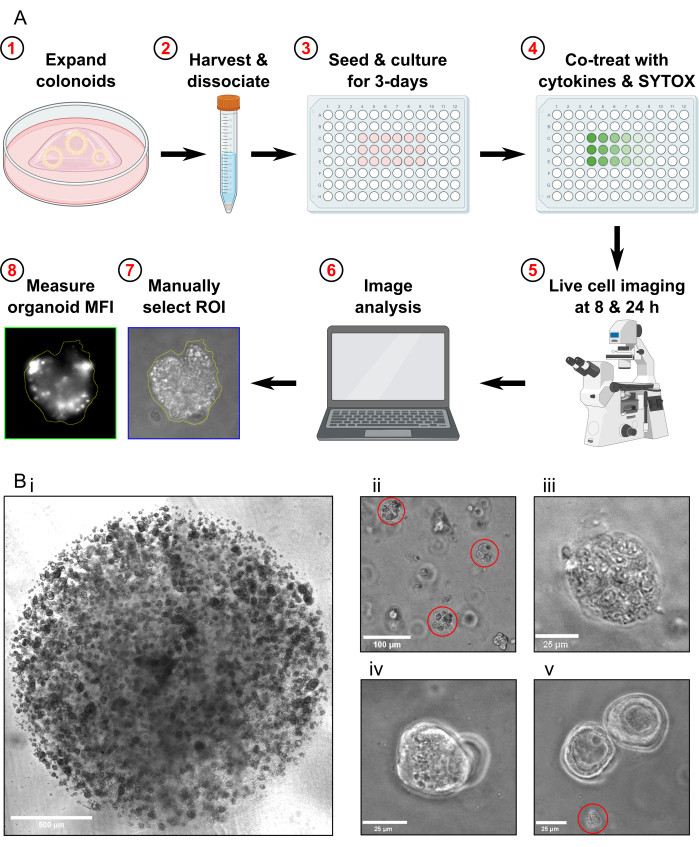
注:細胞死アッセイプロトコルは、完了するまでに4日かかります(図1A)。
- 48ウェルプレートフォーマットを使用してコロノイドを拡大し、ウェルあたり20μLのBME/陰窩懸濁液を播種し、37°C、5%CO2でインキュベートし、培地を週に2〜3回(ウェルあたり350μL)交換します。
- 細胞死アッセイのために、回収の約1週間前に結腸を通過させます。コロノイドを回収する前に、コロノイドが高密度に増殖していること(図1Bi)、直径が約25〜50μmであること、および活発に増殖していることを確認してください。
注:このアッセイには、継代3から継代14までコロノイドを使用し、一貫した結果が得られました。しかし、サイトカインに対するコロノイドの転写応答は、培養期間によって変化する可能性があることが実証されています18。これに基づいて、15番通過後、このアッセイにはコロンイドを使用しないことをお勧めします。 - 96ウェルマイクロタイタープレートを37°C、5%CO2 で最低72時間プレイインキュベートしてから、コロノイド細胞を播種します。
- 実験開始の前夜に、BMEを氷上で4°Cで解凍します。
- 十分な量の酵素解離試薬(コロノイドのウェルあたり500 μL)を調製し、10 μMのROCK-I/II阻害剤Y-27632を補給します。コロノイドを含むウェルから培地を静かに取り出します。コロノイドドームの損傷を避けるために、井戸の端からピペットで動かします。各ウェルに300 μLの酵素解離試薬を添加します。
- ウェルごとに、P1000ピペットの先端でウェルの表面をこすり、細胞懸濁液を上下にピペッティングして、コロノイドドームを分解します。気泡が発生しないようにしてください。細胞懸濁液を15mLのチューブに集めます。
注:この15mLチューブは、48ウェルプレートの10ウェルからコロノイドを収集するために使用されます。 - 同じウェルを別の200 μLの酵素解離試薬で洗浄し、すべてのコロノイド材料が収集され、同じ15 mLチューブに移されることを確認します。このプロセスを、回収する拡張コロノイドの各ウェルに対して繰り返し、それらを同じ単一の15 mLチューブに回収します。
注:効率的な解離のために、チューブごとに最大10ウェルのコロノイドを収集する必要があります。>10ウェルを採取する場合は、採取したコロノイドを複数の15mLチューブに均等に分割します。
- ウェルごとに、P1000ピペットの先端でウェルの表面をこすり、細胞懸濁液を上下にピペッティングして、コロノイドドームを分解します。気泡が発生しないようにしてください。細胞懸濁液を15mLのチューブに集めます。
- ステップ 2.5.2 で採取したコロノイドを含む 15 mL チューブを、37 °C の水浴で 5 分間インキュベートします。インキュベーション後、チューブを400 × gで3分間遠心分離します。上清を静かに取り除き、チューブ内に約1.2 mLを残します。
注:次のステップでは、迅速なピペッティングを使用してコロノイドを物理的に解離する必要があります。これを効果的に行うには、チューブ内に少量の細胞懸濁液が必要です - この目的には、15mLのチューブに残っている1.2mLで十分です。 - コロノイドペレットを残りの1.2 mLの酵素解離試薬に再懸濁します。1,000 μLに設定したP1000ピペットを使用して、ピペットの先端を懸濁液に入れ、15 mLチューブの底のすぐ上に保持してから、懸濁液をチップにすばやく出し入れします。すばやくピペットで移動するには、プランジャーボタンを最初のストップまですばやく押し、ボタンが上位置の約半分になるまでボタンを離して、繰り返します。約10秒間(30〜40回の窪み)迅速にピペットで移動し、懸濁液を完全に再懸濁してピペッティングを繰り返します。2〜3ラウンドのラピッドピペッティングを行います。
- 顕微鏡でサンプルをチェックし、コロノイド全体が残っていないこと、およびコロノイドフラグメントの大部分のサイズが約30〜40μmであることを確認します(図1Bii)。
- サンプルをさらに解離する必要がある場合は、37°Cのウォーターバスでさらに3分間インキュベートし、ステップ2.7のピペッティング技術を繰り返して、顕微鏡でサンプルを確認します。コロノイドフラグメントの大部分が最適なサイズになるまで、このプロセスを繰り返します。
注:コロノイドを解離しすぎると、過剰な細胞死、低いめっき効率、および小さすぎるコロノイドにつながるため、注意してください。 - 10 mLの氷冷オルガノイド洗浄培地(表1)を15 mLチューブに加えます。チューブを400 × gで3分間遠心分離し、上清を取り除き、氷冷したオルガノイド洗浄培地1 mLに再懸濁し、1.5 mLの微量遠心チューブ( コロノイドフラグメントチューブと呼ばれる)に移します。
- ピペッティングで コロノイドフラグメントチューブ の内容物を混合し、50 μLのサンプルを採取します。この50 μLサンプルを新しい1.5 mL微量遠心チューブ( セルカウントチューブと呼びます)に移します。この時点からステップ2.15の完了まで、 コロノイドフラグメントチューブ を氷上に保管します。
- 細胞カウントチューブを400 × gで3分間遠心分離し、上清を除去し、10 μMのROCK-I/II阻害剤Y-27632を添加した500 μLの酵素解離試薬に再懸濁します。
- シングル セルカウントチューブ をウォーターバス中で37°Cで5分間インキュベートします。400 μLに設定したP1000ピペットを使用して、ステップ2.7の説明に従ってサンプルをピペットで移動し、顕微鏡でサンプルをチェックして、単一細胞懸濁液があることを確認します。そうでない場合は、コロノイドが単一細胞懸濁液に完全に解離するまで、このプロセスを繰り返します。
- 1 mLのオルガノイド洗浄培地をシングル セルカウントチューブに加え、400 × g で3分間遠心分離し、上清を慎重に取り除きます。細胞を50 μLのオルガノイド洗浄培地に再懸濁し、次に50 μLのトリパンブルーを加えます。
- 血球計算盤を使用して細胞をカウントします。50 μL サンプル中の細胞数を計算し、これを使用して コロノイドフラグメントチューブ内の細胞濃度を計算します。
- 96ウェルマイクロタイタープレートのウェルごとに0.5×10個の4コロイド細胞を播種する実験に必要な細胞懸濁液の量を計算します。この計算されたボリュームに約15%の追加で、デッドボリュームを考慮します。この総量を コロノイドフラグメントチューブ (ステップ2.11)から新しい1.5 mL微量遠心チューブに移します。
- コロノイドフラグメントを含む新しい1.5 mL微量遠心チューブを400 × gで3分間遠心分離し、上清を除去し、BMEに再懸濁します(0.5 × 10⁴細胞あたり10 μLのBMEを使用します)。
注:BME(高粘度、温度依存性重合)の物理的特性により、ピペッティング(デッドボリューム)によってかなりの量の材料が失われる可能性があります。
- コロノイドフラグメントを含む新しい1.5 mL微量遠心チューブを400 × gで3分間遠心分離し、上清を除去し、BMEに再懸濁します(0.5 × 10⁴細胞あたり10 μLのBMEを使用します)。
- 氷上にコロノイド/BME懸濁液を含むチューブまたはリザーバーをバイオセーフティキャビネット内の滅菌容器に設置します。
注:播種中に細胞を氷上に保つことで、細胞基質が早期に重合するのを防ぐことができます。 - インキュベート済みの96ウェルマイクロタイタープレート(ステップ2.3から)を使用して、1ウェルあたり10 μLのコロノイド/BME溶液をリバースピペットで分注します。ウェルの壁にぶつからないように、チップをウェルの表面のすぐ上に配置し、ピペットで中央にピペットで固定してください。コロノイド/ BME懸濁液を定期的に混合して、不均一な播種を防ぎます。
注:マイクロタイタープレートの外縁ウェルにコロノイドを播種しないでください。- リバースピペットを打つには:
- ピペットをセットし、プランジャーボタンを押して最初のストップを過ぎて2番目のストップまで押します。
- この位置を保持したまま、先端をコロンイド/ BME懸濁液に浸し、プランジャーをゆっくりと上部に放します。
- プランジャーボタンを静かに着実に押して最初の停止までサスペンションを分配します。より多くのウェルを播種する場合は、この位置を保持して、手順2.18.1.2-2.18.1.3を繰り返します。
- 終了したら、プランジャーボタンを押して2番目のストップまで押して、わずかに残ったサスペンションを排出します。
注:BMEの粘度が高いため、リバースピペッティング技術の使用をお勧めします。
- リバースピペットを打つには:
- プレートをスムーズかつ着実に反転させ、37°C、5%CO2 で20分間インキュベートします。
- インキュベーターからプレートを取り外します。BMEが完全に重合したことを確認してから、200 μLの予熱したオルガノイド増殖培地をドームに重ねます。周囲の堀(蒸発を抑える)を備えた96ウェルマイクロタイタープレートを使用する場合は、各リザーバーに2 mLのオルガノイド洗浄培地を満たします。
- コロノイドを37°C、5%CO2 で3日間インキュベートし、1日1回顕微鏡で検査して、コロノイドが回復して増殖していることを確認します。
3. 細胞死アッセイのためのコロノイド治療
- 蛍光細胞死色素(SYTOX Green Nucleic Acid Stain)とDMSO溶液の2.5 μM溶液を調製し、予熱したオルガノイド増殖培地に蛍光細胞死色素またはDMSOを添加します(表2)。
注:蛍光細胞死色素ストックおよび希釈溶液を光から保護してください。SYTOX Green Nucleic Acid StainはDMSOに可溶化されます。DMSO溶液は、溶媒の影響を制御するための染料なし条件を準備するために使用されます。 - 表 2に示すように、ステップ3.1の蛍光細胞死色素とDMSO溶液の2.5μM溶液を使用して、治療を調製します。
- コロノイドを播種した96ウェルマイクロタイタープレートから培地を静かに取り出します。プレートを傾けてウェルの端からピペッティングします。次に、ウェルあたり200μLの処理培地を添加します。最大毒性条件に対して、追加のPBS/BSAコントロールウェルを必ず用意してください(プレートマップの 表2を参照)。
- イメージングの準備が整うまで、コロノイドを37°C、5%CO2 で必要な処理時間だけインキュベートします。
- イメージングの少なくとも2時間前に、Triton-X 100の10%v/v溶液を滅菌細胞培養グレードの水で調製し、イメージング前に22μLの10%Triton-X 100をコントロールウェルの培地に直接加え、最大毒性条件で最終濃度1% v/v 1時間にします。
注:10%溶液を使用すると、界面活性剤の高粘度によるピペッティングエラーが減少します。
4. 画像取得
- コロノイドを播種した96ウェルマイクロタイタープレートをインキュベーターから取り出し、デジタル倒立脱蛍光顕微鏡のステージに移します。プレートを室温に戻します。
- 顕微鏡で調べて、Max Toxicity状態のコロノイドが完全に溶解していることを確認します(図1Biii)。
- 長作動距離の40倍蛍光対物レンズなど、適切な対物レンズを選択します。始める前に、顕微鏡のイメージング設定を最適化してください。
- 伝達チャネルを使用して、SYTOX陽性細胞を持つコロノイドに焦点を当て、緑色蛍光タンパク質(GFP)に切り替えます
チャネル(488 nm)で、光の強度と露光時間を調整して、バックグラウンドを最小限に抑えながら蛍光シグナルを最大化します。まず、光の強度を低くしてから、露光時間を徐々に増やします。露光時間が実用的でない場合は、光の強度を少し上げます。
注:光強度の代わりに露光時間を長くすると、サンプルの光毒性と光退色が減少します19。サンプルを蛍光灯にさらすのは、必要なときだけにしてください。
- 伝達チャネルを使用して、SYTOX陽性細胞を持つコロノイドに焦点を当て、緑色蛍光タンパク質(GFP)に切り替えます
- GFPチャンネルに最適化されたイメージング設定を使用して、No DyeおよびMax Toxicityの条件を観察し、サンプルが過剰または過小に露光されていないことを確認します。確定したら、条件間でイメージング設定を一定に保ちます。
- ランダムサンプリングアプローチを使用して画像を取得する:これを行うには、コロノイドドームを覆う固定グリッドパターンに従う視野(FOV)を選択します。最小 10 個の FOV からコロンイドの画像を取得します。コロノイドの中心面にピントが合っていることを確認し、透過チャネルとGFPチャネルの両方で画像を取得します。
- 次の除外条件を適用します。
- FOVにコロンイドが存在しない場合は、画像を取得しないでください。
- FOVに存在する同じ焦点面に重なり合っているコロンイドのみがある場合は、画像を取得しないでください(図1、Biv)。
- FOVにコロノイドの破片しかない場合は、画像を取得しないでください(図1Bv)。コロノイドの破片を解析に含めないでください。
- 次の除外条件を適用します。
- 画像をポータブルネットワークグラフィック形式で保存し、エクスポートします。
- 追加のタイムポイントをイメージングする場合は、コロノイドを添加した96ウェルマイクロタイタープレートを37°C、5%CO2のインキュベーターに戻します。
5. 画像解析
- Fiji ImageJを開き、ファイルをImageJツールバーにドラッグアンドドロップするか、[ ファイル]|ファイルを開いて 選択します。開いたら、画像 |スタック|スタックする画像。画像スタックを8ビットファイル形式に変換するには、[ 画像]|タイプ|8 ビット。
- 画像セットごとに、ImageJ ツールバーの [フリーハンド選択 ] ツールをクリックし、コンピューターのマウスを使用して伝送画像の関心領域 (ROI) を手動で選択します。ROIはコロノイドの周囲長です。次に、画像スタックを対応するGFPチャネル画像に切り替えます。
- [分析] |測定値を設定します。[Set Measurements]ダイアログウィンドウで、[Mean Grey Value]にチェックマークを付け、他のすべてのボックスはオフのままにします。GFP 画像を選択した状態で、[分析] |測定します。イメージ スタック内のすべてのコロノイドに対して、この分析を繰り返します。データセットが分析されたら、[結果] ウィンドウのすべてのデータをコピーして、スプレッドシート ソフトウェア アプリケーションに貼り付けます。
6.最大毒性の%計算
- 式 (1) を使用して、各条件のテクニカル レプリケート平均グレー値 (MGV) の平均を計算します。
 (治療平均A)=
  (1)
(1) - 式 (2) を使用して、各条件の平均を Max Toxicity 条件 (MT) の平均に対するパーセンテージで表します。
%MTa = (2)
(2)
7. 消費者物価指数の算出
- ステップ6.1で計算した平均値を用いて、各治療条件から未治療状態(UT)と最大毒性(MT)条件の平均を差し引く(サイトカイン処理とは無関係に発生するバックグラウンド細胞死を除去するため)ことにより、以下のようにデータを正規化(NORM)します。次に、式(3)に示すように、各治療条件を最大毒性(MT)条件のバックグラウンド減算平均で除算します。
ノルムa = (3)
(3) - ステップ 7.1 で計算した正規化値を 1 から減算します。結果の値は、処理後の細胞生存率(V)を表します(以下の式(4)を参照)。
Va = 1 −NORMa (4) - 式 (5) を使用して摂動相互作用係数 (CPI) を計算します。
CPI= (5)
(5)
ここで、aは最初の治療を示します。b は 2 番目の処理を示します。そしてABは併用療法です。CPI値は、相乗的(<1)、相加的(=1)、または拮抗的(>1)の関係を示します。
結果
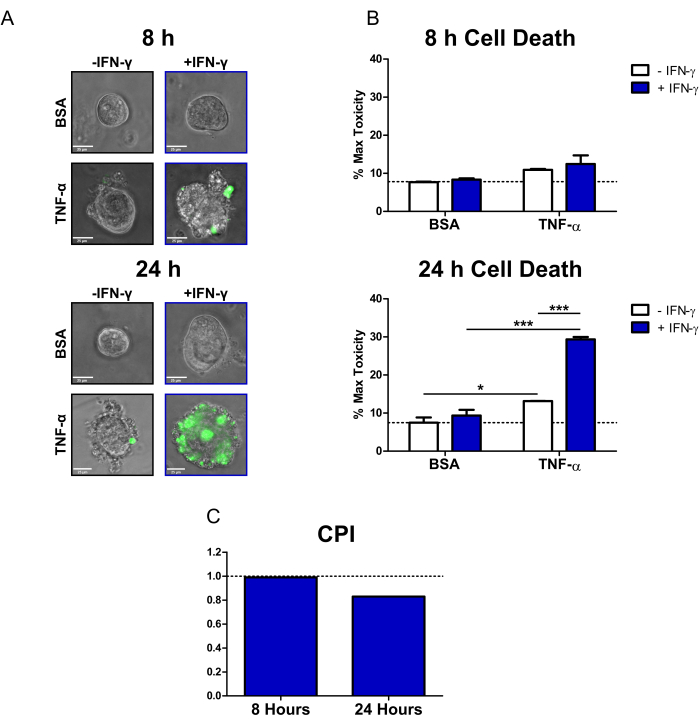
このプロトコルを使用して、CD患者コロノイドを使用して、IBD関連サイトカインIFN-γおよびTNF-αの一次上皮に対する細胞毒性効果を研究する方法を示しました。市販の蛍光細胞死色素(SYTOX Green Nucleic Acid Stain)を使用しましたが、これは細胞膜が損なわれた細胞にのみ侵入でき、そこで核酸に結合して活性化されます。サイトカインと蛍光細胞死色素でコロノイドを共処理し、倒立脱射顕微鏡を用いて8時間および24時間でライブセルイメージングを行いました。8時間での代表的な透過/蛍光オーバーレイ画像は、IFN-γ + TNF-α処理されたコロノイドのみが蛍光シグナルに対して陽性であることを示しています。ただし、蛍光細胞はごくわずかです(図2A)。細胞死20の形態学的指標である細胞ブレブは、IFN-γ+TNF-α条件でも観察され得る。24時間後、IFN-γ + TNF-αで処理したコロノイドは、蛍光シグナルに対して陽性の大きな領域を示します(図2A)。また、コロノイドの形態にも明らかな崩壊があり、中央の内腔が見えなくなり、上皮関門が完全に破壊されています。
細胞死色素のシグナルを定量化するために、オープンソースの画像解析ソフトウェアを使用して、各コロイドの蛍光強度を計算しました。次に、各状態の平均をMax Toxicity治療の割合として表すことにより、データを正規化しました。8時間後、BSAコントロールコロノイドにおける恒常性細胞死またはバックグラウンド細胞死は比較的低かった(最大毒性の7.7%)(図2B)。この時点では、細胞死レベルに統計的に有意な変化はありませんでした。ただし、TNF-αで治療された状態では、細胞毒性がわずかに増加しました(図2B)。24時間後、すべてのサイトカイン治療条件で細胞死レベルが上昇しました。しかし、BSAコントロール条件の細胞死の変化は、時点間では最小限でした(24時間での最大毒性の7.5%)。IFN-γ + TNF-αで治療されたコロノイドは、BSAコントロールと比較して細胞死レベルが最も増加しました(Max Toxicityの29.4%)。併用療法と単一サイトカイン療法(IFN-γ、TNF-α)の細胞死レベルの差は非常に有意でした。これらの結果は、24時間後にIFN-γとTNF-αとの間に細胞傷害性相乗的相互作用が生じる可能性を示唆しています。
CPIを使用して、サイトカイン処理間の細胞傷害性相互作用を定量化し、それらが相乗的であるかどうかを判断しました。サイトカイン間の相互作用は、CPI値が<1のときに相乗的、=1のときに相加的、>1のときに拮抗的であると考えられます。時点ごとのCPI値を計算しました(図2C)。8時間では、CPI値はわずかな相乗効果(0.99)を示し、CPI値は24時間(0.83)で大幅に減少しました。この解析により、24時間でのIFN-γとTNF-αの相互作用が相乗的であることが確認されました。さらに、この文脈では、IFN-γとTNF-αの間の相乗効果が時間依存性であることを示しています。

図1:実験ワークフローとトラブルシューティングの概略図(A)プロトコルの概略図の概要。(B)代表的な画像。(ビ)アッセイのための継代前の培養物の最適な密度とコロノイドの最適なサイズを示す光学顕微鏡画像。スケールバー=500μm.(Bii)解離後のコロノイド断片の最適なサイズを示す光学顕微鏡画像;フラグメントは赤で強調表示されています。スケールバー = 100 μm. (Biii) MT治療後の壊死性大腸体形態の光学顕微鏡画像(Triton X-100を使用)。スケールバー = 25 μm. (Biv) 同じ焦点面に重なり合う2つの大腸の光学顕微鏡画像。スケールバー = 25 μm. (Bv) 継代後に存在する大腸細胞の破片の光学顕微鏡画像;破片は赤で強調表示されています。スケールバー = 25 μm。略語: ROI = 関心領域;MFI = 平均蛍光強度;MT = 最大毒性。この図の拡大版を表示するには、ここをクリックしてください。

図2:ヒトCDコロノイドにおけるサイトカイン誘発性細胞死の定量分析。 (A)SYTOX Green Nucleic Acid Stain(蛍光細胞死色素)およびサイトカインで処理したCDコロノイドの代表的なライブ顕微鏡画像(8時間および24時間)。透過チャネルとGFP(緑色)チャネルがオーバーレイされています。コロノイドは次のように治療されました:1)PBS/BSA、2)10 ng/mL IFN-γ、3)10 ng/mL TNF-α、4)10 ng/mL IFN-γ + 10 ng/mL TNF-α。スケールバー= 25μm.(B)8時間および24時間で蛍光細胞死色素およびサイトカインで処理したCDコロノイドの定量分析;データは MT 条件の % で表されます。N = 2 CD コロノイド ライン、条件ごとに 11 から 16 のコロノイドが画像化されます。(C) B、N = 2 CDコロノイドラインのデータセットを使用して時点ごとに計算されたCPI。データは平均±SEで表されます。 Bでは、双方向ANOVA分析が実行され、続いてBonferroniの事後検定が実行され、*P < 0.05、***P < 0.001が示されました。略語:CD =クローン病;GFP = 緑色蛍光タンパク質;CPI = 摂動相互作用の係数PBS = リン酸緩衝生理食塩水;BSA = ウシ血清アルブミン;TNF-α = 腫瘍壊死因子-アルファ;IFN-γ = インターフェロン-ガンマ;MT = 最大毒性。 この図の拡大版を表示するには、ここをクリックしてください。
表1:プロトコール用の培地の組成。 オルガノイド増殖培地を調製するには、L-WRN馴化培地と無血清培地を1:1で組み合わせ、サプリメントを添加します。オルガノイド増殖培地は、調製後2週間以内に使用する必要があります。すべての完全なメディアは4°Cで保存する必要があります。 この表をダウンロードするには、ここをクリックしてください。
表2:実験的な96ウェルプレートレイアウトとサイトカイン処理。この表をダウンロードするには、ここをクリックしてください。
ディスカッション
腸管オルガノイドの細胞死を定量的に解析するために、いくつかの方法が開発されています。光学顕微鏡法による腸管オルガノイド形態の乱れを調べることは、細胞毒性物質の影響を定量化するための直接的なアプローチである11。しかし、形態学的変化は細胞死の直接的な測定ではなく、この方法は半定量的なものにすぎません。別の方法は、MTTまたはATPアッセイ10,11を用いてオルガノイド代謝活性を評価することである。これらのアッセイは細胞生存率の変化のみを測定でき、細胞死アッセイで検証する必要があることに注意することが重要です。DNA結合色素を用いた他の蛍光細胞死アッセイが報告されています12,13。蛍光マイクロプレートリーダーを用いたノンイメージングアプローチが可能であり、ハイスループット12を可能にする。ただし、この方法ではウェル全体の平均シグナルを測定するため、不均一な集団には適していません。また、Z高さ調整機能付きのマイクロプレートリーダーを使用する必要があります。蛍光イメージングベースの技術は、単一オルガノイド分析に使用でき、細胞/細胞内および形態学的データを取得できます。自動共焦点ハイコンテントイメージング(HCI)システムは、ハイスループットで大量のデータを生成できます13。残念ながら、共焦点HCIには特殊な機器が必要であり、複雑なプロトコルを使用し、通常は市販の画像解析ソフトウェアが必要であり、高価です。
複数の時点でのコロノイド細胞死の定量分析のための当社のプロトコルは、簡単で、シンプルで、安価です。しかし、自動化されたHCIやプレートリーダーシステムと比較すると、時間がかかり、スループットが低下します。私たちの方法のもう一つの制限は、共焦点顕微鏡法とは対照的に広視野を使用することです。共焦点顕微鏡は、焦点が合っていない信号を減らし、連続的な光学切片(Zスタック)を取得できるため、オルガノイドなどの厚い3Dサンプルのイメージングに適しています。しかし、共焦点イメージングには通常、より長い取得時間と、光毒性/光退色を増加させる高強度レーザーが必要です。SYTOX Greenのような蛍光細胞死色素は、壊死、後期アポトーシス関連二次壊死、ネクロプトーシス、ピロトーシスなどの細胞膜の完全性が損なわれる細胞死の形態の測定にのみ適していることに注意することが重要です21。カスパーゼ依存性アポトーシスなど、細胞死の初期段階では細胞膜が不透過性のままである制御細胞死のいくつかの形態があります。しかし、このプロトコルは、カスパーゼ3/7活性蛍光レポーター22のイメージングも組み込むように容易に変更することができる。これにより、特定の細胞死モダリティを特徴付けるのに役立つ追加データが得られます。
私たちは、以前にCD患者由来オルガノイド9,10で報告したサイトカインIFN-γとTNF-α(図2C)の間の細胞傷害性相乗的相互作用を実証するために、私たちのプロトコルを使用しました。この形態の相乗効果の生理学的関連性は、血球貪食性リンパ組織球症および敗血症のマウスモデルでも実証されています23。生物学的薬剤24,25の組み合わせ間の相乗効果を定量化するために、いくつかの数学的参照モデルおよびアプローチが実施されている。それらは、その複雑さ、考慮する因子の数、および相互作用が相乗的であると見なすためのしきい値の点で異なります24,25。一部のモデルでは、試験された生物学的薬剤の事前知識が必要であり、薬剤の活性について一定の仮定を立て、各単剤治療および併用療法25の包括的な用量反応曲線を必要とする場合がある。シナジーを測定するために選択した方法は、以前に化学療法薬の組み合わせが癌細胞株の増殖に対する阻害効果を測定するために使用されてきた薬物相互作用係数(CDI)モデルの変更です26。CDIはBlissの独立モデルです。2つの摂動の予測された複合効果を計算するとき、Blissの独立性は、それらが別々の経路を標的とし、独立した作用機序を持っていると仮定します27。摂動者間の交互作用が相乗的であるためには、実際の複合効果が予測効果よりも大きくなければなりません。IFN-γとTNF-αは受容体と下流のシグナル伝達成分が異なることが知られているため、このモデルは私たちの実験設定に適しています。さらに、Blissの独立性により、相互作用係数を計算して相乗効果を定量化することができ、用量反応データセットは必要ありません。
このプロトコルで最適な結果を得るためには、いくつかの重要な要素を考慮する必要があります。コロノイドが高密度に増殖し(図1Bi)、直径が約25〜50 μmであり、細胞の播種を試みる前に活発に増殖していることが重要です。アッセイにコロノイドの最適でない培養物を使用すると、細胞数が不十分になり、コロノイドの回収率が低くなり、実験に一貫性がなくなる可能性があります。再現性のある結果を得るためには、実験間でコロノイドの密度を一貫してシードすることも重要です。炎症性サイトカインに対するin vitro応答は、細胞播種密度28,29によって影響を受ける可能性があることが以前に実証されています。また、BMEドーム内に気泡が形成されることも一般的な問題で、これはイメージングに影響を与える可能性があります。これは、リバースピペッティング技術を使用することで防ぐことができます。この手法により、シード処理の一貫性も向上します。
また、複数の時点を撮像する場合は、各時点の最大毒性条件を用意する。非イオン性界面活性剤であるTriton-X 100は、細胞毒性アッセイのポジティブコントロール(Max Toxicity condition)として一般的に使用されています。Triton-X 100を添加すると、コロンイドが溶解して死滅し、蛍光細胞死色素が細胞内に侵入します。以前の時点からMax Toxicity条件を使用すると、蛍光シグナルが時間の経過とともに減衰するため、データの正規化が不正確になり、一貫性がなくなります。
考慮すべき最後のポイントは、コロノイド培養に使用されるBMEの選択です。BMEのいくつかの商業生産者があります。ただし、私たちのプロトコルでは、 材料表に含まれるブランドのみをテストしています。患者由来の膵臓がんオルガノイドを用いた最近の研究では、BMEの商業源は細胞増殖速度を変化させたが、化学療法薬に対する反応や遺伝子発現には有意な影響はなかったことがわかった30。このことを念頭に置いて、私たちのプロトコルではBMEブランド間で結果の傾向が似ていると予想されますが、同じブランドを一貫して使用することをお勧めします。
このプロトコルを、CD患者由来のコロノイドを使用したIFN-γおよびTNF-α誘導細胞死の分析にどのように使用できるかを示しました。患者由来の腸管オルガノイドは、TNF-αの細胞毒性作用に対する感受性の増加など、疾患の多くの特性を保持しているため、CDを研究するための強力なツールです31。ただし、サイトカイン以外の摂動物質や結腸直腸癌などのIBD以外の病状の細胞毒性効果を調査するために、プロトコルを簡単に変更できます(非IBDコロノイドを使用してプロトコルのテストに成功しました)。この方法は、細胞死メカニズム、上皮バリア機能、または腸管粘膜免疫学に関わるあらゆる研究分野に役立つと考えています。
開示事項
K.N.は、作業完了時にAbbVie Inc.から研究資金を受け取っていました。この資金提供は、APC Microbiome Irelandへの研究センタースポーク賞(SFI-14/SP/2710)の文脈で行われました。
謝辞
著者らは、インフォームドコンセントと研究への参加について患者に感謝し、優れた支援を提供してくれた臨床関係者に感謝します。 図 1A は BioRender.com を使用して作成されました。この研究は、アイルランド科学財団からの助成金、すなわちK.N.へのキャリア開発賞(CDA)(SFI-13/CDA/2171)、研究センター助成金(SFI-12/RC/2273)、およびAPC Microbiome Irelandへの研究センタースポーク賞(SFI-14/SP/2710)によって支援されました。P.F.はSFI/20/RP/9007からも資金提供を受けました。
資料
| Name | Company | Catalog Number | Comments |
| Advanced DMEM/F12 | Gibco | 12634010 | |
| Amphotericin B Solution | Sigma-Merck | A2942 | |
| A-83-01 | Sigma-Merck | SML0788 | |
| BioRender | Science Suite Inc. | N/A | Scientific illustration software |
| Bovine Serum Albumin | Sigma-Merck | A2058 | Essentially IgG-free, low endotoxin |
| B27 Supplement | Invitrogen | 17504-044 | |
| CHIR-99021 | Sigma-Merck | SML1046 | |
| Costar 48-well Clear TC-treated Multiple Well Plates, Individually Wrapped, Sterile | Corning | 3548 | |
| Cultrex Basement Membrane Extract, Type 2, Pathclear | R&D Systems | 3532-010-02 | Basement membrane extract |
| Dimethyl sulfoxide | Sigma-Merck | D2650 | |
| Dulbecco′s Phosphate Buffered Saline | Sigma-Merck | D8537 | |
| EVOS FL Digital Inverted Fluorescence Microscope | Invitrogen | AMF4300 | Digital inverted epifluorescence microscope |
| EVOS 40x Objective, fluorite, LWD, phase-contrast | ThermoFisher Scientific | AMEP4683 | Long working distance 40x fluorescence objective |
| Fiji/ImageJ (Windows version) | Open-source software | N/A | Image analysis software |
| Foetal Bovine Serum | Sigma-Merck | F9665 | |
| Gentamicin Solution | Sigma-Merck | G1397 | |
| Gentle Cell Dissociation Reagent | STEMCELL Technologies | 100-0485 | Enzyme-free cell dissociation reagent |
| GlutaMAX-1 | Gibco | 35050061 | L-alanyl-L-glutamine dipeptide supplement |
| GraphPad Prism 5 (Windows version) | Dotmatics | N/A | Data graphics and statistics software |
| Greiner 15 mL Polypropylene Centrifuge Tube, Sterile with conical bottom & Screw Cap | Cruinn | 188261CI | |
| HEPES 1 M | Gibco | 15630080 | |
| Human recombinant EGF (animal free) | Peprotech | AF-100-15 | |
| N-Acetylcysteine | Sigma-Merck | A9165 | |
| Nicotinamide | Sigma-Merck | N0636 | |
| Normocin | InvivoGen | ant-nr-05 | Broad range antimicrobial reagent |
| Nunc Edge 96-Well, Nunclon Delta-Treated, Flat-Bottom Microplate | ThermoFisher Scientific | 15543115 | |
| N2 supplement | Invitrogen | 17502-048 | |
| Recombinant Human IFN-gamma Protein | R&D Systems | 285-IF | Resuspend in sterile filtered 0.1% PBS/BSA |
| Recombinant Human TNF-alpha Protein | R&D Systems | 210-TA | Resuspend in sterile filtered 0.1% PBS/BSA |
| SB202190 | Sigma-Merck | S7067 | |
| Snap Cap Low Retention Microcentrifuge Tubes | ThermoFisher Scientific | 3451 | |
| SYTOX Green Nucleic Acid Stain - 5 mM Solution in DMSO | Invitrogen | S7020 | Fluorescent cell death dye, protect from light |
| Triton X-100 | Sigma-Merck | 93420 | |
| Trypan Blue solution | Sigma-Merck | T8154 | |
| Tryple Express | Gibco | 12604013 | Enzymatic dissociation reagent |
| Y-27632 | MedChemExpress | HY-10071 | Inhibitor of ROCK-I and ROCK-II |
参考文献
- Patankar, J. V., Becker, C. Cell death in the gut epithelium and implications for chronic inflammation. Nat Rev Gastroenterol Hepatol. 17 (9), 543-556 (2020).
- Zeissig, S., et al. Downregulation of epithelial apoptosis and barrier repair in active Crohn's disease by tumour necrosis factor alpha antibody treatment. Gut. 53 (9), 1295-1302 (2004).
- Bartee, E., Mcfadden, G. Cytokine synergy: An underappreciated contributor to innate anti-viral immunity. Cytokine. 63 (3), 237-240 (2013).
- Fish, S. M., Proujansky, R., Reenstra, W. W. Synergistic effects of interferon γ and tumour necrosis factor α on T84 cell function. Gut. 45 (2), 191-198 (1999).
- Wakisaka, Y., Sugimoto, S., Sato, T. Organoid medicine for Inflammatory Bowel Disease. Stem Cells. 40 (2), 123-132 (2022).
- Flood, P., Hanrahan, N., Nally, K., Melgar, S. Human intestinal organoids: Modeling gastrointestinal physiology and immunopathology - current applications and limitations. Eur J Immunol. 54 (2), e2250248 (2024).
- Matsuzawa-Ishimoto, Y., et al. An intestinal organoid-based platform that recreates susceptibility to t-cell-mediated tissue injury. Blood. 135 (26), 2388-2401 (2020).
- Lee, C., et al. Intestinal epithelial responses to IL-17 in adult stem cell-derived human intestinal organoids. J Crohns Colitis. 16 (12), 1911-1923 (2022).
- Woznicki, J. A., et al. TNF-α synergises with IFN-γ to induce caspase-8-JAK1/2-STAT1-dependent death of intestinal epithelial cells. Cell Death Dis. 12 (10), 864 (2021).
- Flood, P., et al. DNA sensor-associated type I interferon signaling is increased in ulcerative colitis and induces jak-dependent inflammatory cell death in colonic organoids. Am J Physiol Gastrointest Liver Physiol. 323 (5), G439-G460 (2022).
- Grabinger, T., et al. Ex vivo culture of intestinal crypt organoids as a model system for assessing cell death induction in intestinal epithelial cells and enteropathy. Cell Death Dis. 5 (5), e1228 (2014).
- Bode, K. J., Mueller, S., Schweinlin, M., Metzger, M., Brunner, T. A fast and simple fluorometric method to detect cell death in 3D intestinal organoids. Biotechniques. 67 (1), 23-28 (2019).
- Mertens, S., et al. Drug-repurposing screen on patient-derived organoids identifies therapy-induced vulnerability in KRAS-mutant colon cancer. Cell Rep. 42 (4), 112324 (2023).
- Vandussen, K. L., et al. Development of an enhanced human gastrointestinal epithelial culture system to facilitate patient-based assays. Gut. 64 (6), 911-920 (2015).
- Miyoshi, H., Stappenbeck, T. S. In vitro expansion and genetic modification of gastrointestinal stem cells in spheroid culture. Nat Protoc. 8 (12), 2471-2482 (2013).
- Sato, T., et al. Long-term expansion of epithelial organoids from human colon, adenoma, adenocarcinoma, and Barrett's epithelium. Gastroenterology. 141 (5), 1762-1772 (2011).
- Woznicki, J. A., et al. Human BCL-G regulates secretion of inflammatory chemokines but is dispensable for induction of apoptosis by IFN-γ and TNF-α in intestinal epithelial cells. Cell Death Dis. 11 (1), 68 (2020).
- Edgar, R. D., et al. Culture-associated DNA methylation changes impact on cellular function of human intestinal organoids. Cell Mol Gastroenterol Hepatol. 14 (6), 1295-1310 (2022).
- Mubaid, F., Brown, C. M. Less is more: Longer exposure times with low light intensity is less photo-toxic. Microscopy Today. 25 (6), 26-35 (2017).
- Ziegler, U., Groscurth, P. Morphological features of cell death. News Physiol Sci. 19 (3), 124-128 (2004).
- Zhang, Y., Chen, X., Gueydan, C., Han, J. Plasma membrane changes during programmed cell deaths. Cell Res. 28 (1), 9-21 (2018).
- Tamura, H., et al. Evaluation of anticancer agents using patient-derived tumor organoids characteristically similar to source tissues. Oncol Rep. 40 (2), 635-646 (2018).
- Karki, R., et al. Synergism of TNF-α IFN-γ triggers inflammatory cell death, tissue damage, and mortality in SARS-CoV-2 infection and cytokine shock syndromes. Cell. 184 (1), 149-168 (2021).
- Geary, N. Understanding synergy. Am J Physiol Endocrinol Metab. 304 (3), E237-E253 (2013).
- Duarte, D., Vale, N. Evaluation of synergism in drug combinations and reference models for future orientations in oncology. Curr Res Pharmacol Drug Discov. 3, 100110 (2022).
- Wong, F. C., Woo, C. C., Hsu, A., Tan, B. K. The anti-cancer activities of Vernonia amygdalina extract in human breast cancer cell lines are mediated through caspase-dependent and p53-independent pathways. PLoS One. 8 (10), e78021 (2013).
- Ryall, K. A., Tan, A. C. Systems biology approaches for advancing the discovery of effective drug combinations. J Cheminform. 7, 7 (2015).
- Sukho, P., et al. Effect of cell seeding density and inflammatory cytokines on adipose tissue-derived stem cells: An in vitro study. Stem Cell Rev Rep. 13 (2), 267-277 (2017).
- Vaughan-Jackson, A., et al. Density dependent regulation of inflammatory responses in macrophages. Front Immunol. 13, 895488 (2022).
- Lumibao, J. C., et al. The impact of extracellular matrix on the precision medicine utility of pancreatic cancer patient-derived organoids. bioRxiv. , (2023).
- Lee, C., et al. TNF-α induces LGR5+ stem cell dysfunction in patients with Crohn's disease. Cell Mol Gastroenterol Hepatol. 13 (3), 789-808 (2022).
転載および許可
このJoVE論文のテキスト又は図を再利用するための許可を申請します
許可を申請さらに記事を探す
This article has been published
Video Coming Soon
Copyright © 2023 MyJoVE Corporation. All rights reserved