Aby wyświetlić tę treść, wymagana jest subskrypcja JoVE. Zaloguj się lub rozpocznij bezpłatny okres próbny.
Method Article
Quantifying Yeast Chronological Life Span by Outgrowth of Aged Cells
W tym Artykule
Podsumowanie
Chronological aging in yeast refers to the loss of cell viability associated with time in stationary phase. Here we describe a high-throughput method for quantitatively determining yeast chronological life span.
Streszczenie
Protokół
Part 1: Preparation of aging cultures
- Streak strains of interest from frozen stocks onto YEPD agar plates (1% yeast extract, 2% bacto-peptone, 2% agar, 2% glucose).
- Incubate the cells at 30˚C for 48 hours or until single colonies appear.
- Pick single colonies and inoculate into 5 mL of YEPD liquid medium (1% yeast extract, 2% bacto-peptone, 2% glucose) in test tubes.
- Grow cultures overnight at 30˚C while maintaining constant agitation using either a shaker or roller drum.
- Inoculate 5 mL of synthetic complete (SC) medium (Table 1) with 50 µL of the overnight culture. Generally three SC cultures are prepared for each strain to provide triplicate biological replication of the life span analysis for each strain being examined.
- Maintain the cultures at 30˚C with constant agitation on a roller drum for the entire experiment (generally 2 or more weeks).
Part 2: Taking a viability age-point
After two days of culture in SC media, the cells should be in stationary phase and the first age-point is ready to be taken. Subsequent age-points should be taken every 2-3 days for a minimum of two weeks. For each age point:
- Prepare the Bioscreen 100-well Honeycomb plates for inoculation by filling each well with 145 µL of YEPD. Be sure to leave at least one well filled with only YEPD and no cells for data analysis later.
- Remove the aging cultures from the incubator.
- Briefly vortex the first culture to be inoculated into the Honeycomb plate, while being careful not to spill any of the culture.
- Remove 5 µL of the mixed culture and pipette it into the first well of the Honeycomb plate. Flame the mouth of each test tube before and after removing the 5 µL aliquot.
- Repeat this procedure for each aging culture being sure to note the well position corresponding to each culture. Identical well positions should be used for each subsequent age-point throughout the entire experiment.
- Replace the cultures into the 30˚C incubator when finished with the inoculations.
Part 3: Loading the Bioscreen C MBR machine
- Expose the incubator compartment by lifting the lid and remove the cover to the sample tray.
- Insert the newly inoculated Honeycomb plate into sample tray (use the left slot if you are only reading one plate).
- Replace the cover to the sample tray and lower the lid to the incubator compartment.
- Check to make sure the heat transfer fluid is above the minimum fill level. If low, add more using a 1000 µL pipette with the heat transfer fluid provided.
- Using the Bioscreen software “EZExperiment”, set the following parameters to obtain suitable growth curves for Saccharomyces cerevisiae:
- Number of samples: Enter the number of wells with media or 200
- Filter: 420-580nm, Wideband
- Temperature: 30˚C
- Experiment Length: 1 Day, 0 hours, 0 seconds
- Measurement Interval: 30 minutes
- Shaking: On, Continuous shaking, High
- Click “Start” to begin readings.
Part 4: Data Analysis
Typically, six age-points are taken over the course of two weeks. The age-points are taken at days 2, 4, 6, 9, 11, and 13. Depending on the experimental design and strains being tested, it may be desirable to take age-points more or less frequently or for longer than 2 weeks. It is important to load the Honeycomb plate in the same order for every age-point such that each aging culture corresponds to the same well position at every age-point, as this will make data analysis much easier.
- Obtain the output files from the Bioscreen C MBR machine. The software “EZExperiment” will output the Bioscreen data as a tab-delimited file that is compatible with Microsoft Excel as well as other software. The first column shows at what time the OD measurement was taken during the experiment, with subsequent columns representing each well in the Bioscreen Honeycomb plates (Figure 1).
- Delete the first OD reading from every column. This reading is “noise”.
- Normalize the data by subtracting the OD value of the well with YEPD alone from all OD values in each column. This removes the background absorbance by the media.
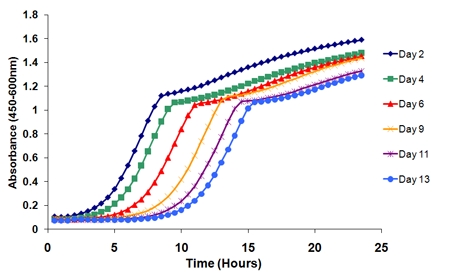
- Plot the outgrowth curves. The curves will shift as a function of age (Figure 2). For example, by plotting the outgrowth curves from column 1 (well 1 of the Honeycomb plate) over the six time points, there is a distinct rightward shift of the curves over time.
- Calculate the doubling time (δ) for each well based on the growth kinetics of the day 2 age-point. The equation used to calculate doubling time is:

where OD1 and OD2 represent successive OD measurements and t1 and t2 being the time between measurements. Calculate doubling times only between OD values of 0.2 to 0.5. The average of these values is the doubling time for that well. Calculate doubling times only between OD values of 0.2 to 0.5. The average of these values is the doubling time for that well. Most wild-type yeast strains should give a doubling time value between 85 to 90 minutes. - For each age-point, calculate the time shift (∆t) in the outgrowth curves relative to the initial age-point (day 2). An easy way to do this is to determine the difference in the length of time it took for each well to reach an OD of 0.3 between the initial age-point and each subsequent age-point. The time that a particular well reached an OD of 0.3 can be calculated from the linear regression equation corresponding to ln(OD) as a function of time between the two time-points bracketing OD=0.3.
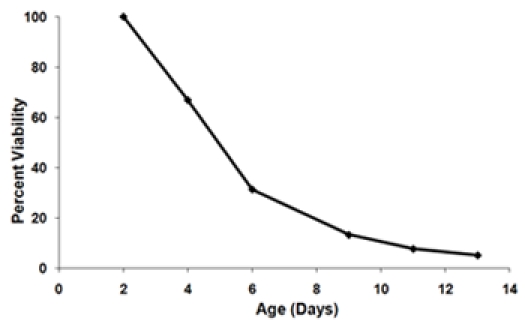
- Calculate the fraction surviving at each age-point in order to generate a survival curve (Figure 3). Define the initial age-point (day 2) to be 100% viability. For each successive age-point calculate the percent survival using the equation:

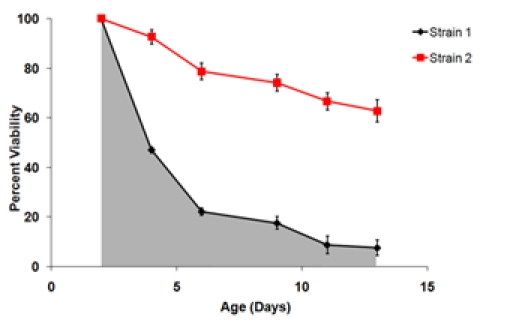
where sn is the survival percentage, ∆tn is the time shift, and δn is the doubling time. - Generate survival curves (Figure 3B) as desired for each well (or replicate wells) by plotting the fraction (or percent) of viable cells as a function of age.
- Calculate the survival integral (SI) for each well. SI is defined as the area under the survival curve and can be estimated by the formula:

where agen is the age-point (e.g. 2, 4, 6, 9, 11, and 13) and sn is the survival value at that age-point. - Determine statistical parameters of replicate wells from the SI and survival data. Common statistical parameters of interest include mean, median, and variance for each set of biological replicates. A t-test or similar analysis can be used for pairwise comparison of SI for different experimental and control groups. It may also be desirable to generate survival curves, as described in 4.8 from averaged biological replicates.
Part 5: Representative results
At the completion of the experiment, you will have plotted the survival curve and performed data analysis sufficient to determine the chronological aging potential for several different strains or conditions. If performed properly, the growth curves obtained from the Bioscreen C MBR machine should look similar to those shown in Figure 2 and the resulting survival curves should resemble those shown in Figure 3. Generally, wild-type cells cultured under the conditions described here will have a median chronological life span on the order of 7 days. Substantial variation in survival is observed in different strains and under some conditions, such as growth in 0.05% glucose media, median survival can exceed 30 days.

Figure 1. Data output from the Bioscreen program “EZExperiment”. Column A displays the time at which an absorbance reading was taken. Successive columns represent the wells of the Honeycomb plate inoculated with cells taken from aging cultures.

Figure 2. Outgrowth curves from a single biological replicate over the course of an experiment. There is a distinct shift in the curves over time as cells in the aging culture lose viability. The length of time between the initial time point (day 2) and a successive time point determines viability at that particular age.


Figure 3. A) A survival curve generated using the outgrowth data from Figure 1. The day 2 time point is set as the 100% viability point. B) Final survival curves of two strains tested in the same experiment. These survival curves represent the average viabilities of three biological replicates for each strain. Error bars represent standard deviation within biological replicates. The shaded area under the survival curve represents the survival integral (SI) for strain 1.
| Table 1. Synthetic Defined Medium Used for Chronological Aging Studies (strain background BY4743) | |
| Component | Concentration (g/L) |
| D-glucose | 20 |
| Yeast nitrogen base (-AA/AS) | 1.7 |
| (NH4)2SO4 | 5.0 |
| Adenine | 0.04 |
| L-Arginine | 0.02 |
| L-Aspartic acid | 0.1 |
| L-Glutamic acid | 0.1 |
| L-Histidine | 0.1 |
| L-Leucine | 0.3 |
| L-Lysine | 0.03 |
| L-Methionine | 0.02 |
| L-Phenylalanine | 0.05 |
| L-Serine | 0.375 |
| L-Threonine | 0.2 |
| L-Tryptophan | 0.04 |
| L-Tyrosine | 0.03 |
| L-Valine | 0.15 |
| Uracil | 0.1 |
Note: This recipe accounts for auxotrophies in diploid BY4743 strain. Amino acid auxotrophies should be compensated for by adding a 5X final concentration to the synthetic complete medium.
Dyskusje
The high-throughput chronological life span assay described here is an effective method for quantifying the aging potential of large numbers of strains with high accuracy and precision. The primary advance of this method over classical methods for determining survival by counting colony-forming units (e.g. see 3) is the use of a shaker/incubator/plate reading device such as the Bioscreen C MBR machine to obtain high-resolution growth curves at each age-point. In direct comparison with low-throughput chronolog...
Podziękowania
This work was supported by NIH Grant 1R21AG031965-01A1. M. K. is an Ellison Medical Foundation New Scholar in Aging.
Materiały
| Name | Company | Catalog Number | Comments | |
| Bacto Peptone | Reagent | BD Biosciences | 211677 | |
| Bacto Yeast Extract | Reagent | BD Biosciences | 288620 | |
| Difco Agar | Reagent | BD Biosciences | 214530 | |
| Yeast Nitrogen Base w/o A.A. and A.S. | Reagent | MidSci | J630-500G | |
| Amino Acids | Reagent | Sigma-Aldrich | ||
| Ammonium Sulfate | Reagent | Spectrum | AM185 | |
| Dextrose | Reagent | Fisher Scientific | D16-10 | |
| Bioscreen C MBR machine | Tool | Growth Curves USA | 5101370 | |
| Bioscreen 100-well Honeycomb plate | Tool | Growth Curves USA | 9502550 |
Odniesienia
- Steinkraus, K. A., Kaeberlein, M., Kennedy, B. K. Replicative aging in yeast: the means to the end. Annu Rev Cell Dev Biol. 24, 29 (2008).
- Kaeberlein, M., Conn, P. M. . Handbook of models for human aging. , 109 (2006).
- Fabrizio, P., Longo, V. D. The chronological life span of Saccharomyces cerevisiae. Aging Cell. 2 (2), 73 (2003).
- Murakami, C. J., Burtner, C. R., Kennedy, B. K., Kaeberlein, M. A method for high-throughput quantitative analysis of yeast chronological life span. J Gerontol A Biol Sci Med Sci. 63 (2), 113 (2008).
- Piper, P. W., Harris, N. L., MacLean, M. Preadaptation to efficient respiratory maintenance is essential both for maximal longevity and the retention of replicative potential in chronologically ageing yeast. Mech Ageing Dev. 127 (9), 733 (2006).
- Fabrizio, P., et al. Superoxide is a mediator of an altruistic aging program in Saccharomyces cerevisiae. J Cell Biol. 166 (7), 1055 (2004).
Przedruki i uprawnienia
Zapytaj o uprawnienia na użycie tekstu lub obrazów z tego artykułu JoVE
Zapytaj o uprawnieniaPrzeglądaj więcej artyków
This article has been published
Video Coming Soon
Copyright © 2025 MyJoVE Corporation. Wszelkie prawa zastrzeżone