Aby wyświetlić tę treść, wymagana jest subskrypcja JoVE. Zaloguj się lub rozpocznij bezpłatny okres próbny.
Method Article
Biochemical Measurement of Neonatal Hypoxia
W tym Artykule
Podsumowanie
A method is described to measure biochemical markers of neonatal hypoxia-ischemia. The approach utilizes high pressure liquid chromatography (HPLC) and Gas Chromatography Mass Spectrometry (GC/MS).
Streszczenie
Neonatal hypoxia ischemia is characterized by inadequate blood perfusion of a tissue or a systemic lack of oxygen. This condition is thought to cause/exacerbate well documented neonatal disorders including neurological impairment 1-3. Decreased adenosine triphosphate production occurs due to a lack of oxidative phosphorylation. To compensate for this energy deprived state molecules containing high energy phosphate bonds are degraded 2. This leads to increased levels of adenosine which is subsequently degraded to inosine, hypoxanthine, xanthine, and finally to uric acid. The final two steps in this degradation process are performed by xanthine oxidoreductase. This enzyme exists in the form of xanthine dehydrogenase under normoxic conditions but is converted to xanthine oxidase (XO) under hypoxia-reperfusion circumstances 4, 5. Unlike xanthine dehydrogenase, XO generates hydrogen peroxide as a byproduct of purine degradation 4, 6. This hydrogen peroxide in combination with other reactive oxygen species (ROS) produced during hypoxia, oxidizes uric acid to form allantoin and reacts with lipid membranes to generate malondialdehyde (MDA) 7-9. Most mammals, humans exempted, possess the enzyme uricase, which converts uric acid to allantoin. In humans, however, allantoin can only be formed by ROS-mediated oxidation of uric acid. Because of this, allantoin is considered to be a marker of oxidative stress in humans, but not in the mammals that have uricase.
We describe methods employing high pressure liquid chromatography (HPLC) and gas chromatography mass spectrometry (GCMS) to measure biochemical markers of neonatal hypoxia ischemia. Human blood is used for most tests. Animal blood may also be used while recognizing the potential for uricase-generated allantoin. Purine metabolites were linked to hypoxia as early as 1963 and the reliability of hypoxanthine, xanthine, and uric acid as biochemical indicators of neonatal hypoxia was validated by several investigators 10-13. The HPLC method used for the quantification of purine compounds is fast, reliable, and reproducible. The GC/MS method used for the quantification of allantoin, a relatively new marker of oxidative stress, was adapted from Gruber et al 7. This method avoids certain artifacts and requires low volumes of sample. Methods used for synthesis of MMDA were described elsewhere 14, 15. GC/MS based quantification of MDA was adapted from Paroni et al. and Cighetti et al. 16, 17. Xanthine oxidase activity was measured by HPLC by quantifying the conversion of pterin to isoxanthopterin 18. This approach proved to be sufficiently sensitive and reproducible.
Protokół
1. Sample Collection and Processing
- Collect blood sample in a 6ml K3E EDTA K3 tube which is kept on ice.
- Within 2 min of collection, centrifuge the sample at 4°C at 1500 g for 10 min.
- Transfer the supernatant (plasma) to a 1.5ml microcentrifuge tube.
- Centrifuge at 4°C at 18000 g for 30 min.
- Remove the supernatant aliquots and transfer them into separate microcentrifuge tubes for purine (200μl), allantoin (50μl), MDA (100μl), and XO (120μl) analysis. Be careful not to contaminate the samples with red blood cells. You may need to adjust the volumes of plasma for MDA, XO, and purines based upon the total volume of plasma available.
2. Preparing Internal Standard, 2-Aminopurine (2-AP), for Purine and XO Analysis
- Weigh out 0.01351g 2-AP and add it to 8ml of water that has been acidified with 2-5 drops of HCl. If the 2-AP is not dissolving you need to add more acid. Adjust the final volume to 10ml.
- Use the UV-Vis spectrophotometer to determine the true concentration of your stock 2-AP solution. (λmax 315, ε 4000).
- Once the concentration of the stock 2-AP solution is determined, calculate the volumes required to contain 1x10⁻⁷ mol 2-AP internal standard for purine measurements and 1x10⁻⁸ mol 2-AP internal standard for XO measurements.
Equation 1:

Equation 2:

- Aliquot the calculated volumes into separate microcentrifuge tubes and evaporate to dryness in a SpeedVac.
3. HPLC Measurement of Purines
- Transfer plasma (200μl) to a Microcon YM-10 centrifugal filter device and centrifuge at 4°C at 14000 g for 1.5 hours.
- Remove the filtrate and transfer to a microcentrifuge tube containing 1x10⁻⁷ mol 2-AP. Be sure to record the volume of filtrate added to the microcentrifuge tube containing the 2-AP. Vortex the samples for 10-20 sec.
- Analyze samples with an HPLC. Three 50 μl injections are used for each sample. Samples are injected onto a Supelcosil LC-18-S, 15 cm x 4.6 mm, 5 μm column equipped with a Supelguard LC-18-S column guard. The gradient conditions described in Table 1 should be used to obtain adequate peak separation: solvent A-water, solvent B- methanol, solvent C- 50mM ammonium formate buffer, pH 5.5.
| Time | Flow (ml/min) | %A | %B | %C | |
| 1 | 1.00 | 0.0 | 0.0 | 100.0 | |
| 2 | 16.00 | 1.00 | 0.0 | 0.0 | 100.0 |
| 3 | 17.00 | 1.00 | 100.0 | 0.0 | 0.0 |
| 4 | 22.00 | 1.00 | 100.0 | 0.0 | 0.0 |
| 5 | 27.00 | 1.00 | 0.0 | 100.0 | 0.0 |
| 6 | 32.00 | 1.00 | 0.0 | 100.0 | 0.0 |
| 7 | 33.00 | 1.00 | 100.0 | 0.0 | 0.0 |
| 8 | 38.00 | 1.00 | 100.0 | 0.0 | 0.0 |
| 9 | 39.00 | 1.00 | 0.0 | 0.0 | 100.0 |
| 10 | 45.00 | 1.00 | 0.0 | 0.0 | 100.0 |
Table 1. Solvent changes for HPLC measurement of purine compounds.
- Determine the concentration of purines in the sample. Quantify hypoxanthine, xanthine, and uric acid by obtaining peak areas at the retention and wavelengths described in Table 2. Determine the peak area of 2-AP. Determine the area ratios of hypoxanthine, xanthine, and uric acid to 2-AP and convert the ratios to μmolar concentrations using standard curves.
| Retention Time* | Observed λmax* | Reported λmax19 | Reported εmax19 | |
| Uric Acid | ~3.5 min | 288 | 283 [2] | 11,500 [2] |
| Hypoxanthine | ~7.0 min | 248 | 248[1] | 10,800 [1] |
| Xanthine | ~9.5 min | 267 | 267 [2] | 10,200 [2] |
| 2-Aminopurine | ~12.5 min | 305 | 314 [2] | 4,000 [2] |
Table 2. Typical retention times and λmax for purines and internal standard. *Determined on HPLC using isocratic 50mM ammonium formate buffer (pH 5.5) with a flow rate of 1mL/min. pH is in [ ].
- Analyze all samples in triplicate, but only include values for later analyses if the coefficient of variation is less than 10%.
4. GC/MS Measurement of Allantoin
- Add 50μl 10μM DL-Allantoin-5-13C;1-15N (internal standard) to the 50 μl plasma set aside for the allantoin assay during sample collection and processing.
- Add 100 μl acetonitrile to this plasma solution.
- Vortex the mixture for 10-20 sec then centrifuge at 4°C at 20,000 g for 10 min.
- Remove the supernatant, place it in a GC/MS vial and dry under N2.
- After drying, add 50 μl of derivatizing agent N-tert-Butyldimethylsilyl-N-methyltrifluoroacetamide (MTBSTFA) in pyridine (1:1 vol/vol), cap the vials and incubate them at 50°C for 2 h. This derivatization yields consistently quantifiable m/z peaks of 398.0 and 400.0 for allantoin and DL-allantoin-5-13C;1-15N, respectively20.
- Analyze samples on the Agilent Technologies GC 6890N and MS 5973 equipped with an auto sampler. Perform compound separation on an Agilent 122-5532G capillary column (25.7m length, 0.25mm internal diameter). Use helium as the carrier gas at a flow rate of 1.5 ml/min. Inject derivatized product (1 μl) in split mode (split ratio 20:1, split flow 29.4 ml/min, total flow 33.8 ml/min). Set the initial column temperature at 100°C and hold at that temperature for 2 min before increasing it to 180°C at a rate of 10°C/min. Hold the temperature for 4 min and then increase it to 260°C at a rate of 20°C/min. Maintain this temperature until the end of the run. After each sample, clean the column with 2 injections of hexane.
- Quantify allantoin using select ion monitoring mode while monitoring the 398.0 m/z ion for allantoin and the 400.0 m/z ion for the DL-allantoin-5-13C;1-15N. Convert the ion abundance ratios of allantoin/(heavy allantoin) to micromolar concentrations of allantoin using a prepared standard curve.
- All samples are analyzed in triplicate but only values with a coefficient of variation of less than 10% are used in further analyses.
5. Preparing Internal Standard, Methyl Malondialdehyde (MMDA), for MDA Analysis
- Add 523μl 3-ethoxymethacrolein to 1477μl 7M NaOH in a 100ml round bottom flask. Add a stirbar.
- Place the flask in a water bath at 45°C and stir until the reaction has gone to completion. This should take roughly 140 min. Monitor the progress of the reaction by removing a 10μl aliquot of the liquid periodically at 10 min intervals. Dilute each sample collected by a factor of 105 using 50 mM potassium phosphate buffer (pH 7) and measuring the absorbance with the UV-Vis. Once the absorbance at 275nm reaches roughly 0.658 the reaction is complete. As the reaction progresses, the solution will turn yellow then orange.
- Allow the reaction to progress for an additional 15 min.
- Add 5ml of distilled deionized water to the round bottom flask and transfer the solution to a separatory funnel. Use an additional 3 ml of water to wash the contents of the flask into the funnel. Add an additional 2ml of water to the funnel.
- Extract the solution 3 times with 5 ml dichloromethane. After each extraction discard the organic layer.
- After the third extraction, transfer the aqueous layer to a round bottom flask and rotovap to dryness.
- Resuspend the product in 3ml ethanol and transfer to a pre-weighed 15ml conical tube. Rinse the flask with an additional 2ml ethanol and add the rinse to the conical tube.
- Add 5ml benzene and incubate the tube in warm water until the product dissolves then immediately place the tube on ice for 10 min. Centrifuge it for 5 min at 15000 g and remove the supernatant.
- Add 5ml ethanol and 5 ml isopropyl ether to the precipitant. Dissolve the precipitant by incubating the tube in warm water and periodically tilting the tube very gently. Once precipitate is dissolved, place the tube on ice for 10 min. Perform this recrystallization 2 more times with ethanol and isopropyl ether. Some insoluble white chunks of product may be formed.
- After the last recrystallization step remove as much supernatant as possible and dry the resultant product in a Speedvac. Weigh the conical tube with the synthesized product.
- Add 5ml water to the tube, vortex, and filter out any remaining solids.
- Use the UV-vis spectrophotometer to determine the final concentration of MMDA. The λmax for MMDA in 50 mM potassium phosphate buffer (pH 7) is 274 nm with the extinction coefficient of 29900 M-1cm-1 14.
6. GC/MS Measurement of MDA
- Prepare a solution of 0.5mM butylated hydroxyl toluene (BTH) in ethanol by adding 0.11 g BTH to 9ml ethanol and adjusting the final volume to 10ml. Then perform a dilution by adding 10μl of this concentrated solution to 990μl ethanol.
- Prepare a solution of 50mM phenyl hydrazine by adding 4.92μl of phenyl hydrazine to 995μl of water in a dark microcentrifuge tube. Vortex the solution.
- Add 5μl 10μM MMDA to the 100μl plasma set aside for the MDA assay during sample collection and processing.
- Then add 10μl 0.5mM BTH to the MMDA/plasma mixture followed by the addition of 200μl 1M sodium citrate at pH 4. This pH is crucial for correct derivatization of the sample. A higher or lower pH will result in skewed MDA levels.
- Dilute the final mixture by adding distilled deionized water to a final volume of 480μl.
- Derivatize the solution by adding 20μl 50mM phenyl hydrazine, capping the vials and incubating the solution at 25°C for 30 min on an orbital shaker.
- Add 1ml of hexane, vortex for 1 min, and centrifuge at 3000 rpm for 10 min.
- Transfer the organic layer to a GC/MS vial and concentrate the solution to 100μl by N2 stream.
- Analyze samples on a GC/MS using the auto sampler. Perform compound separation on an Agilent 122-5532G capillary column (25.7 m length, 0.25 mm internal diameter). Use helium as the carrier gas at a flow rate of 0.6-0.8 ml/min. Inject derivatized product (2 μl) in split mode (split ratio 20:1, split flow 23.0 ml/min, total flow 27.1 ml/min). Set the initial column temperature at 110°C and hold at that temperature for 1 min before increasing it to 250°C at a rate of 40°C/min. Maintain this temperature until the end of the run. After each sample, clean the column with 2 injections of hexane.
- Quantify MDA using select ion monitoring mode using the 144.00 m/z for MDA and the 158.00 m/z for MMDA. Convert the MDA/MMDA ion abundance ratios to micromolar concentrations using a standard curve.
- Analyze samples in triplicate and only use values with a coefficient of variation of less than 10%.
7. HPLC Measurement of Xanthine Oxidase
- The detection of xanthine oxidase function is dependent on the ability to sensitively measure the levels of a suitable substrate (pterin) as well as its product (isoxanthopterin). Plasma is incubated with the substrate either for 0 min (control) or for 4 h, and the incubation-dependent substrate to product conversion is determined.
- Add 240μl 0.2 M Tris-HCl buffer (pH 9.0) and 4.63μl 7.083x10⁻³ M pterin to each tube (0 and 4h) and preincubate them at 37°C for 5 min.
- Initiate the enzyme reaction by adding 60μl of plasma to each tube.
- Immediately add 300μl 4% HClO4 to the control tube (0 min) but allow the other mixture to incubate for 4 hours before quenching the reaction with 300μl 4% HClO4.
- After the addition of HClO4, vigorously shake the tube and then centrifuge at 4°C at 15000 g for 15 min.
- Remove 500μl of supernatant and neutralize by adding 20μl of 5M K2CO3. Vigorously shake the tube and then centrifuge at 4°C at 15000 g for 15 min.
- Add 350μl of the neutralized solution to a microcentrifuge tube containing 1x10⁻⁸ mol 2-AP.
- Analyze samples on an HPLC equipped with a scanning fluorescence detector. Three 50 μl injections are used for each sample. Samples will be injected onto a Wacosil 5C-18-200 250 mm x 6.0 mm, 5 μm column equipped with a Supelguard LC-18-S column guard. The following isocratic conditions should be used to obtain adequate peak separation and identification: 95% 20mM KPO4 buffer (pH 2.2) and 5% methanol at a flow rate 1ml/min. Set the excitation wavelength for the fluorescence detector at 345 nm and the emission wavelength at 410 nm.
- Determine the ratios of pterine and isoxanthopterine to 2-AP by obtaining peak areas from the fluorescence detector spectrum. The first peak in the spectrum, ~ 5 minutes, corresponds to 2-AP. The second and largest peak will be pterine. Isoxanthopterine peak elutes last.
- Obtain the difference in the isoxanthopterine/2-AP peak area ratios between the 0 and the 4 h incubation time points. Use this value to calculate the XO activity from standard curves.
- Analyze samples in triplicates but use only values with a coefficient of variation of less than 10%.
8. Representative Results:
An example of the HPLC quantification of purine compounds is shown in Figure 1A. The specific retention times and emission wavelengths of hypoxanthine, xanthine, and uric acid permit the simultaneous quantification of purine compounds (Table 2). When the assay is run correctly, the compounds will have adequate separation and the peak shape will be sharp and unimodal. These peaks are then converted into concentrations, ranges shown in Table 3, through the use of standard curves. Because sample processing for this assay is minimal, the only sample based problems which may arise would be the lysing of the red blood cells. If the red blood cells lyse before the samples are centrifuged, the plasma will take on an orange/red color and cannot be used for evaluating hypoxic ischemia. The other issues which may arise when measuring purines involves the HPLC system and the column (Figure 1B). If there are air bubbles in the HPLC system the retention times will shift and the HPLC pressure will fluctuate dramatically. If the guard cartridge needs to be changed, the pressure will increase and the peaks will widen and become bi or tri-modal.
| Hypoxanthine (μM) | Xanthine (μM) | Uric Acid (μM) | Xanthine Oxidase ((nmol product)/min) | Malondialdehyde (μM) | Allantoin (μM) | |
| Term Normoxic | 1.13-19.3 (64) | 0.02-3.69 (61) | 107.20-726.12 (63) | 2.47x10⁻⁶ - 3.92x10⁻³ (20) | 0.44-3.76 (53) | NA |
| Term Respiratory Distress | 1.78-12.59 (27) | 0.07-11.8 (24) | 225.40-653.32 (27) | 0 - 1.03x10⁻⁵ (8) | 0.82-2.73 (24) | NA |
| Term Hypoxic | 0.38-31.80 (13) | 0.11-2.88 (13) | 235.65-1348.13 (13) | 1.20x10⁻⁵ -236.44 (9) | 0.95-2.15 (7) | NA |
| Preterm Normoxic | 1.54-4.39 (9) | 0.03-1.77 (9) | 178.92-593.49 (9) | 2.46x10⁻⁵ - 5.44x10⁻⁴ (2) | 0.95-2.74 (8) | 2.30-5.26 (67) |
| Preterm Respiratory Distress | 3.04-8.04 (2) | NA | 327.56-365.11 (2) | NA | 2.40-3.46 (3) | NA |
Min-Max (n)
Table 3. Representative ranges for purines, xanthine oxidase, malondialdehyde, and allantoin.
An example of the GC/MS quantification of Allantoin is shown in Figure 2. Because the mass of derivitized allantoin and derivitized heavy allantoin is known, select ion mode can be used to identify these compounds on the mass spec. If the assay is done correctly, two peaks will be observed at the same retention time. One corresponding to allantoin (398.00 m/z) and the other to heavy allantoin (400.00 m/z). These peaks are then converted into concentrations, ranges shown in Table 3, through the use of a standard curve. If the assay is run incorrectly, and samples were not derivitized properly, the peaks may not be present or may not be quantitatively representative. Once again, if the red blood cells lysed the plasma cannot be used to evaluate oxidative stress in neonatal hypoxic ischemia.
The results for the quantification of MDA are similar to those for allantoin with the exception that the two peaks are observed at different retention times. At ~ 3.5 minutes retention time, a 144.00 m/z peak for MDA and at ~4 minutes retention time, a 158.00 m/z peak for MMDA is observed (Figure 3). These peaks are then converted into concentrations, ranges shown in Table 3, through the use of a standard curve. If the assay is run incorrectly, or samples are not derivitized properly, no peaks may be observed when selecting for 144.00m/z and 158.00m/z. It should be noted that if there is an excess of lipid in the plasma from bolus oral feedings or intravenous lipid administration, the plasma will take on a milky appearance and cannot be used to evaluate oxidative stress in neonatal hypoxic ischemia.
An example of the HPLC-based quantification of xanthine oxidase function is shown in Figure 4. If the assay is run correctly, three peaks should be observed with the fluorescent detector, one for pterin, one for isoxanthopterin, and one for 2-AP. These peaks are then converted into concentrations, ranges shown in Table 3, through the use of a standard curve. There should also be a peak corresponding to isoxanthopterin and 2-AP on the spectrum generated from the PDA detector. If the enzyme activity is absent, the peak corresponding to isoxanthopterin will not be seen. Because this assay measures enzyme function, repeated freezing and thawing of the sample may alter this.
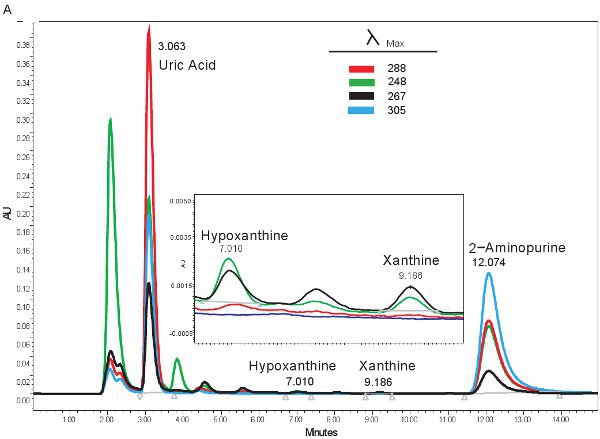
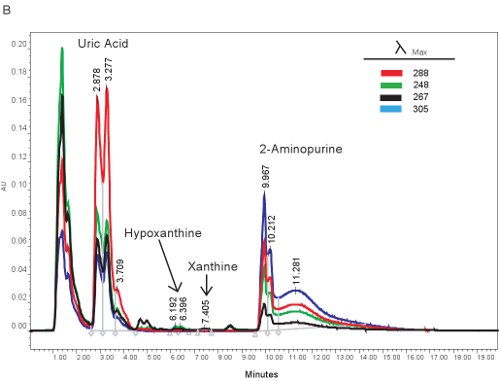
Figure 1. HPLC spectrum for the identification of purine compounds. A). Representative results if the assay was run correctly. B). representative results if there is a problem with the HPLC, column, or guard cartridge.
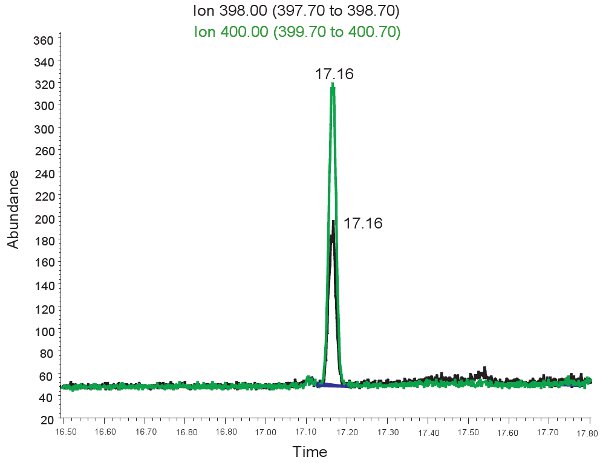
Figure 2. GC/MS spectrum for the quantification of Allantoin. The peak at ion 398.00 m/z corresponds to allantoin. The peak at ion 400.00 m/z corresponds to heavy allantoin.
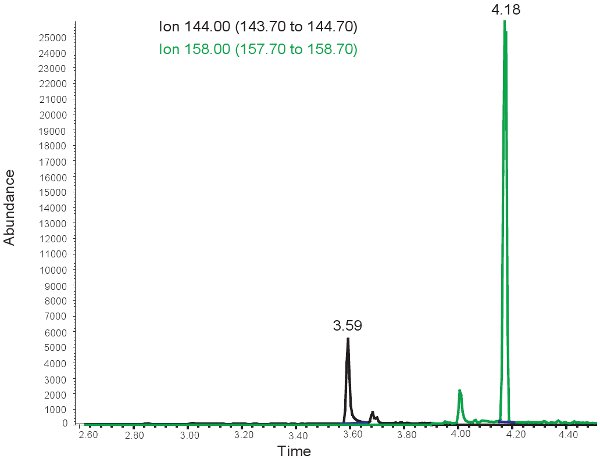
Figure 3. GC/MS spectrum for the quantification of MDA. The peak at ion 144.00 m/z corresponds to MDA. The peak at ion 158.00 m/z corresponds to MMDA.
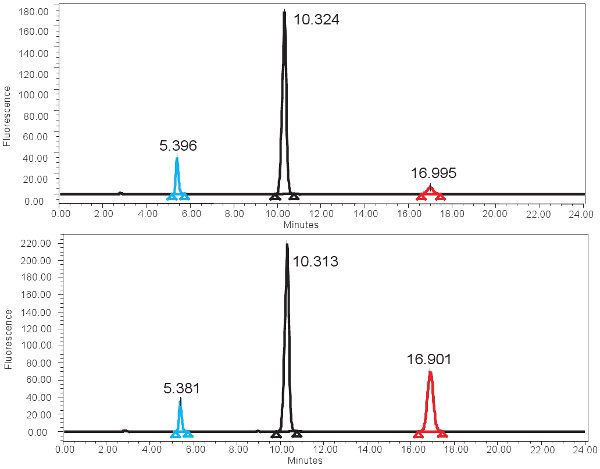
Figure 4. HPLC spectrum for the measurement of XO activity. A) Representative results for the 0 min incubation time and B) representative results for the 4 hour incubation time. Note the higher isoxanthopterine peak (at ~17 min) for the 4 hour incubation time. In the fluorescence spectrum, 2-AP elutes first at ~ 5min and pterine elutes next at ~10min.
Dyskusje
The methods described here permit the evaluation of neonatal hypoxia ischemia. This protocol combines the measurements of markers of energy (ATP) deprivation, oxidative stress, oxidative damage, and enzyme activity to gain an overall biochemical picture of the presence or even the degree of hypoxic ischemia. Despite the usefulness of this method, there are potential limitations. Firstly, it takes roughly 1-2 ml of blood to collect enough plasma to run all of the assays. This will not be a problem in adults or childre...
Ujawnienia
No conflicts of interest declared.
Podziękowania
This work is funded by National Institutes of Health R01 NR011209-03
Materiały
| Name | Company | Catalog Number | Comments |
| 6ml K3E EDTA K3 tube | Fisher Scientific | 2204061 | |
| 5702R centrifuge | Fisher Scientific | 05413319 | With 13&16MM adaptor |
| 1.5ml microcentrifuge tube | USA Scientific, Inc. | 1615-5599 | |
| 2-Aminopurine | Sigma-Aldrich | A3509 | |
| Varian Cary 100 spectrophotometer | Agilent Technologies | 0010071500 | |
| Savant SpeedVac | Thermo Fisher Scientific, Inc. | SC210A-115 | |
| Micron centrifugal filter device | Fisher Scientific | UFC501596 | |
| Supelcosil LC-18-S Column | Sigma-Aldrich | 58931 | |
| Supelcosil LC-18-S Supelguard cartridge and holder | Sigma-Aldrich | 59629 | |
| HPLC | Waters | ||
| GCMS Vial | Fisher Scientific | 03376607 | |
| DL-Allantoin-5-13C;1-15N | CDN Isotopes | M-2307 | Lot #L340P9 |
| MTBSTFA | Thermo Fisher Scientific, Inc. | 48920 | |
| Pyridine | Sigma-Aldrich | 270970 | |
| 5973E GC/MSD | Agilent Technologies | G7021A | Part # for 5975E GC/MS |
| 3-Ethoxymethacrolein | Sigma-Aldrich | 232548 | |
| Sodium Hydroxide | Sigma-Aldrich | S5881 | |
| Dichloromethane | Sigma-Aldrich | 270997 | |
| Benzene | Sigma-Aldrich | 401765 | |
| Diisopropyl ether | Sigma-Aldrich | 38270 | |
| BHT | Sigma-Aldrich | B1378 | |
| Ethanol | Sigma-Aldrich | 459844 | |
| Phenylhydrazine | Sigma-Aldrich | P26252 |
Odniesienia
- Harkness, R. A., Whitelaw, A. G., Simmonds, R. J. Intrapartum hypoxia: the association between neurological assessment of damage and abnormal excretion of ATP metabolites. J Clin Pathol. 35, 999-1007 (1982).
- Shalak, L., Perlman, J. M. Hypoxic-ischemic brain injury in the term infant-current concepts. Early Hum Dev. 80, 125-141 (2004).
- Webster, W. S., Abela, D. The effect of hypoxia in development. Birth Defects Res C Embryo Today. 81, 215-228 (2007).
- Engerson, T. D., McKelvey, T. G., Rhyne, D. B., Boggio, E. B., Snyder, S. J., Jones, H. P. Conversion of xanthine dehydrogenase to oxidase in ischemic rat tissues. J Clin Invest. 79, 1564-1570 (1987).
- Choi, E. Y., Stockert, A. L., Leimkuhler, S., Hille, R. Studies on the mechanism of action of xanthine oxidase. J Inorg Biochem. 98, 841-848 (2004).
- Godber, B. L., Schwarz, G., Mendel, R. R., Lowe, D. J., Bray, R. C., Eisenthal, R. Molecular characterization of human xanthine oxidoreductase: the enzyme is grossly deficient in molybdenum and substantially deficient in iron-sulphur centres. Biochem J. 388, 501-508 (2005).
- Gruber, J., Tang, S. Y., Jenner, A. M., Mudway, I., Blomberg, A., Behndig, A. Allantoin in human plasma, serum, and nasal-lining fluids as a biomarker of oxidative stress: avoiding artifacts and establishing real in vivo concentrations. Antioxid Redox Signal. 11, 1767-1776 (2009).
- Zitnanova, I., Korytar, P., Aruoma, O. I., Sustrova, M., Garaiova, I., Muchova, J. Uric acid and allantoin levels in Down syndrome: antioxidant and oxidative stress mechanisms?. Clin Chim Acta. 341, 139-146 (2004).
- Siciarz, A., Weinberger, B., Witz, G., Hiatt, M., Hegyi, T. Urinary thiobarbituric acid-reacting substances as potential biomarkers of intrauterine hypoxia. Arch Pediatr Adolesc Med. 155, 718-722 (2001).
- Buonocore, G., Perrone, S., Longini, M., Terzuoli, L., Bracci, R. Total hydroperoxide and advanced oxidation protein products in preterm hypoxic babies. Pediatr Res. 47, 221-224 (2000).
- Berne, R. M. Cardiac nucleotides in hypoxia: possible role in regulation of coronary blood flow. Am J Physiol. 204, 317-322 (1963).
- Harkness, R. A., Lund, R. J. Cerebrospinal fluid concentrations of hypoxanthine, xanthine, uridine and inosine: high concentrations of the ATP metabolite, hypoxanthine, after hypoxia. J Clin Pathol. 36, 1-8 (1983).
- Plank, M. S., Boskovic, D. S., Sowers, L. C., Angeles, D. M. Biochemical markers of neonatal hypoxia. Pediatric Health. 2, 485-501 (2008).
- Cighetti, G., Allevi, P., Anastasia, L., Bortone, L., Paroni, R. Use of methyl malondialdehyde as an internal standard for malondialdehyde detection: validation by isotope-dilution gas chromatography-mass spectrometry. Clin Chem. 48, 2266-2269 (2002).
- Paroni, R., Fermo, I., Cighetti, G. Validation of methyl malondialdehyde as internal standard for malondialdehyde detection by capillary electrophoresis. Anal Biochem. 307, 92-98 (2002).
- Cighetti, G., Debiasi, S., Ciuffreda, P., Allevi, P. Beta-ethoxyacrolein contamination increases malondialdehyde inhibition of milk xanthine oxidase activity. Free Radic Biol Med. 25, 818-825 (1998).
- Cighetti, G., Debiasi, S., Paroni, R., Allevi, P. Free and total malondialdehyde assessment in biological matrices by gas chromatography-mass spectrometry: what is needed for an accurate detection. Anal Biochem. 266, 222-229 (1999).
- Yamamoto, T., Moriwaki, Y., Takahashi, S., Tsutsumi, Z., Yamakita, J., Nasako, Y. Determination of human plasma xanthine oxidase activity by high-performance liquid chromatography. J Chromatogr B Biomed Appl. 681, 395-400 (1996).
- Fasman, G. . Handbook of Biochemistry and Molecular Biology. , (1988).
- Chen, X. B., Calder, A. G., Prasitkusol, P., Kyle, D. J., Jayasuriya, M. C. Determination of 15N isotopic enrichment and concentrations of allantoin and uric acid in urine by gas chromatography/mass spectrometry. J Mass Spectrom. 33, 130-137 (1998).
Przedruki i uprawnienia
Zapytaj o uprawnienia na użycie tekstu lub obrazów z tego artykułu JoVE
Zapytaj o uprawnieniaPrzeglądaj więcej artyków
This article has been published
Video Coming Soon
Copyright © 2025 MyJoVE Corporation. Wszelkie prawa zastrzeżone