
Aby wyświetlić tę treść, wymagana jest subskrypcja JoVE. Zaloguj się lub rozpocznij bezpłatny okres próbny.
Method Article
High-Resolution Respirometry to Assess Bioenergetics in Cells and Tissues Using Chamber- and Plate-Based Respirometers
W tym Artykule
Podsumowanie
Assessing oxidative phosphorylation using high-resolution respirometers has become an integral part of the functional analysis of mitochondria and cellular energy metabolism. Here, we present protocols for the analysis of cellular energy metabolism using chamber and microplate-based high-resolution respirometers and discuss the key benefits of each device.
Streszczenie
High-resolution respirometry (HRR) allows monitoring oxidative phosphorylation in real-time for analysis of individual cellular energy states and assessment of respiratory complexes using diversified substrate-uncoupler-inhibitor titration (SUIT) protocols. Here, the usage of two high-resolution respirometry devices is demonstrated, and a basic collection of protocols applicable for the analysis of cultured cells, skeletal and heart muscle fibers, and soft tissues such as the brain and liver are presented. Protocols for cultured cells and tissues are provided for a chamber-based respirometer and cultured cells for a microplate-based respirometer, both encompassing standard respiration protocols. For comparative purposes, CRISPR-engineered HEK293 cells deficient in mitochondrial translation causing multiple respiratory system deficiency are used with both devices to demonstrate cellular defects in respiration. Both respirometers allow for comprehensive measurement of cellular respiration with their respective technical merits and suitability dependent on the research question and model under study.
Wprowadzenie
Mitochondria fulfill the key provision of energy and are a compartmentalized organelle contributing to essential cellular bioenergetic and metabolic processes such as anabolism of nucleotides, lipids and amino acids, iron-sulfur cluster biogenesis and are implicated in signaling such as controlled cell death1,2,3. Mitochondrial bioenergetics through oxidative phosphorylation contributes to almost all cellular processes within the cell, and consequently, mitochondrial dysfunctions of primary or secondary origin are associated with a wide spectrum of disease conditions4,5. Mitochondrial dysfunction not only involves alterations in structure or mitochondrial density but also in the quality and regulation of the respiratory system6. This qualitative element encompasses substrate control, coupling characteristics, post-translational modifications, cristae dynamics, and respiratory supercomplexes7,8. Therefore, accurate analysis of mitochondrial bioenergetics for experimental and diagnostic approaches to assess the energy metabolism of the cell is important in health and disease.
Mitochondrial oxidative phosphorylation (OXPHOS) is a sequence of reactions within the respiratory system or electron transfer system (ETS) for the generation of cellular energy through adenosine triphosphate (ATP)9. The multi-enzymatic step to harness energy from electron flow through complexes I and II to complex IV generates an electrochemical proton gradient across the inner mitochondrial membrane, subsequently utilized for phosphorylation of adenosine diphosphate (ADP) to ATP via complex V (F1FO ATP synthase) (Figure 1A).
First, two-electron carriers are generated during the tricarboxylic cycle (TCA), glycolysis, and pyruvate oxidation: nicotinamide adenine dinucleotide (NADH) and dihydroflavine adenine dinucleotide (FADH2). NADH is oxidized at complex I (NADH dehydrogenase), during which two electrons are transferred to coenzyme Q (quinone is reduced to quinol), while protons are pumped into the intermembrane space (IMS). Second, complex II (Succinate dehydrogenase) oxidizes FADH2 and feeds the electrons to coenzyme Q without pumping protons. Third, at complex III (Cytochrome c oxidoreductase), electrons from coenzyme Q are transferred to cytochrome c while protons are pumped into the IMS. Fourth, cytochrome c transfers the electrons to complex IV (Cytochrome c oxidase), the final complex to pump protons, and where oxygen functions as an electron acceptor to assimilate protons, ultimately forming water. It is this oxygen that mitochondria consume which can be measured by an oxygraph. Finally, the protons generated from complex I, complex III, and complex IV are used to rotate complex V, thereby generating ATP9.
Importantly, electron transfer occurs not only in a linear fashion, otherwise denoted as the electron transport chain. Instead, electrons can be transferred to the coenzyme Q pool through multiple respiratory pathways and facilitate convergent electron flow. NADH-substrates and succinate, for example, can enter via complex I and complex II, respectively. Electrons from fatty acid oxidation can be donated via the electron transferring flavoprotein complex. Indeed, a comprehensive analysis of OXPHOS requires a holistic approach with appropriate fuel substrates (Figure 1A).

Figure 1: Mitochondrial oxidative phosphorylation and specific substrate and inhibitor protocols. (A) Mitochondrion and scheme of the electron transfer system (CI-CIV) and mitochondrial F1F0 ATP synthase (CV). All structures are from PDB. The figures only depict substrates and inhibitors described in this study). (B) Sample trace of oxygen flux in intact HEK293 cells using standard protocol in a mHRR device. (C) Sample trace of oxygen flux in intact HEK293 cells using standard protocol in a cHRR device. (D) Sample trace of oxygen flux in permeabilized human fibroblasts from a healthy donor with respective SUIT protocol. Abbreviations: 1 = Routine respiration of intact cells; 2 = State 2; 3 = State 3(I); 4 = State 3(I) with cytC; 5 = State 3 (I+II); 6 = Leak(OM); 7 = ETS capacity; 8 = S(ROT); 9 = ROX; 10 = TMPD; 11 = Az. ROT = Rotenone, AM = Antimycin, ATP = Adenosine triphosphate, Az = Azide, OM = Oligomycin, FCCP = Carbonyl cyanide p-trifluoro-methoxyphenyl-hydrazone; Asc = Ascorbate, TMPD = N,N,N′,N′-tetramethyl-p-phenylenediamine, Succ = Succinate, M = Malate, P = Pyruvate, ADP = Adenosine diphosphate, NAD = Nicotinamide adenine dinucleotide, IMS = Intermembrane space, FAD = Flavin adenine dinucleotide. Please click here to view a larger version of this figure.
Analysis of mitochondrial OXPHOS capacity using HRR has become an instrumental biochemical method of diagnostic value not only for primary mitochondrial defects10,11 but extending to all other realms of biology such as cancer and ageing12. HRR allows the determination of cellular respiration by the analysis of mitochondrial OXPHOS capacity, which directly reflects individual or combined mitochondrial respiratory complex deficiency, and indirectly is associated with cellular dysfunction and altered energy metabolism9. Methodologically, respiration measurements are performed using cells, tissue, or isolated mitochondria11,13,14, with frozen material only partially suitable15,16. Frozen tissue is shown to have an intact ETS with maintained supercomplex stability15. Thus, as opposed to traditional TCA intermediates, respective substrates are directly fed into the ETS. However, coupling between the ETS and ATP synthesis is lost as the membrane integrity is compromised through freeze damage (ice crystal formation).
Respiration experiments normally take place at a physiological temperature of 37 °C for endotherms in either non-permeabilized or permeabilized cells or tissue. While the former considers the cytosolic metabolic context, the latter provides the energetic contribution of individual OXPHOS complexes and the ATPase through the addition of specific substrates (and inhibitors). The sequence and variation of substrates and inhibitors have led to the development of a diverse array of SUIT protocols17 and assays18 to address various scientific questions of OXPHOS function (reviewed under12). The basic protocol of cellular respiration assesses four different states: i) routine respiration - the respiration in a respective respiration media without any addition of substrates or inhibitors consuming but endogenous substrates. This state can reveal general OXPHOS or secondary-induced respiration defects caused, for example, by altered metabolite profiles. Next, the addition of the ATPase inhibitor oligomycin reveals the permeability of the inner mitochondrial membrane to protons, defined as ii) leak respiration. Subsequent titration of a protonophore such as the uncoupler carbonyl cyanide p-trifluoro-methoxyphenyl-hydrazone (FCCP) allows to determine the state at which ETS capacity is maximal in an open-transmembrane proton circuit mode, defined as iii) uncoupled respiration. Importantly, an uncoupled state can also occur by experimental interventions through excessive mechanical damage to the mitochondrial membranes. Conversely, the non-coupled state refers to respiratory uncoupling by an intrinsic mechanism that is physiologically controlled. Finally, complete inhibition of the ETS by addition of the complex III inhibitor antimycin and complex I inhibitor rotenone determines residual oxygen consumption (ROX) from non-mitochondrial oxygen-consuming processes (Figure 1A-C).
Mitochondrial bioenergetics consists of five distinct respiration states19,20. State 1 respiration is without any additional substrates or ADP, except for what is endogenously available. After the addition of ADP, but still, no substrates, state 2 respiration is achieved. When substrates are added, allowing electron transfer and ATP synthesis, state 3 respiration is reached. In this state, OXPHOS capacity can be defined at saturating concentrations of ADP, inorganic phosphate, oxygen, NADH- and succinate-linked substrates. State 4 respiration or LEAK respiration can be defined as a state without ADP or chemically inhibited ATP synthases while having sufficient substrates. Lastly, when all oxygen is depleted (anoxic) in a closed-chamber setting, state 5 respiration is observed.
Several methods exist to assess cellular energy states14 with two devices dominating the current real-time assessment of OXPHOS through analysis of oxygen consumption, measured as the function of the decrease in oxygen over time in a closed-chamber system with different applicability dependent on the experimental model and research question: the Oroboros 2k high-resolution respirometer and the Seahorse XF extracellular flux analyzer. Both devices record the oxygen consumption rates as a decrease in picomoles (pmol) of oxygen (O2) per second as an absolute value within the chamber or microplate well. The specific oxygen consumption per mass is obtained by normalizing the respective oxygen consumption in a specific buffer recipe per number of cells (millions), tissue weight (mg), or protein amount.
The O2k (Oroboros Instruments) is a closed two-chamber system equipped with a polarographic oxygen sensor (abbreviated as chamber-based high-resolution respirometer: cHRR). Each experimental chamber holds 2 mL of liquid which is kept homogenous by magnetic stirrers. The polarographic oxygen sensor utilizes an amperometric approach to measure the oxygen: it contains a gold cathode, a silver/silver chloride anode, and in between a KCI solution creating an electrochemical cell upon which a voltage (0.8 V) is applied. Oxygen from the assay medium diffuses through a 25 µm fluorinated ethylene propylene membrane (O2-permeable) and undergoes reduction at the cathode, producing hydrogen peroxide. At the anode, silver is oxidized by hydrogen peroxide, generating an electric current. This electric current (ampere) is linearly related to the partial oxygen pressure. The partial pressure of oxygen and the oxygen solubility factor of the assay medium are used to compute the oxygen concentration. Since oxygen partial pressure is dependent on experimental temperature and polarographic measurements are temperature-sensitive, fluctuations in temperature need precise (±0.002 °C) regulation by a Peltier heating block. Temperature can be controlled within a range of 4 °C and 47 °C.
The Seahorse XF extracellular flux analyzer (Agilent) is a plate-based system with 24- or 96-well microplate format in which three fluorescence electrodes measure oxygen consumption over time in each well (abbreviated as microplate-based high-resolution respirometer: mHRR). A maximum of four ports in the assay cartridge are available for automated injection during the assay. An assay contains multiple cycles, each with three phases: 1) mixing, 2) waiting, and 3) measurement. During the measurement phase, sensor probes are lowered into the microplate creating a temporarily closed chamber containing 7-10 µL volume to measure emitted light. This light is emitted by polymer-embedded fluorophores on the tip of the sensor probes, which sense O2 based on phosphorescence quenching. The intensity of the fluorescence signal is proportional to O2 and influenced by the temperature of the sensor and assay medium. Therefore, accurate oxygen estimation requires a relative approach with a background well without any sample. Restoring oxygen concentration occurs during the mixing phase when the sensor moves up and down to mix the volume above the temporary chamber. Each cycle computes one oxygen consumption rate. Temperature can be controlled within a range of 16 °C and 42 °C.
HRR is the gold standard to assess cellular bioenergetics in primary and mitochondria-associated diseases and general cellular metabolism. In this study, basic protocols for HRR are provided to assess OXPHOS function in cells and tissues.

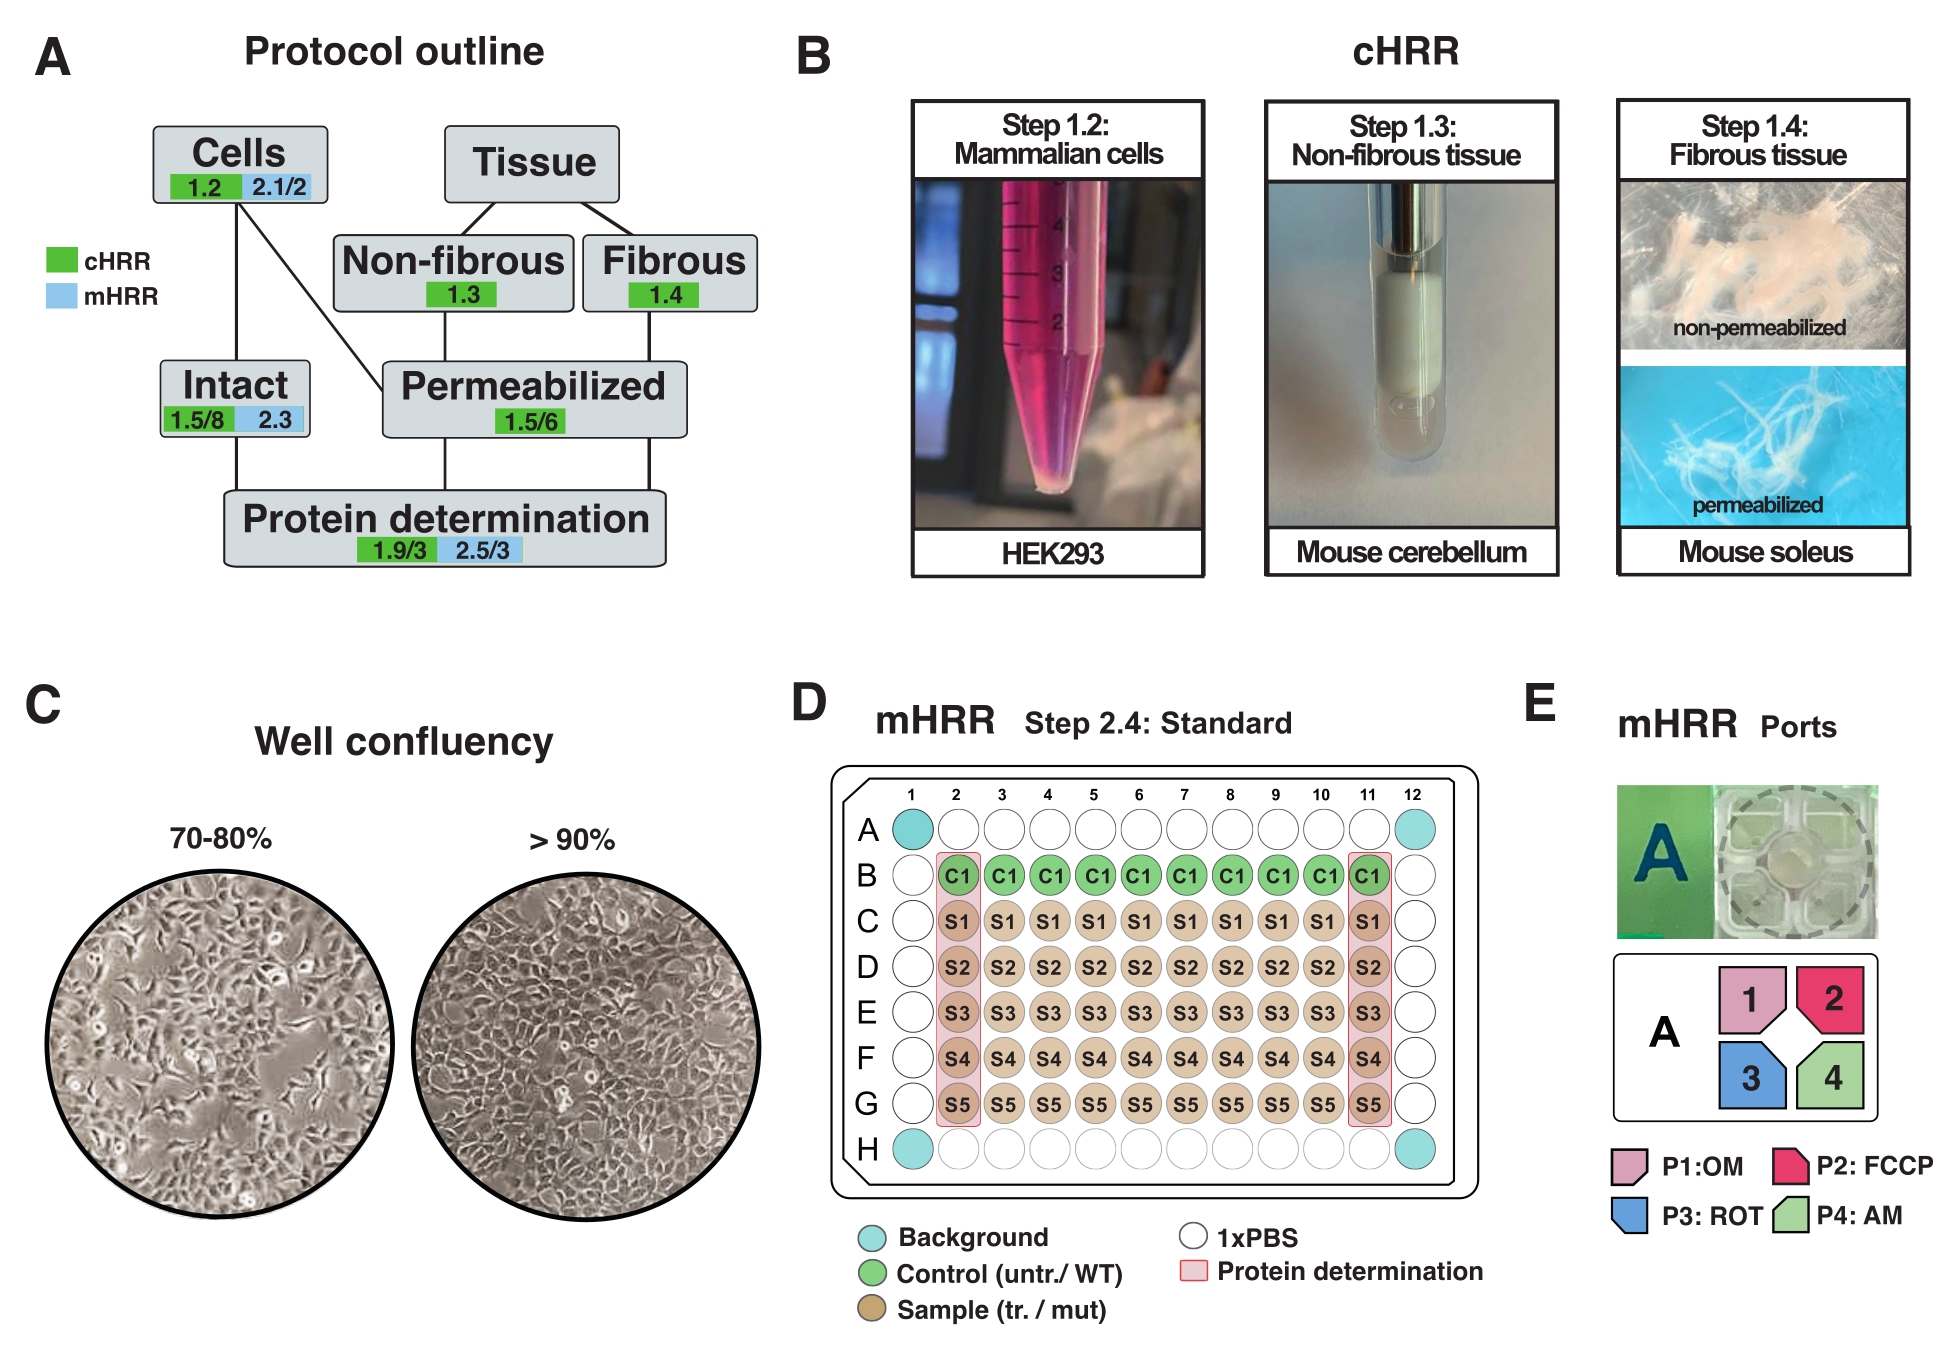
Figure 2: Workflow for cell and tissue preparations for cHRR, and cell preparation for mHRR respirometry. (A) Outline of provided protocols. (B) Mammalian cells (step 1.2): HEK293 pellet equaling 3 x 10⁶ cells (left panel). Non-fibrous tissue (step 1.3): Preparation of murine cerebellum lysate in 2 mL Teflon potter (middle panel). Saponin-induced skeletal muscle permeabilization (step 1.4) right panel) for cHRR respirometry. (C) Standard microplate seeding layout (step 2.4) and confluency check for the analysis of eukaryotic cells (HEK293) for mHRR respirometry. (D, E) Scheme of injection port loading for mHRR respirometry (step 2.4). Please click here to view a larger version of this figure.
Protokół
All animal experimentation is performed in accordance with the National Animal Experiment Review Board and Regional State Administrative Agency for Southern Finland. Male C57BL/6JOlaHsd mice (4-6 months-old) were used in this study. Consent for the use of human cell lines was obtained from the institutional ethics committee of the University of Helsinki.
1. High-resolution respirometry: Chamber-based respirometer (cHRR)
NOTE: The experiments in this section of the protocol were performed using the Oroboros O2k-Core: Oxygraph-2k (Table of Materials)
- Calibration of oxygen sensors
- Pre-run respirometers at 37 °C in 2.1 mL of mitochondrial respiration medium (MiR05, Table 1, solubility factor: 0.92) for >45 min and perform oxygen calibration as described21. Proceed if baseline variation is within ± 4 pmol/s.
NOTE: Large fluctuations in background signal could indicate required maintenance of the sensor membrane or traces of inhibitors remaining in the chamber from previous experimentation. An instrumental background oxygen flux correction is recommended prior to a batch of experiments25. - Record oxygen calibration values to monitor the sensor membrane performance over time.
NOTE: This reveals sensor function, signal-to-noise stability and when sensor membrane maintenance is required. Dependent on ambient pressure, between 180-200 µmol of oxygen is solubilized in MiR05. - Remove all liquid in the chamber before the addition of any sample in the respiration medium.
NOTE: Evaluate the volume of respiration chambers to be exactly 2 mL regularly.
- Pre-run respirometers at 37 °C in 2.1 mL of mitochondrial respiration medium (MiR05, Table 1, solubility factor: 0.92) for >45 min and perform oxygen calibration as described21. Proceed if baseline variation is within ± 4 pmol/s.
- Preparation of cells for high-resolution respirometry
- Culture HEK293 cells in 10 cm2 diameter dishes in Dulbecco`s Modified Eagle`s medium (DMEM) with high glucose supplemented with 10% heat-inactivated fetal bovine serum (FBS), GlutaMax, Non-essential amino acids, and Na-Pyruvate22 and uridine23 to support OXPHOS-defective metabolism in an incubator at 37 °C at 5% CO2.
NOTE: Any type of eukaryotic cell can be cultured. For most cell types, culturing a 10 cm2 dish leads to sufficient cells (usually >3 x 10⁶ cells). Routinely check for mycoplasma infection to avoid effects on cellular metabolism and respiration. - Grow cells without exceeding 90% confluency (Figure 2C).
NOTE: Cells with >90% confluency may show growth-dependent inhibitory effects on respiration (if not synchronized or post-mitotic). - Wash the cells with 1x PBS, detach with 1 mL of warm 0.25% trypsin, deactivate trypsin by adding warm DMEM (5 mL/10 cm2 plate) and count the cells with a hemocytometer.
- Gently centrifuge the cell solution equaling 2.5 x 10⁶ cells at 300 x g for 5 min, remove the supernatant completely, and resuspend in 2.5 mL of warm MiR05 (1 x 10⁶ cells/mL) (Figure 2A).
- For suspension cells, count and remove solution equaling 2.5 x 10⁶ cells, pellet and continue as mentioned in step 1.2.4.
- Run SUIT protocol for permeabilization optimization (step 1.6), permeabilized cell or tissue (step 1.5), or intact cells (step 1.7)
NOTE: For consistent results, it is recommended to keep cell concentration constant (e.g., 1 x 10⁶ cells/mL). Although respiration is independent of cell density in the respirometer24, substrates and inhibitors are in comparable concentration throughout experiments if cell numbers are kept constant.
- Culture HEK293 cells in 10 cm2 diameter dishes in Dulbecco`s Modified Eagle`s medium (DMEM) with high glucose supplemented with 10% heat-inactivated fetal bovine serum (FBS), GlutaMax, Non-essential amino acids, and Na-Pyruvate22 and uridine23 to support OXPHOS-defective metabolism in an incubator at 37 °C at 5% CO2.
- Preparation of non-fibrous tissue (e.g., brain, liver) for high-resolution respirometry
- Excise a homogenous piece of tissue, 30-40 mg in weight, or use the entire organ (mouse cerebellum in this case).
NOTE: If tissue is not immediately used, keep in 2 mL of ice-cold MiR05 allowing preservation for up to 2 h for most tissues. Individual tissue storage times need to be assessed in time series. - Blot the tissue dry with a Whatman filter paper (careful: soft tissue matter tends to stick).
- Place the 30-40 mg tissue piece into an ice-cooled 2 mL polytetrafluoroethylene potter Elvehjem homogenizer.
- Add an appropriate amount of MiR05 to obtain 20 mg/mL to maintain the tissue-to-buffer ratio. Keep the total amount >1.5 mL and <2 mL to avoid insufficient or excessive fluid for appropriate mechanical permeabilization.
- Insert the pestle, lyse the tissue slowly by retracting the pestle carefully while avoiding the generation of a vacuum causing excessive tissue damage.
- Perform 7 strokes in total (1x defined as one up- and downwards stroke) until lysed (apparent as a turbid liquid without major debris) (Figure 2B).
NOTE: The number of strokes for appropriate lysis needs to be tested for each tissue by assessing outer mitochondrial membrane integrity via cytochrome C response (step 1.5.11). Hard-to-lyse connective tissue or vessel parts might remain. - Decant the lysed tissue into a 15 mL centrifuge tube.
- Wash the inside of the potter with an equal amount of MiR05 used in lysing step (e.g., 1.5 mL) and add to the 15 mL tube now containing 3-4 mL of MiR05 at 10 mg/mL tissue lysate.
- Add 2 mL of plain MiR05 per chamber to warm to 37 °C.
- Swirl the tube for equal distribution before pipetting 500 µL (equaling 5 mg) of each lysate per chamber slowly to minimize the stress from cold to 37 °C.
- Wait >3 min for chamber contents to warm to 37 °C before closing the chamber. Remove excess fluid on top of the stopper (amount per chamber after closing: 4 mg).
- Run the SUIT protocol for standard permeabilized (step 1.5).
- Excise a homogenous piece of tissue, 30-40 mg in weight, or use the entire organ (mouse cerebellum in this case).
- Preparation of fibrous tissue (skeletal muscle, heart muscle) for high-resolution respirometry
- Extract the hard tissue, remove the connective tissue and fat from the muscles using sharp forceps in 2 mL of ice-cold BIOPS (Table 2) under a dissection microscope.
- Separate the fiber bundles (~4 mg) along the longitudinal axis with sharp forceps. Tease out the fibers sufficiently to obtain a mesh-like structure (Figure 2B).
NOTE: Proper mechanical fiber separation and permeabilization is indicated by the loss of the red pigment myoglobin and increased translucency. - Wash and permeabilize the fiber bundle in saponin (50 µg/mL in BIOPS, prepared fresh) for 20 min at 4 °C (fibers become translucent, indicating complete permeabilization, Figure 2B).
- Wash the fibers twice in MiR05 for 5 min per wash at 4 °C.
- Blot dry with filter paper and weigh before adding to the chamber filled with 2.1 mL MiR05.
- Introduce stoppers without fully closing, then oxygenate the chambers with 2 mL of pure O2 by using a 20 mL syringe and close the chambers by twisting the stoppers in a rotating motion. Keep O2 concentration between 300-500 µM during the experiment to avoid oxygen diffusion limitation.
- Protocol for assessing routine respiration in cells or tissues
- Add sample to the chamber as mentioned in steps 1.5.2-1.5.3.
- Add 2.3 mL of warm MiR05 cell suspension (standard input: 1 x 10⁶ cells/mL as in step 1.2 or 2 mg of tissue/mL as in step 1.3)
- Skeletal and heart muscle (step 1.4): Add ~4 mg of saponin-permeabilized fibers to prewarmed 2.3 mL of warm MiR05 considering steps 1.4.4-1.4.6
- Run chambers at 37 °C and a stirring speed of 700 rpm. Wait for >3 min to allow media to degas and close the chambers by twisting the stopper in a rotating motion. Peltier block stabilization indicates reaching the set temperature.
- (OPTIONAL) Change the stirrer speed to 300 rpm to allow the remaining bubbles to escape through the capillary of the stopper.
- Aspirate any excess liquid on top of the stopper. Wait for 10 min until a stable oxygen flux signal is achieved with any sample type to record routine/state 1 respiration, Figure 1B).
- For respiration measurements in permeabilized cells and tissue, continue with step 1.6. For intact cells with step 1.8.
- Protocol for OXPHOS analysis in permeabilized cells or tissues
- Use lysed (permeabilized) tissue sample or permeabilize cells by adding 1 µL of digitonin (8.1 mM digitonin stock in dimethyl sulfoxide (DMSO)) for a final concentration of 5 µg/mL to permeabilize cells. The flux will drop and should stabilize at >5 min.
CAUTION: Digitonin is acutely toxic to the respiratory tract, in contact with skin, or when swallowed.
NOTE: Injection of all chemicals is performed with precision glass syringes. Use syringes only for indicated chemicals to avoid cross-contamination and thoroughly wash in water and EtOH after use. Blocked syringes may require ultrasonication in warm ddH2O or a cleaning wire to dislodge any chemical clogs. Always retract a surplus of the respective stock solution into the syringe to avoid introducing air into the chambers. Inspect the inside of the chambers for the introduction of air after each injection. Record each step until flux plateaus. - Add in rapid succession: 5 µL of 0.4 M malate (M) for a final concentration of 1 mM, 5 µL of 2.0 M pyruvate (P; prepared freshly), for a final concentration of 5 mM, 4 µL of 2.5 M glutamate (G) for a final concentration of 5 mM.
- After previous flux plateaued, add 5 µL (10 µL for muscle tissue) of 0.5 M adenosine diphosphate (ADP, aliquots stored at -80 °C) for a final concentration of 1.25 mM.
NOTE: Tissue such as muscle might need a different concentration to reach saturation. - Add 5 µL of 4 mM cytochrome C (cytC) for a final concentration of 10 µM.
NOTE: Optional for cells to assess the quality of permeabilization. - Add 16 µL of 1.25 M succinate (S) for a final concentration of 10 mM. (OPTIONAL) Add 3 µL of 0.5 M ADP for a final concentration of 2 mM to control the saturation of ADP concentration.
- For cells and non-fibrous tissue, add 2 µL of 1 mg/mL oligomycin (OM) for a final concentration of 1 µg/mL.
CAUTION: All ETS inhibitors used are highly toxic.
NOTE: Oligomycin may require titration for optimal concentration as it can repress ETS capacity and is omitted for muscle tissue. Reoxygenate here when muscle tissue is assayed and if O2 is below 300 µM. - Titrate FCCP from a 2 mM stock, add 0.6 µL with subsequent 0.2 µL steps until no increase in respiration and respiration is maximally uncoupled (theoretical: non-coupled).
- Add 1 µL of 1 mM rotenone (ROT) for a final concentration of 0.5 µM. Add 2 µL of 1 mg/mL antimycin (AM) stock for a final concentration of 1 µg/mL.
- Reoxygenate the chambers to achieve a similar oxygen level (~150 µM) in all chambers by slowly lifting the plunger in twisting motion.
- Add 5 µL of 0.8 M ascorbate for a final concentration of 2 mM immediately followed by 5 µL of 0.2 M N,N,N′,N′-tetramethyl-p-phenylenediamine (TMPD) for a final concentration of 0.5 mM to assess complex IV activity (optional).
- Add 5 µL of 4 M azide for a final concentration of 10 mM immediately when peak O2 flux is reached with TMPD. Continue the run for >5 min to assay auto-oxidation of TMPD for complex IV base level calculation.
- Recount the cells to confirm the cell count pre-run and continue with step 1.9.
NOTE: Digitonin-permeabilization (for cells only) needs to be titrated in trial experiments to reach maximal flux and not affect mitochondrial membrane integrity (see step 1.7). Permeabilized samples (especially muscle tissue) with >10% increase in respiration rate after addition of cytochrome c should be excluded from further analysis due to outer mitochondrial membrane damage. A short-time dip in flux after the addition of EtOH-dissolved chemicals is expected.
- Use lysed (permeabilized) tissue sample or permeabilize cells by adding 1 µL of digitonin (8.1 mM digitonin stock in dimethyl sulfoxide (DMSO)) for a final concentration of 5 µg/mL to permeabilize cells. The flux will drop and should stabilize at >5 min.
- Protocol to determine optimal permeabilization conditions for cells
- Add cells as described in steps 1.2 and 1.5.2.
- Take 10 µL of 10 mg/mL digitonin stock and add 10 µL of DMSO to dilute to 5 mg/mL.
- Add 1 µL of rotenone (1 mM stock). Add 10 µL of succinate (2 mM stock) and 5 µL of ADP (0.5 M stock).
- Titrate 1 µL of digitonin (2.5 mg per step) repeatedly until respiration does not increase further and is maximal.
NOTE: A decrease in respiration indicates an excessive concentration of digitonin.
- Protocol for OXPHOS analysis in intact cells
- After routine respiration (step 1.6.1-1.6.6), add 2 µL of 0.01 mM oligomycin for a final concentration of 10 nM.
- Titrate FCCP from 2 mM stock, add 0.6 µL with subsequent 0.2 µL steps until no further increase in respiration and respiration is maximally uncoupled (theoretical: non-coupled)
- Add 1 µL of 1 mM rotenone for a final concentration of 0.5 µM. Add 2 µL of 1 mg/mL antimycin stock for a final concentration of 1 µg/mL.
- Reoxygenate the chamber to the same oxygen level (~150 µM) by slowly lifting the plunger in twisting motion.
- Add 5 µL of 0.8 M ascorbate for final concentration of 2 mM. Immediately add 5 µL of 0.2 M TMPD for a final concentration of 0.5 mM to assess complex IV activity.
NOTE: Prepare a fresh batch before any bigger set of experiments as TMPD is prone to auto-oxidation. The activity might decline over time when stored at -20 °C. - Add 5 µL of 4 M azide for a final concentration of 10 mM immediately when peak O2 flux is reached with TMPD. Continue run for >5 min to assay auto-oxidation of TMPD for complex IV base level calculation.
- Recount cells to confirm the cell count pre-run and continue with step 1.9.
- Post-run sample collection
- Collect exactly 1 mL of MiR05-suspension from each chamber (with stirrers on) into a 1.5 mL tube 1.5 mL tube.
- Centrifuge at 1000 x g for permeabilized cells or at 20,000 x g for tissue lysate. Remove the supernatant and freeze the pellet at -80 °C for further processing (section 3).
- Analysis of SUIT protocols
- Analyze oxygen flux (pmol/s, normalized to input) at each plateau after adding a substrate or inhibitor (Figure 1C and Figure 3A). Export the values to a spreadsheet.
- Subtract the residual oxygen consumption (ROX, Figure 1C and Figure 3C) value from all values of each experimental run. Subtract azide residual respiration from TMPD to obtain complex IV respiration.
- Plot the absolute values normalized for cell (Figure 3A, B) or tissue input (Figure 5A,B). Calculate the flux control ratios (step 1.11) or normalize them to protein input (Figure 3C).
- Flux control ratio calculation
- Acquire an index of respiratory function and coupling control using flux control ratios (FCR)9,26.
NOTE: This allows assessing intrinsic mitochondrial quality, independent of mitochondrial quantity. In addition, flux control ratios (FCR) are comparable within the same cell lines allowing for reagent quality control (respective FCRs are obtained through the indicated numbered reference values in Figure 1B-D and Figure 3C). - Calculate the respiratory control ratio for the coupling of OXPHOS to LEAK using Equation 1.
Equation 1: FCRADP = 5/6 = State 3 / State 4 - Calculate the FCR to assess NADH-dependent respiration using Equation 2
Equation 2: FCRstate 3 (I) = 3/5 = State 3 (I) / State 3 (I+II) - Calculate the FCR to assess Succinate-dependent respiration using Equation 3.
Equation 3: FCRstate 3 (II) = 8/7 = Srot / ETScapacity - Calculate the FCR to assess coupled to uncoupled using Equation 4.
Equation 4: FCRcoupled/uncoupled = 5/7 = State 3 (I+II) / ETScapacity - To test mitochondrial outer membrane integrity, use Equation 5.
Equation 5: % mitochondrial outer membrane damage = 3/4 = State 3 (I) / State 3 (I) with cyt c
- Acquire an index of respiratory function and coupling control using flux control ratios (FCR)9,26.
2. High-resolution respirometry: Microplate-based respirometer (mHRR)
NOTE: The experiments in this section of the protocol were performed using the Seahorse XFe96 Extracellular Flux Analyzer (Table of Materials)
- Cell culture
- Culture any type of cell. Adherents (e.g., collagen, laminin) might be used to facilitate cell attachment. Here, HEK293 cells are cultured as before (step 1.3).
- The day before the experiment, detach the cells and transfer them into a designated mHRR 96-well microplate to obtain ideal confluency on the day of the experiment (80%-100%) (Figure 2C).
NOTE: For mHRR, microplate cell densities are critical. Individual growth properties of cells lines or treatments affecting growth need to be accounted for to ensure comparable confluency on the day of the experiment.
- Preparation of cells for high-resolution respirometry
- Harvest and resuspend the cells sufficiently prior to seeding
NOTE: It is recommended to seed cells from the same dilution for replicates. - Seed the cells according to growth rates of individual cell lines or growth properties under treatment.
NOTE: Optimize on a standard 96-well microplate and extrapolate the cell density to a 96-well assay-specific microplate. In this setup, 7 x 10⁴ HEK293 WT cells were seeded per well of a 96-well. The first and last columns of the 96-well plate are used for protein determination (Figure 2C). The four corner wells should not contain any cells and are used for experimental background correction. Ideally, wells close to the edges are empty to minimize edge effect (e.g., cells show altered growth rates caused by temperature effects) (Figure 2C, D).
- Harvest and resuspend the cells sufficiently prior to seeding
- Preparation of sensor plates, loading of inhibitors
- On the day of the assay, supplement 38.8 mL of medium with 0.4 mL of 1 M Glucose, 0.4 mL of 200 mM Glutamine, and 0.4 mL of 100 mM Na-Pyruvate.
NOTE: mHRR respiration requires a specialized non-buffered DMEM medium at pH 7.4. In general, 40 mL should suffice for one experiment with one 96-well microplate. - Warm the respiration assay medium to 37 °C and exchange the cell culture medium for the respiration assay medium by washing twice with 80 µL per well.
- Set the plate with the cells in a 37 °C incubator without CO2 for 60 min prior to the assay.
NOTE: This step is essential to degas the plate as CO2 can affect respiration results, and serum in the medium can produce bubbles during the assay. - Prewarm inhibitor aliquots for OM, FCCP, ROT, and AM to 37 °C and take the sensor plate out of the incubator.
- Dilute OM, FCCP, ROT, and AM in 3 mL of assay medium to a final well concentration of 1.5 µM, 1.125 µM, and 1 µM, respectively. Fill into separate ports as indicated in Figure 2E.
NOTE: A multichannel pipette is recommended to fill the sensor cartridge. Since pressurized air is used to inject compounds, all ports must be filled with an equal amount of liquid volume whenever a port is filled with a compound. ROT and AM can be combined in one port. Inhibitors can be dissolved in EtOH or DMSO. - Inspect the injection ports and verify an even loading volume for each port.
NOTE: All ports contain a hole at the bottom for injection. Care should be taken when moving the sensor plate. Air bubbles can be removed using a needle.
- On the day of the assay, supplement 38.8 mL of medium with 0.4 mL of 1 M Glucose, 0.4 mL of 200 mM Glutamine, and 0.4 mL of 100 mM Na-Pyruvate.
- Protocol for oxygen assessment in intact cells
- On the day before the assay, perform steps 2.4.2-2.4.7.
- Aliquot 20 mL of the calibrant solution into a 50 mL conical tube.
- Open the Extracellular Flux Assay Kit and remove the contents.
- Place the sensor cartridge inverted next to the utility plate. Pipette 200 µL of calibrant solution into each well of the utility plate.
- Attach the sensor cartridge onto the utility plate paying attention that all sensors are submerged.
- Set the plate into a 37 °C incubator without CO2 overnight or a minimum of 12 h. Verify that the humidity inside the incubator is sufficient to prevent evaporation of the calibrant.
- Turn on the microplate-based system and computer to be ready to use the next day (the machine requires a minimum of 3 h to equilibrate to 37 °C prior to conducting an assay).
NOTE: For signal stability, increase measurement points to 6 instead of 3 measurement cycles per respiratory state. Each cycle consists of 3 min of mixing and 3 min of measuring. - On the day of the XF assay, perform steps 2.4.9-2.4.20.
- Verify the confluency of the cell culture plate, the morphology of the cells, and that background wells are empty.
- Wash the cells with the prepared respiration medium as mentioned in steps 2.4.11-2.4.12.
- Remove all but 20 µL of the culture medium from each well. Remove 55 µL if the culture medium was 80 µL due to evaporation overnight (approximately 5 µL).
- Wash cells twice with 90 µL of assay medium. Finally, add 100 µL of assay medium. The end volume should be 120 µL.
NOTE: A multichannel pipette is recommended for this step to ensure the same washing procedure has been applied to each experimental condition (depends on the plate setup). When aspirating, tilt the plate to a 45° angle and place the pipette tips in the corner of the wells for aspiration and injection of liquids. It is imperative to take care during the washing as certain cells may easily detach from the bottom of the cell culture plate. - Set the plate in a 37 °C incubator without CO2 for 60 min prior to the assay.
- Retrieve the hydrated sensor cartridge plate from the CO2-free incubator.
- Discard the old calibrant solution and replace it with fresh calibrant solution, prewarmed to 37 °C.
- Prepare inhibitors and assay medium (3 mL per inhibitor for a total of 12 mL of assay medium) and use a pipette reservoir for the inhibitor loading into ports.
- Open the software and run a pre-designed or new template. Fill the plate map, adjust the titrations and measurement cycles, and then press Start to initiate the calibration of the optical sensors.
- Remove the lid from the loaded cartridge and place it in the slot that automatically slides out of the machine, verifying that the markings on the lower right corner of the plate line up with the triangle on the lower right corner of the slot.
- Click on Continue to perform automatic calibration, lasting approximately 20 min.
- After calibration, remove the utility plate containing the calibrant.
- Remove the lid from the microplate containing the cells and place the plate in the slot when prompted by the machine. Click on Continue to start the run.
- Post-run sample collection
- Take the plate out of the machine, carefully remove the remaining assay media without disturbing the cells and freeze the entire plate at -80 °C for further processing (section 3).
3. Determination of protein using the bicinchoninic acid assay (BCA assay)
- Prepare diluted bovine serum albumin (BSA) in buffer used for protein extraction and compatible with BCA: 2 mg/mL, 1.5 mg/mL, 1 mg/mL, 0.5 mg/mL, 0.25 mg/mL and 0 mg/mL for standard curve in duplicates.
- Extract proteins by resuspending in an appropriate lysis buffer (e.g., RIPA) with 20 µL per well for mHRR or 100 µL per pellet contained within a 1.5 mL tube for cHRR.
- Incubate the mHRR plate or 1.5 mL tube containing protein lysates for 30 min on ice.
- Centrifuge the 1.5 mL tube containing the protein lysate at 4 °C at 20,000 x g for 20 min and transfer the resulting supernatant to a new clean 1.5 mL tube.
- Use 10 µL per sample in duplicates and standards in a microtiter plate. Add 200 µL of BCA working reagent and incubate for >15 min.
- Read the plate in a standard spectrophotometer at a wavelength of 562 nm and calculate the protein concentrations using a BSA standard curve.
- Normalize the respiration results to the protein concentration.
NOTE: Normalization to protein amount allows to corroborate cell seeding densities or wet weight input. The extracted proteins are suitable for subsequent immunoblotting against subunits of the ETS for example but do not fully represent the native sample (e.g., loss of phosphorylation sites).
Wyniki
Here, we provide protocols to determine the mitochondrial bioenergetics in eukaryotic cells, non-fibrous tissue (e.g., cerebellum), and fibrous tissue (e.g., skeletal muscle). For eukaryotic cells, HEK293 with CRISPR-engineered knockout of two different proteins associated with mitochondrial translation resulting in multiple (CRISPRKO1) and severe/complete OXPHOS deficiency (CRISPRKO2) were measured with either cHRR (Figure 3A-C) or mHR...
Dyskusje
Traditionally, mitochondrial bioenergetics has been studied with Clark-type oxygen electrodes. A lack of resolution and throughput, however, warranted for technological advancement. To date, the O2k (referred to as cHRR) and Seahorse XF96 Flux Analyzer (referred to as mHRR) have been widely adopted in the field of cellular bioenergetics. Here, we present a comprehensible collection of protocols for the analysis of cellular energy metabolism via assessment of mitochondrial respiration using either cHRR or mHRR, discu...
Ujawnienia
No conflict of interest to disclose.
Podziękowania
This work was supported by funding from the Academy of Finland (C.B.J), the Magnus Ehrnroot Foundation (C.B.J), and a Doctoral fellowship of the Integrated Life Sciences Graduate School (R.A.).
Materiały
| Name | Company | Catalog Number | Comments |
| 2 mL Potter-Elvehjem Glass/PTFE Tissue Grinder/Homogenizer | Omni International | 07-358029 | |
| 95% O2, 5% CO2 medical gas mixture | Potter for tissue grinding | ||
| ADP | Sigma | A 4386 | |
| Antimycin A | Sigma | A 8674 | Chemical |
| Ascorbate | Merck | PHR1279-1G | Chemical, dissolve in ethanol |
| BSA (fatty accid free) | Sigma | A 6003 | Chemical |
| CaCO3 | Sigma | C 4830 | Chemical |
| Cytochrome c | Sigma | C 7752 | Chemical |
| Digitonin | Sigma | D 5628 | Chemical |
| Dithiothreitol | Sigma | D 0632 | Chemical, dissolve in DMSO |
| D-Sucrose | Roth | 4621.1 | Chemical |
| Dulbecco’s modified Eagle’s medium (High glucose) | Fisher Scientific | 41965-039 | Chemical |
| Dulbecco’s modified Eagle’s medium (No Glucose) | Fisher Scientific | A14430-01 | |
| EGTA | Sigma | E 4378 | |
| Etomoxir | Sigma | E1905 | Chemical |
| Falcon 15 ml Conical Centrifuge Tubes | Fisher Scientific | AM12500 | Chemical |
| Falcon 50 ml Conical Centrifuge Tubes | Fisher Scientific | AM12501 | |
| FCCP | Sigma | C 2920 | |
| Glucose | Sigma | G7021 | Chemical, dissolve in ethanol |
| Glutamate | Sigma | G 1626 | Chemical |
| GlutaMax (100x) (200 nM L-alanyl-L-glutamine dipeptide) | Fisher Scientific | 35050061 | Chemical |
| HEK293 cells | ATTC | CRL-1573 | |
| Hemocytometer | Fisher Scientific | 0267151B | Instrument for cell counting |
| Hepes | Sigma | H 7523 | Chemical |
| Imidazole | Fluka | 56750 | Chemical |
| KCl | Merck | 1.04936 | Chemical |
| L-carnitine | Sigma | C0283 | Chemical |
| Malate | Sigma | M 1000 | Chemical |
| MES hydrate | Sigma | M8250 | Chemical |
| MgCl2 | Sigma | M 9272 | Chemical |
| Na2ATP | Sigma | A 2383 | Chemical |
| Na2Phosphocreatine | Sigma | P 7936 | Chemical |
| Na-pyruvate (100 mM) (100x) | Fisher Scientific | 11360070 | |
| NEAA (Non-essential amino acids) 100x | Fisher Scientific | 11140035 | |
| Normal FBS (10x) | Fisher Scientific | 10500064 | |
| O2k-Core: Oxygraph-2k | Oroboros Instruments | 10000-02 | High-resolution respirometry instrument |
| O2k-Titration Set | Oroboros Instruments | 20820-03 | Hamilton syringes for chemical injections |
| Oligomycin | Sigma | O 4876 | Chemical, dissolve in ethanol |
| Palmitoylcarnitine | Sigma | P 4509 | Chemical |
| Penicillin-Streptomycin | Fisher Scientific | 15140122 | |
| Pierce BCA Protein Assay Kit | Fisher Scientific | 23227 | |
| Pyruvate | Sigma | P 2256 | Chemical |
| RIPA-Buffer | Fisher Scientific | 89900 | Chemical |
| Rotenone | Sigma | R 8875 | Chemical, dissolve in ethanol |
| Saponin | Sigma | S7900 | Chemical |
Seahorse XF DMEM assay medium pack, pH 7.4 | Agilent, Santa Clara, CA | 103680-100 | |
| Seahorse XFe96 Extracellular Flux Analyzer | Agilent, Santa Clara, CA | High-throughput respirometry instrument | |
| Seahorse XFe96 FluxPak | Agilent, Santa Clara, CA | Includes assay plates, cartridges, loading guides for transferring compounds to the assay cartridge, and calibrant solution. | |
| Small scissors | Fisher Scientific | 08-951-20 | |
| Sodium azide | Sigma | S2002 | Chemical |
| Succinate | Sigma | S 2378 | Chemical |
| Taurine | Sigma | T 8691 | Chemical |
| TMPD | Sigma | T 3134 | Chemical |
| Trypan Blue solution | Merck | 72-57-1 | Chemical |
| Trypsin 0.25% EDTA | Fisher Scientific | 25200056 | |
| Two thin-edged forceps | Fisher Scientific | 12-000-122 | |
| Uridine stock (500x) | Sigma | U3750 | Chemical |
Odniesienia
- McBride, H. M., Neuspiel, M., Wasiak, S. Mitochondria: More than just a powerhouse. Current Biology. 16 (14), 551-560 (2006).
- Mehta, M. M., Weinberg, S. E., Chandel, N. S. Mitochondrial control of immunity. Beyond ATP. Nature Reviews Immunology. 17 (10), 608-620 (2017).
- Spinelli, J. B., Haigis, M. C. The multifaceted contributions of mitochondria to cellular metabolism. Nature Cell Biology. 20 (7), 745-754 (2018).
- Gnaiger, E. Capacity of oxidative phosphorylation in human skeletal muscle. New perspectives of mitochondrial physiology. International Journal of Biochemistry and Cell Biology. 41 (10), 1837-1845 (2009).
- Gorman, G. S., et al. Mitochondrial diseases. Nature Reviews Disease Primers. 2, 1-23 (2016).
- Boushel, R., Gnaiger, E., Schjerling, P., Skovbro, M., Kraunsøe, R., Dela, F. Patients with type 2 diabetes have normal mitochondrial function in skeletal muscle. Diabetologia. 50 (4), 790-796 (2007).
- Cogliati, S., et al. Mitochondrial cristae shape determines respiratory chain supercomplexes assembly and respiratory efficiency. Cell. 155 (1), 160-171 (2013).
- Kühlbrandt, W. Structure and function of mitochondrial membrane protein complexes. BMC Biology. 13, 1-11 (2015).
- Gnaiger, E. Mitochondrial pathways and Respiratory control. An introduction to OXPHOS analysis. Bioenergetics communications. 5th ed. , (2020).
- Jackson, C. B., et al. Mutations in SDHD lead to autosomal recessive encephalomyopathy and isolated mitochondrial complex II deficiency. Journal of Medical Genetics. 51 (3), 170-175 (2014).
- Pesta, D., Gnaiger, E. High-resolution respirometry: OXPHOS protocols for human cells and permeabilized fibers from small biopsies of human muscle. Methods in Molecular Biology. 810, 25-58 (2012).
- Horan, M. P., Pichaud, N., Ballard, J. W. O. Review: Quantifying mitochondrial dysfunction in complex diseases of aging. Journals of Gerontology - Series A Biological Sciences and Medical Sciences. 67 (10), 1022-1035 (2012).
- Doerrier, C., Garcia-Souza, L. F., Krumschnabel, G., Wohlfarter, Y., Mészáros, A. T., Gnaiger, E. High-resolution fluorespirometry and oxphos protocols for human cells, permeabilized fibers from small biopsies of muscle, and isolated mitochondria. Methods in Molecular Biology. 1782, 31-70 (2018).
- Zhang, J., et al. Measuring energy metabolism in cultured cells, including human pluripotent stem cells and differentiated cells. Nature Protocols. 7 (6), 1068-1085 (2012).
- García-Roche, M., Casal, A., Carriquiry, M., Radi, R., Quijano, C., Cassina, A. Respiratory analysis of coupled mitochondria in cryopreserved liver biopsies. Redox Biology. 17, 207-212 (2018).
- Acin-Perez, R., et al. A novel approach to measure mitochondrial respiration in frozen biological samples. The EMBO Journal. 39 (13), 1-18 (2020).
- Cell metabolism assay kits. Seahorse assay kits and media Available from: https://www.agilent.com/en/product/cell-analysis/real-time-cell-metabolic-analysis/xf-assay-lits-reagents-cell-assay-media (2021)
- Chance, B., Williams, G. R. A method for the localization of sites for oxidative phosphorylation. Nature. 176 (4475), 250-254 (1955).
- Gnaiger, E., et al. Mitochondrial respiratory states and rates. MitoFit Preprint Arch. , (2019).
- Gnaiger, E. O2k-procedures: SOP O2k quality control 1: Polarographic oxygen sensors and accuracy of calibration Section Page. Oroboros. 03 (18), 1-21 (2020).
- Robinson, B. H., Petrova-Benedict, R., Buncic, J. R., Wallace, D. C. Nonviability of cells with oxidative defects in galactose medium: A screening test for affected patient fibroblasts. Biochemical Medicine and Metabolic Biology. 48 (2), 122-126 (1992).
- King, M. P., Attardi, G. Human cells lacking mtDNA: Repopulation with exogenous mitochondria by complementation. Science. 246 (4929), 500-503 (1989).
- Makrecka-Kuka, M., Krumschnabel, G., Gnaiger, E. High-resolution respirometry for simultaneous measurement of oxygen and hydrogen peroxide fluxes in permeabilized cells, tissue homogenate and isolated mitochondria. Biomolecules. 5 (3), 1319-1338 (2015).
- Fasching, M., Gnaiger, E. O2k quality control 2: Instrumental oxygen background correction and accuracy of oxygen flux. Mitochondrial Physiology Network. 14 (06), 1-14 (2016).
- Gnaiger, E., Lassnig, B., Kuznetsov, A., Rieger, G., Margreiter, R. Excess capacity of cytochrome c oxidase. Journal of Experimental Biology. 1139, 1129-1139 (1998).
- Gnaiger, E., et al. Mitochondria in the Cold. Life in the Cold. , 431-442 (2000).
- Fontana-Ayoub, M., Fasching, E., Gnaiger, Selected media and chemicals for respirometry with mitochondrial preparations. Mitochondrial Physiology Network. 02 (17), 1-9 (2014).
- Gerencser, A. A., et al. Quantitative microplate-based respirometry with correction for oxygen diffusion. Analytical Chemistry. 81 (16), 6868-6878 (2009).
- Krumschnabel, G., Eigentler, A., Fasching, M., Gnaiger, E. Use of safranin for the assessment of mitochondrial membrane potential by high-resolution respirometry and fluorometry. Methods in Enzymology. 542, 163-181 (2014).
- Nászai, A., Terhes, E., Kaszaki, J., Boros, M., Juhász, L. Ca(2+)N it be measured? Detection of extramitochondrial calcium movement with high-resolution fluorespirometry. Scientific Reports. 9 (1), 1-13 (2019).
- Pajak, B., et al. 2-Deoxy-d-Glucose and its analogs: From diagnostic to therapeutic agents. International Journal of Molecular Sciences. 21 (1), 234 (2019).
- Mercier-Letondal, P., Marton, C., Godet, Y., Galaine, J. Validation of a method evaluating T cell metabolic potential in compliance with ICH Q2 (R1). Journal of Translational Medicine. 19 (1), 1-15 (2021).
- Sauerbeck, A., et al. Analysis of regional brain mitochondrial bioenergetics and susceptibility to mitochondrial inhibition utilizing a microplate based system. Journal of Neuroscience Methods. 198 (1), 36-43 (2011).
- Jackman, M. R., Willis, W. T. Characteristics of mitochondria isolated from type I and type IIb skeletal muscle. American Journal of Physiology - Cell Physiology. 270 (2), 673-678 (1996).
- Ponsot, E., et al. Mitochondrial tissue specificity of substrates utilization in rat cardiac and skeletal muscles. Journal of Cellular Physiology. 203 (3), 479-486 (2005).
- Schönfeld, P., Reiser, G. Why does brain metabolism not favor burning of fatty acids to provide energy-Reflections on disadvantages of the use of free fatty acids as fuel for brain. Journal of Cerebral Blood Flow and Metabolism. 33 (10), 1493-1499 (2013).
- Calderon-Dominguez, M., Mir, J. F., Fucho, R., Weber, M., Serra, D., Herrero, L. Fatty acid metabolism and the basis of brown adipose tissue function. Adipocyte. 5 (2), 98-118 (2016).
- Divakaruni, A. S., Rogers, G. W., Murphy, A. N. Measuring mitochondrial function in permeabilized cells using the seahorse XF analyzer or a clark-type oxygen electrode. Current Protocols in Toxicology. 2014, 1-16 (2014).
- Iuso, A., Repp, B., Biagosch, C., Terrile, C., Prokisch, H. Assessing mitochondrial bioenergetics in isolated mitochondria from various mouse tissues using Seahorse XF96 analyzer. Methods in Molecular Biology. 1567, 217-230 (2017).
- Rogers, G. W., et al. High throughput microplate respiratory measurements using minimal quantities of isolated mitochondria. PLoS ONE. 6 (7), 21746 (2011).
- Jordá, A., Zaragozá, R., Portolés, M., Báguena-Cervellera, R., Renau-Piqueras, J. Long-term high-protein diet induces biochemical and ultrastructural changes in rat liver mitochondria. Archives of Biochemistry and Biophysics. 265 (2), 241-248 (1988).
- Jackson, C. B., Gallati, S., Schaller, A. QPCR-based mitochondrial DNA quantification: Influence of template DNA fragmentation on accuracy. Biochemical and Biophysical Research Communications. 423 (3), 441-447 (2012).
- Hirsch, H. M. Tissue autoxidation inhibitors: II. The presence of inhibitor in intact cells; Assay of liver and hepatoma effect on radio-oxidations. Cancer Research. 16 (11), 1076-1082 (1956).
- Picard, M., et al. Mitochondrial structure and function are disrupted by standard Isolation methods. PLoS ONE. 6 (3), 18317 (2011).
- Tanumihardja, E., Slaats, R. H., Van Der Meer, A. D., Passier, R., Olthuis, W., Van Den Berg, A. Measuring both pH and O2 with a single On-Chip sensor in cultures of human pluripotent stem cell-derived cardiomyocytes to track induced changes in cellular metabolism. ACS Sensors. 6 (1), 267-274 (2021).
- Harms, F., Stolker, R. J., Mik, E. Cutaneous respirometry as novel technique to monitor mitochondrial function: A feasibility study in healthy volunteers. PLoS ONE. 11 (7), 159544 (2016).
- Levitsky, Y., et al. Micro-respirometry of whole cells and isolated mitochondria. RSC Advances. 9 (57), 33257-33267 (2019).
Przedruki i uprawnienia
Zapytaj o uprawnienia na użycie tekstu lub obrazów z tego artykułu JoVE
Zapytaj o uprawnieniaThis article has been published
Video Coming Soon
Copyright © 2025 MyJoVE Corporation. Wszelkie prawa zastrzeżone