JoVE Logo

Войдите в систему

Internal Standards

Обзор

Source: Laboratory of Dr. B. Jill Venton - University of Virginia

The goal of many chemical analyses is a quantitative analysis, where the amount of a substance in a sample is determined. In order to accurately calculate the concentration of an unknown from a sample, careful sample preparation is key. Every time a sample is handled or transferred, some of the sample can be lost. There are strategies however, for minimizing sample loss. There are also strategies for coping with sample loss and still making accurate measurements of concentration.

To minimize sample loss, the ideal is to minimize the number of sample handling and transfer steps. For example, massing a solid sample directly into a flask that a solution will be made in reduces a transfer step. If it's necessary to transfer from one flask to another and a dilution is being made, then triple rinsing the glassware helps ensure all the sample is transferred. Other strategies are more specific to the sample. For example, samples that adsorb to glass, such as proteins, might better be handled in polypropylene disposable tubes. The tubes are not hydrophilic, so if a small amount of sample is to be pipetted in water, it is best to have already added the water to the tube, so the sample can be pipetted directly into the solvent. It may be better to concentrate, rather than completely dry a sample, due to losses from insolubilities after rehydration.

Another source of sample loss is through incomplete sample manipulations. For example, if a derivatization procedure is used and the derivatization is incomplete, then the full amount of sample is not observed. Errors such as this are systematic errors, and can be solved by correcting the problem, such as changing the derivatization procedure. Another cause of systematic error in measurements is matrix effects. These can interfere with measurement of certain substances and performing calibrations in the same matrix as the sample can reduce this effect.

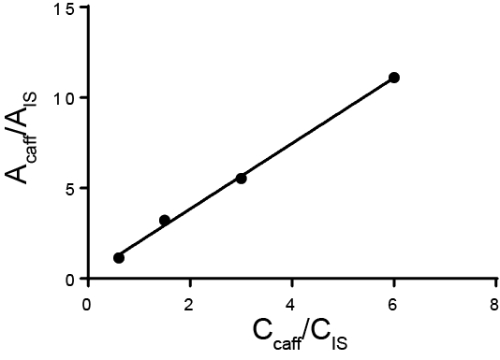
Quantitative analysis is typically carried out using either external or internal standards. For external standards, a calibration curve is made by measuring different known concentrations of the analyte of interest. Then, the sample is run separately from the standard. For internal standards, the standard is in the same sample as the analyte of interest, allowing the measurement to be taken simultaneously. Typically, a different species is added called the internal standard and the ratio of the response for that internal standard and the analyte is calculated. The idea is that the ratio of the response, called the response factor, is proportional to their concentration. While the method must be able to distinguish between the analyte of interest and the internal standard, any sample losses that occur after the internal standard is added should be similar for both substances and thus the ratio of the response stays the same. A special case of using internal standards is the method of standard additions, where increasing amounts of the analyte is added to the solution and the original amount of analyte is back-calculated. Internal standards can be used in chromatography, electrochemistry, and spectroscopy.

Принципы

An internal standard is a substance added in a constant amount to a sample, blank, and standard in an analysis. An internal standard can compensate for both systematic and random errors. For example, if there are instrument fluctuations that cause random errors in the measurement, these fluctuations are expected to be the same for both the internal standard and the analyte and thus the ratio of signals does not change. For systematic errors, such as matrix effects of the solvent, as long as the effect is equal for both the standard and the analyte, the ratio is again unaffected.

The disadvantage of internal standards is that it is hard to find a suitable internal standard. The internal standard must have a signal that is similar to the analyte, but different enough that it can be distinguished by the instrument. Also, the internal standard should not be present in the sample matrix, so that the added standard is the only source of the standard. Occasionally, a major constituent of a sample that is constant in concentration can be used as the internal standard instead of an added standard, but the concentration must be well known for that constituent. The internal standard should also not suppress or enhance the signal of the analyte.

In chromatography, one of the largest sources of error is often the injection. If manual injections are used, there can be errors in loading the syringe properly. Volumes are typically small (~1 µL) so there are uncertainties in reproducibly injecting this small a volume, often a couple of percent relative standard deviation (RSD). In gas chromatography (GC), the sample is injected into a heated port and evaporation from the needle tip can result in variations in volume injected. Auto-samplers help with both the error in loading the syringe and the error in injecting quickly to avoid evaporation in GC, but the error can still be 1–2% RSD. With chromatography, peak area is generally used instead of peak height, as the peaks get wider and shorter with time but the peak area is constant. Thus, for internal standards, ratios of peak areas are used in chromatography instead of peak heights.

For a calibration with an internal standard, a response factor is calculated. The response factor (R) is the ratio of the peaks compared to the ratio of the concentrations where X is the analyte and IS is the internal standard.

Equation 1

For chromatography area (A) is used. The response factor can be calculated from a calibration plot of AX/AIS vs CX/CIS, where the response factor is the slope and the y-intercept is assumed to be 0. Once the response factor is known for standards, then the response of the unknown can be calculated from the measured area ratio from the experiment.

Equation 2

Процедура

1. Proper Sample Handling: Making a Solution

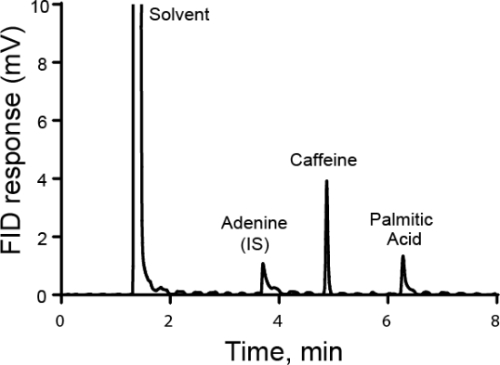
  1. Take a clean beaker and mass the correct amount of sample into it. Record the actual mass used. In this example, a solution of adenine is made in a volumetric flask for use as an internal standard for the next analysis. The mass of adenine is 100 mg. Do not directly mass into a volumetric flask because it has a long neck and the adenine cannot be easily added or removed.
  2. Add roughly 25 mL of solvent (in this case dimethyl sulfoxide (DMSO)) to the beaker and let it stir to dissolve. In this example, the final solution is made in a 50-mL volumetric flask, so only add about 25 mL so the beaker can be rinsed and the solution made up to the final volume.
  3. Once the solid has dissolved, pour the solution into the volumetric flask.
  4. Rinse the beaker and the stir bar with small amounts of solvent, about 10 mL, and pour the rinse into the volumetric flask. Repeat twice more. This helps ensure proper solution transfer.

2. Preparation of an Internal Standard Calibration Curve

  1. Prepare the desired standard samples for gas chromatography analysis. In this example, caffeine is extracted from coffee using acetonitrile and then adenine is used as an internal standard for measurement.
  2. For the caffeine samples, weigh out the amount of sample needed to make 1 mg/mL sample. If using a 10-mL volumetric flask, that is 10 mg.
  3. Weigh the analyte into a beaker, add a few mL of solvent (here methanol) to dissolve, then quantitatively transfer to the volumetric flask using 3 rinses.
  4. Make 3 more standards in a similar manner with 0.2, 0.5, and 2 mg/mL caffeine.
  5. Put 1 mL of each caffeine standard into a sample vial.
  6. Add 0.2 mL of 2 mg/mL adenine internal standard to each sample vial.
  7. Run the gas chromatography experiment with each caffeine standard. For each chromatogram, calculate the ratio of peak areas for the caffeine vs the standard.
  8. Make a plot of the area ratio vs the concentration ratio. The slope of that plot is the response factor.

3. Preparation of a Real Sample with Internal Standard for Gas Chromatography

  1. Prepare the desired sample for gas chromatography analysis. In this example, caffeine is extracted from coffee using acetrontrile.
  2. For the coffee sample, mass out 2 g of coffee into a 100-mL beaker. Record the exact weight of the coffee.
  3. Add 20 mL of acetonitrile to the beaker.
  4. Allow it to sit for 20 min, stirring frequently.
  5. Filter the coffee grounds out using a filter paper in a funnel.
  6. Rinse the filter paper 3x with small amounts of acetonitrile (5 mL).
  7. Measure the final volume of the filtrate. It should be about 35 mL.

4. Run the Sample and Calculate the Concentration

  1. Take 1 mL of the coffee extract sample and add 0.2 mL of the internal standard in a vial. Place the vial into auto-sampler rack.
  2. Run a GC analysis of the sample. Make sure that the GC conditions are such that the caffeine and adenine separate. In this example, isothermal separations are performed at 200 °C.
  3. After the analysis, compute the peak area for both the internal standard peak and the analyte peak. Using their ratios, calculate the amount of caffeine in the sample.

5. Results: GC Analysis of Caffeine with Internal Standard

  1. GC analysis of caffeine is shown in Figure 1. Adenine is used as an internal standard. The ratio of peak areas can be measured and plotted vs the ratio of the concentrations. The slope of the plot is the response factor (in this case 1.8).
  2. Figure 2 shows a chromatogram of a coffee sample with adenine internal standard. The ratio of the peak area is 1.78. Using the response factor and the known concentration of adenine (0.33 mg/mL), the concentration of caffeine in the unknown sample is calculated to be 0.33 mg/mL.

Figure 1
Figure 1. Calibration plot using an internal standard. A plot of the area ratios vs concentration ratios for 3 standard samples of caffeine (1, 0.5, and 0.2 mg/mL) with 0.33 mg/mL adenine internal standard added to each. The slope of the line is 1.8, which is the response factor.

Figure 2
Figure 2. Chromatogram of coffee with adenine internal standard. A plot of the response of the FID detector to samples. The three main peaks are adenine (IS), caffeine, and palmitic acid.

Заявка и Краткое содержание

Internal standards are used in many fields, including spectroscopy and chromatography. In spectroscopy, internal standards can help correct for random errors due to changes in light source intensity. If a lamp or other light source has variable power, it will affect the absorption and consequently, emission of a sample. However, the ratio of an internal standard to analyte will stay constant, even if the light source does not. One example of this is using lithium (Li) as an internal standard for the analysis of sodium in a blood sample by flame spectroscopy. Li is chemically similar to sodium but is not natively found in blood.

For chromatography, internal standards are often used in both gas chromatography and liquid chromatography. For applications with mass spectrometry as the detector, the internal standard can be an isotopically-labeled analyte, so that the molecular weight (MW) will be different than the analyte of interest. Internal standards are commonly used in pharmaceutical or environmental analyses.

Теги

Internal StandardSample LossConcentrationAccurate CalculationsCareful Sample PreparationSample HandlingTransfer StepsSystematic ErrorsMatrix EffectsAnalytic ProcedureSpecies SimilarCompound Of InterestKnown ConcentrationSample LossesInternal StandardLab TechniqueUnknown ConcentrationChromatographySpectroscopySignal RatioResponse Factor

Перейти к...

0:00

Overview

1:14

Principles of Internal Standards

3:38

Preparation of an Internal Standard Calibration Curve

5:13

Preparation of a Real Sample with an Internal Standard

7:05

Applications

8:54

Summary

Видео из этой коллекции:

article

Now Playing

Internal Standards

Analytical Chemistry

204.6K Просмотры

article

Sample Preparation for Analytical Characterization

Analytical Chemistry

84.6K Просмотры

article

Method of Standard Addition

Analytical Chemistry

319.8K Просмотры

article

Calibration Curves

Analytical Chemistry

796.0K Просмотры

article

Ultraviolet-Visible (UV-Vis) Spectroscopy

Analytical Chemistry

622.9K Просмотры

article

Raman Spectroscopy for Chemical Analysis

Analytical Chemistry

51.2K Просмотры

article

X-ray Fluorescence (XRF)

Analytical Chemistry

25.4K Просмотры

article

Gas Chromatography (GC) with Flame-Ionization Detection

Analytical Chemistry

281.7K Просмотры

article

High-Performance Liquid Chromatography (HPLC)

Analytical Chemistry

384.0K Просмотры

article

Ion-Exchange Chromatography

Analytical Chemistry

264.3K Просмотры

article

Capillary Electrophoresis (CE)

Analytical Chemistry

93.7K Просмотры

article

Introduction to Mass Spectrometry

Analytical Chemistry

112.2K Просмотры

article

Scanning Electron Microscopy (SEM)

Analytical Chemistry

87.1K Просмотры

article

Electrochemical Measurements of Supported Catalysts Using a Potentiostat/Galvanostat

Analytical Chemistry

51.3K Просмотры

article

Cyclic Voltammetry (CV)

Analytical Chemistry

124.9K Просмотры

JoVE Logo

Исследования

Образование

О JoVE

Авторские права © 2025 MyJoVE Corporation. Все права защищены