
A titration curve is a plot of some solution property versus the amount of added titrant. For acid-base titrations, solution pH is a useful property to monitor because it varies predictably with the solution composition and, therefore, may be used to monitor the titration’s progress and detect its endpoint. Acid-base titration can be performed with a strong acid and a strong base, a strong acid and a weak base, or a strong base and a weak acid.
For a titration carried out for 25.00 mL of 0.100 M HCl (strong acid) with 0.100 M of a strong base NaOH, its titration curve can be seen in red in Figure 1a. For a titration carried out for 25.00 mL of 0.100 M CH3COOH (weak acid) with 0.100 M NaOH, its titration curve can be seen in yellow in Figure 1b.
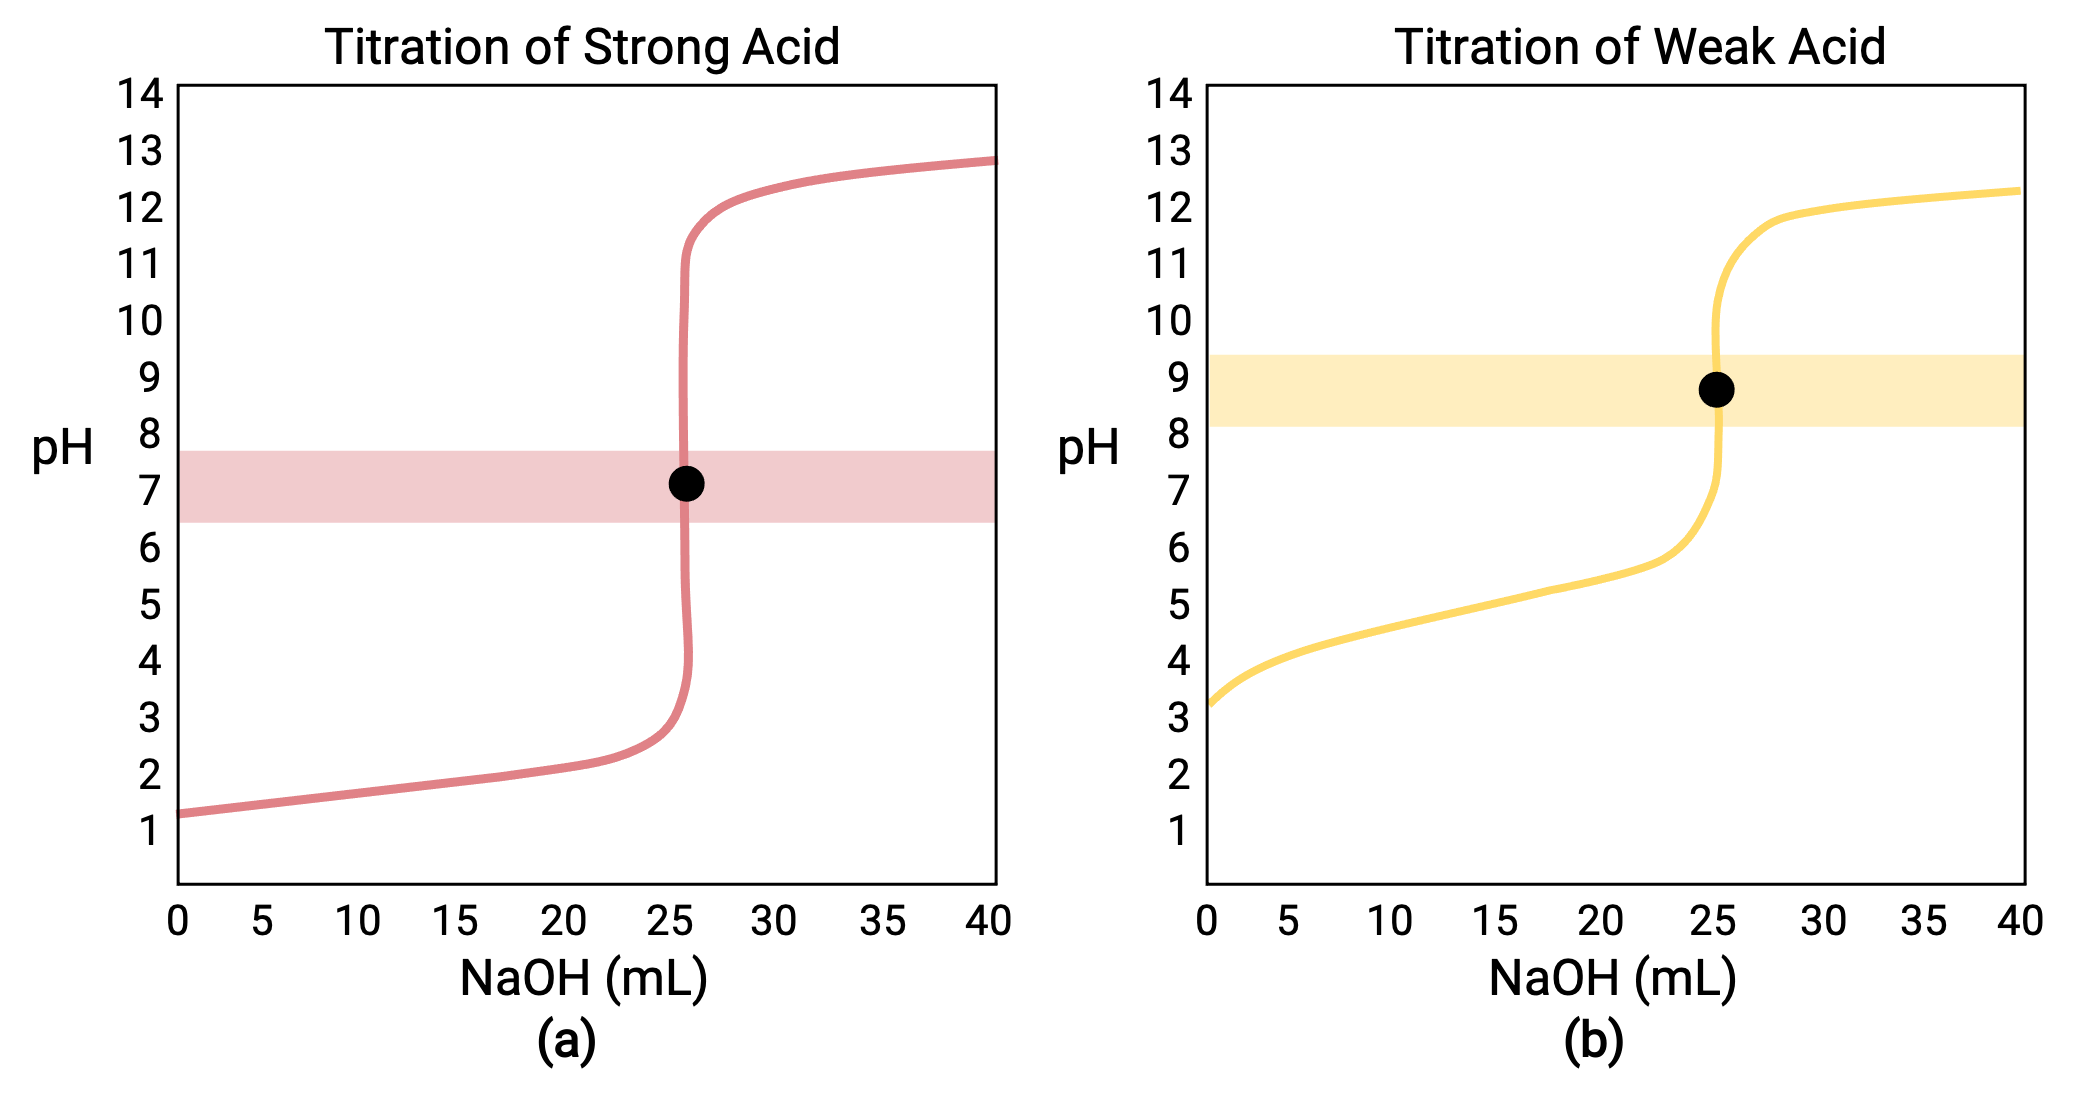
Figure 1 (a) The titration curve for the titration of 25.00 mL of 0.100 M HCl (strong acid) with 0.100 M NaOH (strong base) has an equivalence point of 7.00 pH. (b)The titration curve for the titration of 25.00 mL of 0.100 M acetic acid (weak acid) with 0.100 M NaOH (strong base) has an equivalence point of 8.72 pH.
The titration of a strong or weak base with a strong acid has a similar S-shaped curve; however, the curve is inverted as the pH will start in the basic region and decrease with the addition of the strong acid. The titration of weak acid or base can also be used to determine the Ka or Kb, respectively.
The four stages of a titration:
- Initial state (added titrant volume = 0 mL): pH is determined by the acid being titrated; because the two acid samples are equally concentrated, the weak acid will exhibit a greater initial pH
- Pre-equivalence point (0 mL < V < 25 mL): solution pH increases gradually and the acid is consumed by reaction with added titrant; composition includes unreacted acid and the reaction product, its conjugate base
- Equivalence point (V = 25 mL): a drastic rise in pH is observed as the solution composition transitions from acidic to either neutral (for the strong acid sample) or basic (for the weak acid sample), with pH determined by ionization of the conjugate base of the acid
- Post-equivalence point (V > 25 mL): pH is determined by the amount of excess strong base titrant added; since both samples are titrated with the same titrant, both titration curves appear similar at this stage.
This text is adapted from Openstax, Chemistry 2e, Section 14.7: Acid-base Titrations.
From Chapter 16:

Now Playing
16.15 : Acid-Base Titration Curves
Acid-base and Solubility Equilibria
125.7K Views

16.1 : Common Ion Effect
Acid-base and Solubility Equilibria
40.7K Views

16.2 : Buffers
Acid-base and Solubility Equilibria
163.1K Views

16.3 : Henderson-Hasselbalch Equation
Acid-base and Solubility Equilibria
67.8K Views

16.4 : Calculating pH Changes in a Buffer Solution
Acid-base and Solubility Equilibria
52.3K Views

16.5 : Buffer Effectiveness
Acid-base and Solubility Equilibria
48.2K Views

16.6 : Titration Calculations: Strong Acid - Strong Base
Acid-base and Solubility Equilibria
28.8K Views

16.7 : Titration Calculations: Weak Acid - Strong Base
Acid-base and Solubility Equilibria
43.5K Views

16.8 : Indicators
Acid-base and Solubility Equilibria
47.6K Views

16.9 : Titration of a Polyprotic Acid
Acid-base and Solubility Equilibria
95.5K Views

16.10 : Solubility Equilibria
Acid-base and Solubility Equilibria
51.3K Views

16.11 : Factors Affecting Solubility
Acid-base and Solubility Equilibria
32.8K Views

16.12 : Formation of Complex Ions
Acid-base and Solubility Equilibria
23.0K Views

16.13 : Precipitation of Ions
Acid-base and Solubility Equilibria
27.3K Views

16.14 : Qualitative Analysis
Acid-base and Solubility Equilibria
19.9K Views
Copyright © 2025 MyJoVE Corporation. All rights reserved