A subscription to JoVE is required to view this content. Sign in or start your free trial.
Method Article
DNA Transfection of Mammalian Skeletal Muscles using In Vivo Electroporation
In This Article
Summary
We describe detailed procedures for the efficient transfection of plasmid DNA into the fibers of foot muscles of live mice using electroporation and the subsequent visualization of protein expression using fluorescence microscopy.
Abstract
Protocol
Experimental Procedures for in vivo electroporation of FDB and IO muscles
- Before starting the in vivo electroporation protocols, mammalian expression plasmids must be amplified to yield concentration in the range of to 2-5 μg plasmid/μl of TE. Note: We routinely use commercial amplification kits and follow the manufacturer’ procedures. Commercial expression plasmids carrying the CMV promoter work very well in skeletal muscle in vivo transfections.
- Aliquot the necessary volume (10-20 μl) of the plasmid solution and save it in two 0.5 ml Eppendorf tubes (one for each foot of the mouse).
- Prepare a solution containing 2 mg/ml hyaluronidase in sterile Tyrode.
- Using an anesthetizing box, deeply anesthetize a mouse using 4% isoflurane in O2 with an approved gas anesthetic machine. Place the animal on a heating pad (37 °C) and maintain the anesthesia using a rodent face mask. Monitor the anesthetic depth by toe pinch reflex.
- Under observation with a dissection microscope, inject 10 μL of the hyaluronidase solution under the footpads of one foot of the mouse using a 1” long 33 gauge sterile needle. Penetrate the skin at a point close to the heel of the foot and advance the needle subcutaneously towards the base of the toes for ~1/4”.
- Repeat the procedure with the other foot if so desired.
- Disconnect the anesthesia and place the mouse in a cage. Allow it to fully recover from anesthesia.
- After one hour, anesthetize the animal for a second time and place it on the heating pad. Following the same procedure described for the hyaluronidase solution, inject a total of 20-50 μg of the plasmid DNA (depending on the size of the plasmid construct). The total injection volume should be less than 20 μL/foot. Note: when 15-20 μL is necessary, it is advisable to close the skin at the needle entry point with tissue-glue.
- Disconnect the anesthesia and place the mouse in a cage. Allow it to fully recover from anesthesia and wait for 10-15 min.
- Anesthetize the animal for the third time and place it on the heating pad.
- Select one foot of the animal. Place one gold-plated acupuncture needle under the skin at heel, and a second one at the base of the toes. Electrodes are oriented parallel to each other and perpendicular to the long axis of the foot.
- Connect the head of the needles (electrodes) to the electrical stimulator using micro-clip connectors. Electroporate the muscles by applying 20 pulses, 20 ms in duration/each, at 1Hz. Depending on the spacing of the electrodes, the pulses’ voltage amplitude is adjusted (by monitoring with an oscilloscope) to yield an electric field of ~100 V/cm. Note: No contractions in response to the stimuli should be observed if the level of anesthesia is adequate.
- If so desired, repeat the above procedures in the contralateral foot of the animal.
- Return the animal to its cage and once fully recovered from anesthesia maintain it under observation. Note: if the procedure went normally, the animal should regain full mobility within 30 minutes and afterwards is ready to be sent back to the animal room at the vivarium. The injections of hyaluronidase and DNA in the footpads do not have noticeable adverse effects on the animals. Once recovered from anesthesia, mice are able to amble normally around the cage. As an additional precaution, add to the drinking water of the animal Carprofen at 0.0027 mg/ml for 2 days as an analgesic.
- Protein expression can be assayed 2-8 days after transfection. However, sustained expression of many proteins has been observed for months.
NOTE: All animal procedures were approved by the UCLA Chancellor's Animal Research Committee as mandated by the Animal Welfare Act and the PHS Policy on Humane Care and Use of Laboratory Animals.
Representative Results:
The correct implementation of the in vivo electroporation procedures described above should result in the effective transfection of plasmids in FDB and IO muscles. However, the efficiency of expression of transgenic protein variants will depend on the plasmid, the size and complexity of the protein, the functional properties of the protein, and a number of other variables out of our control. As illustrated in Figure 1 for an FDB muscle electroporated in the presence of a commercial plasmid (pmR-mCherry) encoding for mCherry protein, most of the muscle fibers are transfected with our protocol as illustrated by the fact the most of them display red fluorescence. This does not rule out the possibility that individual fibers exhibit different degrees of protein expression, or that few fibers are not transfected at all 3. It should be noted that the efficient expression of large amounts of fluorescent proteins such as mCherry, EGFP, ECFP, and EYFP, does not impair the muscle fibers’ excitability and excitation-contraction coupling properties. In fact, they are indistinguishable from those in sham transfected muscles (results not shown).
Practical approaches used to verify the localized expression of fluorescently-tagged proteins in skeletal muscle fibers.
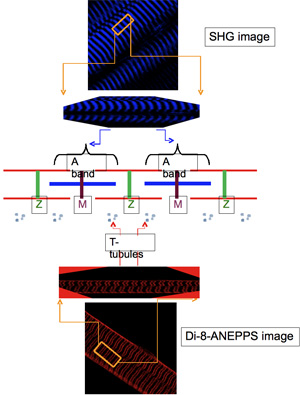
The intracellular localization of the di novo expressed transgenic proteins is routinely evaluated by simultaneous acquiring, using the TPLSM, fluorescent images of the respective tags and images of well-identified markers of cellular structures. The most typical of these latter are: a) second harmonic generation (SHG) images, which arise from the myosin anisotropy of the sarcomeric A bands (centered at the M-lines)9,10 and, b) di-8-ANEPPS fluorescence images, which can be obtained by labeling the surface and transverse tubular (T-tubule) system membranes of the muscle fibers with this impermeant potentiometric dye11. In fluorescence images of muscle fibers stained with di-8-ANEPPS, the T-tubules appear as narrow bands of fluorescence oriented approximately orthogonal to the long axis of the fiber. These bands are unequally spaced from each other: they are separated by a long distance which spans across the M-lines, and a short one that spans across the Z-line11.
Expression and localization of α-actinin-EGFP in skeletal muscle fibers.
An example of the expression of a tagged variant of the structural muscle protein α-actinin is shown in Figure 2. This protein is known to be a major component of the Z-line and, as such, is routinely used as a marker of this structure12. We transfected FDB and IO muscles with the plasmid pEGFPN1-α-actinin1 encoding for human (non-muscle) α-actinin tagged at the C terminal with EGFP. Six days after transfection, we found that, as assessed by EGFP fluorescence distribution, α-actinin is mostly expressed at narrow bands equally spaced along the fiber axis. A single band per sarcomere is seen (Figures 2A & 2D). The colocalization of these bands with the Z-lines is demonstrated by comparing the distribution of EGFP fluorescence with the SHG (Figure 2B) and di-8-ANEPPS (Figure 2E) images. As shown by the overlay image (Figure 2C), α-actinin-EGFP bands alternate with the SHG bands, indicating that they are located midway between two consecutive M-bands, coinciding with the location of Z-lines. In transfected muscle fibers stained with di-8-ANEPPS, α-actinin-EGFP bands are seen centered between every pair of T-tubules (Figure 2F) which are known to flank the Z-lines (i.e. separated by a shorter distance), thus indicating that transgenic α-actinin is targeted to the Z-line.
Expression of DHPRα1s tagged at the N-terminus with EGFP
The efficiency of muscle transfection with pEGFPC1.1-DHPR α1s is verified in TPLSM images (e.g. Figure 3A) showing that most fibers express EGFP-DHPRα1s (a transmembrane protein). The most prominent feature of transfected fibers is the double-banded pattern of EGFP fluorescence (Figures 3A & 3B) as would be expected if this protein was targeted to the T-tubules. It can also be observed in Figure 3 that while different fibers display various levels of fluorescence intensity, the banded fluorescence pattern of an individual fiber seems to be maintained homogeneous along the fiber. At higher magnification (Figure 3B), it can be clearly seen that the uneven spacing among bands is similar to that observed in fibers stained di-8-ANEPPS (e.g. Figure 2E). The overlay images (Figure 3B & 3E) illustrate that the SHG bands are located within the larger spacing between EGFP-DHPRα1s bands, corroborating that this protein is at the T-tubules. Additional FRET measurements with the non-fluorescent lipophilic anion DPA- (data not shown) further demonstrate that the EGFP moiety is within few nanometers of the inner leaflet of the T-tubules’ membranes.
Localization and functional evaluation of the expression of EYFP-ClC1
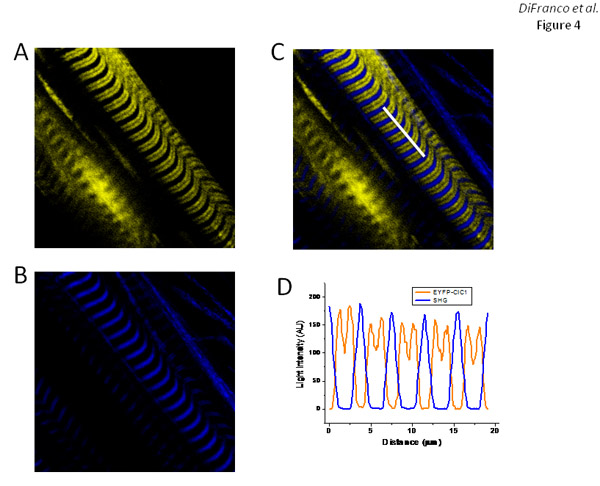
Fibers transfected with pEYFP-ClC1, which encodes an EYFP-tagged construct (at the N-terminal) of the skeletal muscle chloride channel (ClC1), display EYFP fluorescence bands (Figure 4A) with a pattern similar to that observed for EGFP-DHPRα1s’ expression (Figure 3A) and corresponding to the T-tubule arrangement as illustrated with di-8-ANEPPS staining (Figure 2E). As expected, the superimposition of EYFP-ClC1 (Figure 4A) and SHG images (Figure 4B) as shown in the overlay (Figure 4C), illustrate that the SHG bands are centered at the large spacing of between EYFP fluorescence bands.
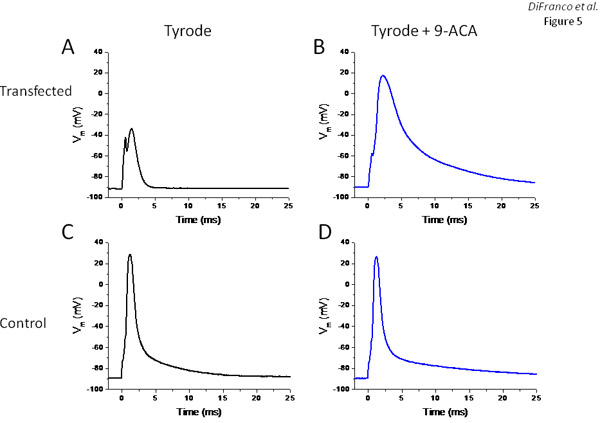
In order to assess whether the expression of EYFP-ClC1 results in a significant increase in the resting conductance of the muscle fibers, as expected from the overexpression of functional chloride channels, we enzymatically dissociated muscle fibers from the transfected FDB muscle and studied their electrophysiological properties using a two-microelectrodes experimental setup described previously6,11,13. Figure 5 shows results from two fibers: one expressing large amounts of EYFP-ClC1 as assessed from global fluorescence intensity measurements in a standard fluorescence microscope (not shown), and the other is a non-transfected control. The voltage record in Figure 5A (obtained from the muscle fiber expressing EYFP-ClC1) demonstrates that due to the excessive resting conductance, the fiber is almost non-excitable. Current stimulus pulses of up to 400nA (0.5ms) needed to be used in order to elicit a very small active response (no overshoot, Figure 5A). After replacement of the external Tyrode solution to one containing 500 μM of the chloride channel blocker 9-ACA, 200 nA current pulses were sufficient to elicit an action potential (Figure 5B), although much slower and broader than those recorded in the control fiber (Figure 5C). As expected, addition of 9-ACA had minimal effects on this control fiber (Figure 5D).

Figure 1. Transfection efficiency of the in-vivo electroporation method. Brightfield (A) and fluorescence (B) images of an FDB muscle transfected with pmR-mCherry. Days after electroporation protocol: 12 days. Please click here for a larger version of figure 1.

Figure 2. Expression and targeting of α-actinin-EGFP in FDB fibers. Panels A and B are EGFP fluorescence and SHG images, respectively, of a fiber expressing α-actinin-EGFP. Panel C is a superposition of the images in A and B. Panels D and E are fluorescence images of another fiber expressing α-actinin-EGFP and stained with di-8-ANEPPS, respectively. Panel F is the superposition of images in D and E. Days after electroporation protocol: 6 days.

Figure 3. Expression and targeting of EGFP-DHPRα1s in FDB fibers. Panel A, EGFP fluorescence image of a group of fibers expressing EGFP-DHPRα1s. Panel B is an enlargement of the square in panel A in order to better show the banded pattern of the protein expression. Panel C is the SHG image corresponding to the image in panel A. Panel D is the overlay of the images A and C. Panel E is an enlargement of the area indicated in panel D. Days after electroporation protocol: 20 days.

Figure 4. Expression and targeting of EYFP-ClC1 in FDB fibers. Panels A and B are EYFP fluorescence and SHG images, respectively, of fibers expressing EYFP-ClC1. Panel C is the superposition of the images in panels A and B. Panel D is an intensity profile measured along the white line highlighted in the image in panel C. Days after electroporation protocol: 7 days.

Figure 5. Electrophysiological assessment fibers expressing transgenic EYFP-ClC1. Panels A and B are voltage records from a fiber expressing EYFP-ClC1 in response to current pulses before and after treatment with 9-ACA, respectively. Panels C and D are voltage records (action potentials) elicited in response to current pulses in a non-transfected fiber before and after treatment with 9-ACA, respectively.
Discussion
We describe here the detailed steps that should be followed in order to attain effective transfections of DNA plasmids into skeletal muscle fibers by in vivo electroporation. The main advantages of our approach are the simplicity of implementation, and its minimal invasiveness which results in negligible health hazard to the animals. In reality, the above described electroporation protocols do not entail much more than two subcutaneous injections per foot, followed by an electrical stimulation protocol, all of w...
Disclosures
The authors have nothing to disclose.
Acknowledgements
We thank Dr. T. Otis, Department of Neurobiology, UCLA, for sharing the TPLSM facility with us, Dr. C. Fahlke, Institute of Physiology, RWTH Aachen, Germany, for the kind donation of the pEYFP-ClC1 plasmid, and Mr. R. Serrano for technical support. This work was supported by grants from NIH/NIAMS grants AR047664 and AR54816.
References
- Muangmoonchai, R., Wong, S., Smirlis, D., Phillips, I., Shephard, E. Transfection of liver in vivo by biolistic particle delivery. Molecular Biotechnology. 20 (2), 145-151 (2002).
- DiFranco, M., Capote, J., Quinonez, M., Vergara, J. L. Voltage-dependent dynamic FRET signals from the transverse tubules in mammalian skeletal muscle fibers. J Gen Physiol. 130 (6), 581-600 (2007).
- DiFranco, M., Neco, P., Capote, J., Meera, P., Vergara, J. L. Quantitative evaluation of mammalian skeletal muscle as a heterologous protein expression system. Protein Expression and Purification. 47 (1), 281-288 (2006).
- Meera, P., Dodson, P. D., Karakossian, M. H., Otis, T. S. Expression of GFP-tagged neuronal glutamate transporters in cerebellar Purkinje neurons. Neuropharmacology. 49 (6), 883-889 (2005).
- DiFranco, M., Capote, J., Quinonez, M., Vergara, J. L. Dynamic FRET Signals between DPA and the {alpha}1s and {beta}1a Subunits of the DHPR of Mammalian Skeletal Muscle. Biophys. J. 94, 2633-2633 (2008).
- Woods, C. E., Novo, D., DiFranco, M., Capote, J., Vergara, J. L. Propagation in the transverse tubular system and voltage dependence of calcium release in normal and mdx mouse muscle fibres. J Physiol. 568 (Pt 3), 867-880 (2005).
- DiFranco, M., Woods, C. E., Capote, J., Vergara, J. L. Dystrophic skeletal muscle fibers display alterations at the level of calcium microdomains. Proc Natl Acad Sci U S A. 105 (38), 14698-14703 (2008).
- Lueck, J. D., Mankodi, A., Swanson, M. S., Thornton, C. A., Dirksen, R. T. Muscle Chloride Channel Dysfunction in Two Mouse Models of Myotonic Dystrophy. J. Gen. Physiol. 129 (1), 79-94 (2007).
- Zipfel, W. R. Live tissue intrinsic emission microscopy using multiphoton-excited native fluorescence and second harmonic generation. Proceedings of the National Academy of Sciences of the United States of America. 100 (12), 7075-7080 (2003).
- Plotnikov, S. V., Millard, A. C., Campagnola, P. J., Mohler, W. A. Characterization of the Myosin-Based Source for Second-Harmonic Generation from Muscle Sarcomeres. Biophys J. 90 (2), 693-703 (2006).
- DiFranco, M., Capote, J., Vergara, J. L. Optical imaging and functional characterization of the transverse tubular system of mammalian muscle fibers using the potentiometric indicator di-8-ANEPPS. J Membr Biol. 208 (2), 141-153 (2005).
- Mills, M. Differential expression of the actin-binding proteins, {{alpha}}-actinin-2 and -3, in different species: implications for the evolution of functional redundancy. Hum. Mol. Genet. 10 (13), 1335-1346 (2001).
- Woods, C. E., Novo, D., DiFranco, M., Vergara, J. L. The action potential-evoked sarcoplasmic reticulum calcium release is impaired in mdx mouse muscle fibres. J Physiol. 557 (Pt 1), 59-75 (2004).
Reprints and Permissions
Request permission to reuse the text or figures of this JoVE article
Request PermissionExplore More Articles
This article has been published
Video Coming Soon
Copyright © 2025 MyJoVE Corporation. All rights reserved