
A subscription to JoVE is required to view this content. Sign in or start your free trial.
Method Article
Investigating Single Molecule Adhesion by Atomic Force Spectroscopy
In This Article
Summary
A protocol to couple a large variety of single molecules covalently onto an AFM tip is presented. Procedures and examples to determine the adhesion force and free energy of these molecules on solid supports and bio-interfaces are provided.
Abstract
Atomic force spectroscopy is an ideal tool to study molecules at surfaces and interfaces. An experimental protocol to couple a large variety of single molecules covalently onto an AFM tip is presented. At the same time the AFM tip is passivated to prevent unspecific interactions between the tip and the substrate, which is a prerequisite to study single molecules attached to the AFM tip. Analyses to determine the adhesion force, the adhesion length, and the free energy of these molecules on solid surfaces and bio-interfaces are shortly presented and external references for further reading are provided. Example molecules are the poly(amino acid) polytyrosine, the graft polymer PI-g-PS and the phospholipid POPE (1-palmitoyl-2-oleoyl-sn-glycero-3-phosphoethanolamine). These molecules are desorbed from different surfaces like CH3-SAMs, hydrogen terminated diamond and supported lipid bilayers under various solvent conditions. Finally, the advantages of force spectroscopic single molecule experiments are discussed including means to decide if truly a single molecule has been studied in the experiment.
Introduction
Over the past 30 years, atomic force microscopy (AFM) has turned out to be a valuable imaging technique to study biological 1,2 and synthetic 3 materials and surfaces since it provides molecular spatial resolution in all three dimensions and can be operated in various solvent environments. In addition, AFM-single molecule force spectroscopy (SMFS) enables to measure forces ranging from the pN to µN regime and has given unprecedented insight for example into protein folding 4,5, polymer physics 6–8 , and single molecule-surface interaction9–12.The rationale behind studying single molecules rather than an ensemble of molecules is to avoid averaging effects which often mask rare events or hidden molecular states. Furthermore, a multitude of molecular parameters such as the contour length, the Kuhn length, the adhesion free energy, etc. can be obtained. This is detailed in the examples below. In a typical AFM-SMFS experiment, the probe molecule is coupled to a very sharp tip via a linker molecule. The tip itself is located at the end of a bendable cantilever. If the tip is brought into contact with the surface the probe molecule will interact with this surface. By observing the deflection of the cantilever upon retraction of the tip, the force, and hence the free energy, to detach the molecule from the surface can be determined. To obtain meaningful statistics, a large number of so called force-distance curves have to be acquired. Furthermore, to have true single molecule experiments (i.e., using one and the same probe molecule over the duration of the whole experiment) the probe molecule should be coupled covalently to the AFM tip. Here, an experimental protocol for cantilever functionalization with a single molecule via a covalent bond is presented. The single molecule can either be coupled via an amino or a thiol group to the AFM tip. The conjugation process can be performed in a broad variety of solvents (organic and aqueous) to account for the solvation properties of the polymers used.
In the first part, a general protocol to covalently attach a single molecule (“probe molecule”) via a linker molecule to an AFM tip is described. To this end, organic NHS- or maleimide-chemistry is used13. Along with the protocol for three example molecules, the data acquisition and data analysis processes are described and references for further reading are provided. The example molecules are: the (linear) polymer tyrosine, the graft polymer PI-g-PS and the lipid POPE. This includes slight variations of the protocol, for example to covalently attach cysteines. In addition, a section is dedicated to the preparation of different surfaces such as a diamond surface, a CH3-self-assembled monolayer and lipid bilayers. These interfaces have proven to be good references and examples.
Access restricted. Please log in or start a trial to view this content.
Protocol
NOTE: See Figure 2 for an overview of the process flow comprising the preparation, the data acquisition and data analysis steps.
1. Reagent Setup
NOTE: All chemicals must be handled with care, and thus a lab coat, gloves and eye protection should be used. All operations must be performed in a laboratory hood. In particular, special gloves should be worn in case of chloroform use.
- Use chemicals with low water content such as dry chloroform rapidly and store dry but not longer than a week. Store both chemicals at -20 °C and under nitrogen or argon gas because APTES ((3-aminopropyl)triethoxysilan) (see Table 1) and PEG (polyethylenglycol) are hygroscopic and PEG is subject to oxidation in air.
- To avoid frequent exposure of the stock to atmospheric oxygen and moisture, prepare smaller aliquots, ideally within a glovebox system with a nitrogen atmosphere.
2. Equipment Setup
NOTE: To avoid possible cross-contamination, use fresh and clean vessels for each step.
- Clean glassware and tweezers in detergent solution for 30 min in an ultrasonic bath at 60 °C.
- Rinse and sonicate equipment from step 2.1 two times thoroughly with ultrapure water.
- Heat equipment from step 2.1 in RCA solution (ultrapure water, hydrogen peroxide and ammonia (5:1:1)) to 75 °C in an oven for 45 min and subsequently rinse them with ultrapure water.
- Finally, dry the glassware and tweezers under a stream of dry nitrogen or in an oven (100 °C, 3 hr).
3. Tip Functionalization
NOTE: Use tweezers, vessels, etc. made from stainless steel, PTFE, glass or any other material which is chemically stable in organic solutions if applicable. Unless specified otherwise, carry out all steps at RT. The amount of incubation solution needed depends on the number of cantilever chips. Make sure that the cantilevers are immersed in the respective solutions at all time.
NOTE: Use a hood to avoid inhalation of organic vapors.
- Formation of OH-groups on cantilever surface (‘activation’) (approximately 0.5 hr):
- Use tweezers to place fresh cantilever chips (material: SiN, spring constant: 10-100 pN/nm) on a clean glass slide and put them in a plasma chamber (100 W).
- Evacuate chamber (~0.1 mbar).
- Flood chamber with oxygen gas and evacuate again.
- Activate the plasma process (power: 20%, duration: 15 min, process pressure: 0.25 mbar).
- Amino-silanization of cantilevers (approximately 1 hr):
- Prepare the 2.5 ml of APTES solution (see Table 1) in a glass Petri dish – do this ideally during the plasma process.
- Immediately after the plasma process, dip each cantilever for 1 sec in acetone and place them immediately afterwards in the APTES solution.
- Incubate for 15 min at RT.
- Carefully rinse the cantilever chips twice in 10 ml acetone and once in 10 ml chloroform.
- Optional final step: Place cantilever chips from previous step on a clean glass slide and bake them for 30 min at 70 °C. Note that there are also alternative strategies for surface activation, e.g., UV treatment 12.
- PEGylation (approximately 2 hr):
NOTE: Carry out steps 3.3.1-3.3.4 during amino-silanization. NHS and maleimide groups are subject to hydrolysis in aqueous environments and PEG itself is subject to oxidation in air. Therefore timing (especially in between the steps) is a critical parameter. Refer to 13 for further information.- Prepare the chloroform solution (see Table 1).
- To avoid condensation, warm PEG powders up to RT before opening the aliquot and weighing the appropriate amount.
- For the coupling of polymers or lipids with amino groups, separately solve NHS-PEG-NHS (6 kDa) and methyl-PEG-NHS (5 kDa) in the chloroform solution by vortexing them until they are completely solved. Refer to Table 1 for concentrations.
- Alternatively. for the coupling of polymers with thiol groups separately solve Mal-NHS- PEG and methyl-PEG-NHS in the chloroform solution.
- Mix the solutions as required to adjust a certain number ratio between the NHS- or the maleimide- and the methyl-terminated PEG molecules (typically 1:500). Note that the ideal ratio has to be determined iteratively in a series of preparation-experiment cycles.
- Incubate cantilever chips in the PEG solution for 1 hr within a chloroform saturated atmosphere to prevent evaporation of the chloroform.
- Probe molecule conjugation (> 1 hr):
NOTE: In the following 3.4.1-3.4.3, three examples for the covalent coupling of different probe molecules to the AFM tip are described. For each molecule the protocol has to be adjusted. Further note, that in example 1 and 3 NHS-chemistry is used whereas in example 2 the thiol functionalized polymer PI-g-PS is coupled to the PEG via maleimide-chemistry. For details see 14.- For poly(amino acid) poly-D-tyrosine (40-100 kDa)
- Dissolve the polytyrosine conjugated probe molecule in 1 M NaOH. Adjust the concentration to 1 mg/ml.
- Exchange the NaOH for sodium borate buffer (pH 8.1) using spin desalting columns (7 kDa MWCO) immediately before the functionalization
- Rinse the cantilevers first with 5 ml of chloroform, then with 5 ml of ethanol and finally with 5 ml of borate buffer.
- Incubate the cantilever chips for 1 hr in the polytyrosine borate buffer solution and then rinse with borate buffer and ultrapure water. Store in ultrapure water until the measurement.
- For polymers with a linear backbone (polyisoprene, 119 kDa) having grafted side chains (polystyrene, 88 kDa) 14
- Dissolve the PI-g-PS in dry chloroform. Adjust the concentration of the conjugation solution to 4 mg/ml.
- Rinse the cantilevers with 5 ml of chloroform and incubate for at least 1 hr in the conjugation solution.
- Rinse again in 5 ml of chloroform and store in chloroform in a chloroform-saturated environment (to prevent chloroform evaporation) until the measurement.
- For the lipid POPE
- Dissolve POPE in dry chloroform. Adjust the concentration to 20 mM.
- Rinse the cantilevers with 5 ml of ethanol and 5 ml of ultrapure water before incubation of the cantilevers for 1 hr in the lipid solution.
- After incubation, rinse cantilevers with 5 ml of chloroform, 5 ml of ethanol and 5 ml of warm, ultrapure water (in this order) to remove unbound probe molecules and to get rid of chloroform residues. Use functionalized tips immediately. Alternatively, store them in chloroform until needed.
- For poly(amino acid) poly-D-tyrosine (40-100 kDa)

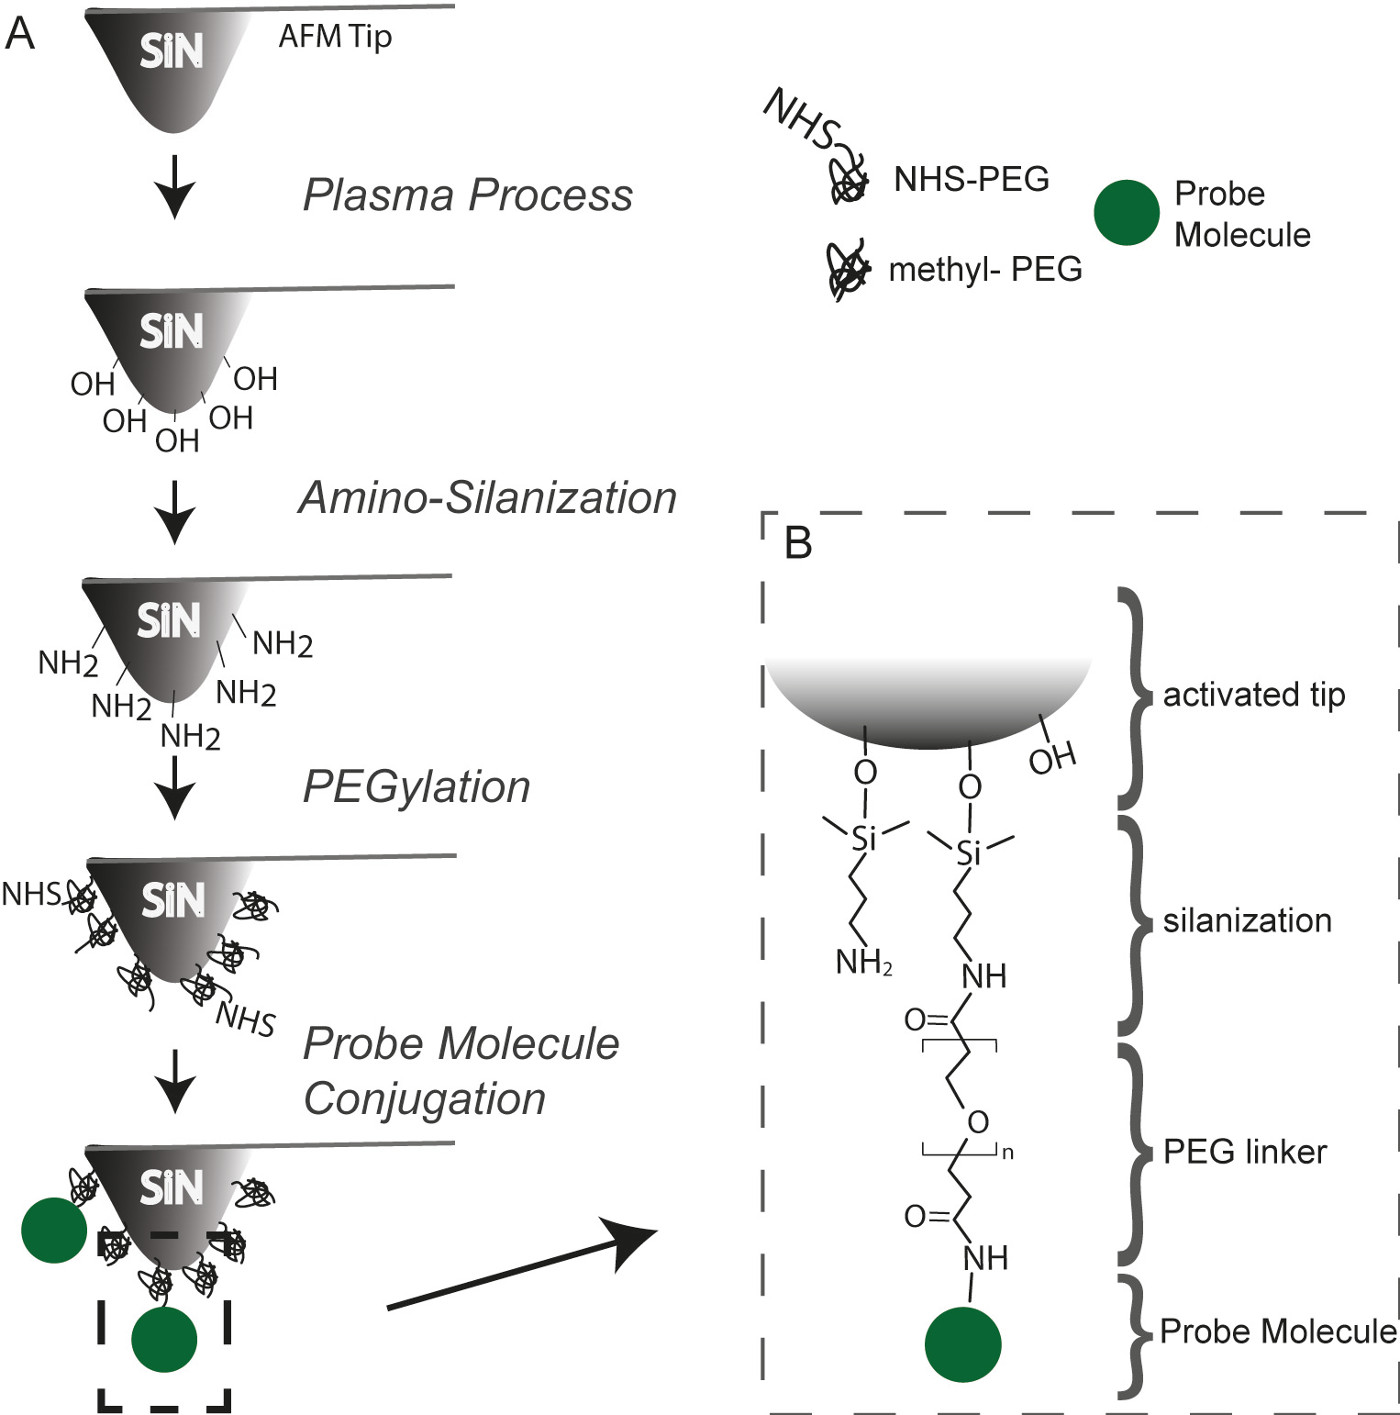
Figure 1. (A) Schematic showing the tip functionalization process using the example of NHS chemistry. (B) Chemical bonding employed to attach a probe molecule to the tip via an amino group. Please click here to view a larger version of this figure.
4. Surface Preparation
- Self-assembled monolayer (SAM)
NOTE: As surface for the first example, a self-assembled monolayer was chosen. Refer to literature 15 for details.- Clean glass slides with detergent solution and then twice in ultrapure water in an ultrasonic bath for 30 min each. Then, as an additional cleaning step, place them in the RCA solution (see step 2.3) at 75 °C for 15 min.
- Coat the slides with 10 nm chromium nickel and 100 nm gold in a vacuum coater. Then store in the fridge and clean again in the RCA solution directly prior to the next step.
- Incubate the slides of the previous step in 2 mM 1-dodecanthiol/ethanol solution for 12 hr. The thiol groups bind to the gold surface and a hydrophobic monolayer self assembles. Rinse the slides with ethanol and ultrapure water and then dry by a stream of nitrogen gas. Confirm the hydrophobicity of the prepared surface with static contact angle measurements in a goniometer with a CCD camera10.
- Hydrogen terminated diamond
NOTE: As a surface for the second example, a hydrogen terminated diamond was chosen. The surface preparation was performed as described previously16. - Supported lipid bilayer
NOTE: In the last example, a surface supported lipid bilayer (SLB) was used as a surface. To obtain such a surface, a solution (0.1 mg/ml) of large unilamellar vesicles (LUVs) consisting of the phospholipid POPC were formed by the extrusion method. Then 50 µl of the LUV solution were put on a freshly cleaved mica sheet (A = 1 cm²) and incubated for 30 min. Finally the solution was rinsed with 20 ml of ultrapure water. See 17,18 for a detailed description of the preparation of SLBs.
5. Data Acquisition
NOTE: For the experiments, use an AFM, which provides the capability to measure in liquids. The data acquisition and data analysis procedures are applicable regardless of the AFM model used. Furthermore, in some experiments it is advantageous to have the possibility to control the temperature within the liquid cell. Cantilever deflection was detected via the laser beam deflection method 19. Spring constants were determined with the thermal noise method 20.
- Insert the functionalized cantilever into an AFM cantilever holder which is suitable for measuring in fluids.
- Put the surface (preparation see above) to be sampled into the AFM and cover it with liquid. Both, cantilever and surface should now be immersed in the liquid with the cantilever tip pointing towards the surface. Note that in many cases a drop of liquid is enough. In any case evaporation of the fluid should be avoided, e.g., by using a closed fluid cell.
- If applicable, adjust desired temperature on the controller.
- Let the system equilibrate for at least half an hour.
- Record a thermal noise spectrum of the cantilever with the cantilever far away from the surface in order to exclude any surface damping effects. Note that usually 10 or more spectra have to be accumulated to obtain a sufficient signal-to-noise ratio.
- Approach the surface. Note that in order to conserve tip geometry and tip functionalization the approach process has to be carried out carefully. This can be accomplished by, for example, approaching in intermittent contact mode.
- Determine the inverse optical lever sensitivity (InvOLS) measured in nm/volt. Do this by pushing the cantilever tip against a hard surface.
- Determine the InvOLS by measuring the slope of the piezo travel distance vs. the change in photodiode voltage. Fit a line to the part of the force-distance curve where the cantilever tip is in contact with the surface. In experiments involving a soft surface like lipid bilayers, carry out this step on areas which are not covered with a lipid bilayer (‘defect spots’).
- Determine the spring constant (pN/nm) by fitting a harmonic oscillator to the thermal noise spectrum. Use automated software function for spring constant determination; otherwise consult literature 20.
- Start the experiment.
- Record numerous force-distance curves at each experimental condition. Typically, use the following values for the experimental parameters: Sampling rate of 5 kHz, tip speed of 1 µm/sec, retract distance of 1 µm.
NOTE: Sometimes, depending on the dynamics of the studied experiment, it might be necessary to wait a certain amount of time with the tip in contact with the surface (‘dwell time’).
NOTE: The experiment specific parameters can deviate substantially from the values given above. - During long term measurements, zero the laser position on the photodiode from time to time by repositioning the photodiode.
- Optional: After every force curve, relocate the AFM-tip to another x-y position.
- At the end of the experiment, determine the sensitivity and the spring constant again to check for consistency and stability of the system.
NOTE: Comparing the spring constant and sensitivity before and after the experiment is also a means to ensure that the properties of the system and the properties of the tip remained unchanged over the course of the experiment. If the difference of the spring constants is not too large (<=15%), they can be averaged, since the intrinsic uncertainty of spring constant determination is also around 15%. For larger differences, it is advisable to first find and eliminate the cause for the changing apparent spring constant before continuing with further experiments.
- Record numerous force-distance curves at each experimental condition. Typically, use the following values for the experimental parameters: Sampling rate of 5 kHz, tip speed of 1 µm/sec, retract distance of 1 µm.
6. Data Preparation
NOTE: In this section general data preparation steps which are typically carried out independent of the specific type of experiment to convert units to newton and nanometer as well as to correct the data are described. The experiment specific data analyses are briefly described further below in the respective representative example section.
- Typically, carry out all data preparation and analysis steps automatically by a home-written algorithm, e.g., based on the software IGOR Pro 6.
- Convert the raw deflection signal (Defl) [V] into force by multiplying it with the InvOLS [nm/V] and the spring constant [nN/nm].
- Offset the force in such a way that the force on the cantilever in sufficient distance from the surface (unloaded cantilever) becomes 0 nN.
- Calculate the actual tip position (also called separation when measured relative to the surface) z*, which takes the bending of the cantilever into account:

- Offset z* in such a way that z* = 0 corresponds to the z position of the surface.
NOTE: Here, F is the force which acts on the tip and hence bends the cantilever (determined in step 6.2.), z is the measured z-sensor position (directly given by the instrument) and k represents the spring constant (determined in step 5.8).

Figure 2. Process flow diagram showing the sample preparation, the data acquisition and the data analysis. Please click here to view a larger version of this figure.
Access restricted. Please log in or start a trial to view this content.
Results
In the following, the results for the above described example molecules, namely the polymers poly(amino acid) polytyrosine, the graft polymer PI-g-PS and the phospholipid POPE, are presented. First for each example, experiment specific details for the data acquisition and data preparation are provided. Then, the exemplary results for experiments where these molecules were desorbed from different surfaces (CH3-SAMs, hydrogen terminated diamond and lipid bilayers) are shown. Determination of the adhesio...
Access restricted. Please log in or start a trial to view this content.
Discussion
During the last decades, single molecule experiments have provided unprecedented insights into molecular mechanisms and turned out to be an invaluable approach in life science and beyond. To achieve good and meaningful statistics from SMFS experiments, ideally one and the same molecule is used over the whole course of the experiment. In contrast to experiments with ensembles of molecules, SMFS experiments are able to detect rare events and hidden molecular states. Another advantage of single molecule experiments is that ...
Access restricted. Please log in or start a trial to view this content.
Disclosures
The authors declare that they have no competing financial interests.
Acknowledgements
The authors thank the DFG (Hu 997/2-2) for financial support. FS acknowledges the Hanns-Seidel-Stiftung (HSS). SKr was supported by the Elitenetzwerk Bayern in the framework of the doctorate program Material Science of Complex Interfaces. SKi thanks the SFB 863 for financial support.
Access restricted. Please log in or start a trial to view this content.
Materials
| Name | Company | Catalog Number | Comments |
| Materials | |||
| Hellmanex III alkaline liquid concentrate (detergent solution) | Hellma | ||
| RCA (ultrapure water, hydrogen peroxide (35%), ammonia (32%); 5:1:1(v/v/v)) | Sigma | ||
| Vectabond reagent / APTES (3-Aminopropyl)triethoxysilane | Vectorlabs | ||
| Dry acetone (< 50 ppm H2O) | Sigma | ||
| Dry chloroform (> 99.9%) | Sigma | ||
| Triethylamine | Sigma | ||
| Ultrapure water | Biochrom, Germany | ||
| Di-sodium tetraborate (> 99.5%) | Biochrom, Germany | ||
| Boric Acid | Biochrom, Germany | ||
| Monofunctional α-methoxy-ω-NHS PEG, 5 kDa, “methyl-PEG-NHS” | Rapp, Germany | ||
| Heterobifunctional α,ω-bis-NHS PEG, 6 kDa, “NHS-PEG-NHS” | Rapp, Germany | ||
| Heterobifunctional α-maleimidohexanoic- ω-NHS PEG, 5 kDa, “Mal-PEG-NHS” | Rapp, Germany | ||
| Probe molecule (polymer, lipid, etc.) | |||
| Equipment | |||
| Sufficient amount of glass crystallising dishes with spout (10 ml), glass Petri dishes (500 µl) and glass lids | VWR International GmbH, Germany | ||
| [header] | |||
| Laboratory oven model UF30 | Memmert, Germany | ||
| Temperature controlled sonicator | VWR International GmbH, Germany | ||
| Plasma system "Femto", 100 W | Diener, Germany | ||
| One separate glass syringe for each organic solvent | VWR International GmbH, Germany | ||
| Vortex mixer | VWR International GmbH, Germany | ||
| Microcentrifuge tubes (0.5 ml or 1.5 ml) | Eppendorf | ||
| Pipettes: 10-100 µl, 50-200 µl and 100-1,000 µl | Eppendorf | ||
| AFM with temperature controlled fluid cell (e.g. MFP-3D with BioHeater) | Asylulm Research, Santa Barbara | ||
| Soft SiN cantilevers cantilever, typically made from silicon nitride (SiN) (spring constant less than 100 pN/nm, e.g. MLCT) | Bruker AXS, Santa Barbara | ||
References
- Scheuring, S., Sapra, K., Müller, D. Probing Single Membrane Proteins by Atomic Force Microscopy. Handbook of Single-Molecule Biophysics. , 449-485 (2009).
- Kodera, N., Yamamoto, D., Ishikawa, R., Ando, T. Video imaging of walking myosin V by high-speed atomic force microscopy. Nature. 468 (7320), 72-76 (2010).
- Magonov, S. N. Atomic Force Microscopy in Analysis of Polymers. Encyclopedia of Analytical Chemistry. , (2006).
- Rief, M., Clausen-Schaumann, H., Gaub, H. E. Sequence-dependent mechanics of single DNA molecules. Nature Structural Biology. 6 (4), 346-349 (1999).
- Li, H., Linke, W. a, et al. Reverse engineering of the giant muscle protein titin. Nature. 418 (6901), 998-1002 (2002).
- Bustamante, C., Smith, S. B., Liphardt, J., Smith, D. Single-molecule studies of DNA mechanics. Current opinion in structural biology. 10 (3), 279-285 (2000).
- Zhang, W., Zhang, X. Single molecule mechanochemistry of macromolecules. Progress in Polymer Science. 28 (8), 1271-1295 (2003).
- Hugel, T., Rief, M., Seitz, M., Gaub, H., Netz, R. Highly Stretched Single Polymers: Atomic-Force-Microscope Experiments Versus Ab-Initio Theory. Physical Review Letters. 94 (4), 048301(2005).
- Stetter, F. W. S., Cwiklik, L., Jungwirth, P., Hugel, T. Single Lipid Extraction - The Anchoring Strength of Cholesterol in Liquid Ordered and Liquid Disordered Phases. Biophysical journal. 107 (5), (2014).
- Pirzer, T., Hugel, T. Adsorption mechanism of polypeptides and their location at hydrophobic interfaces. Chemphyschem. 10 (16), 2795-2799 (2009).
- Butt, H. -J., Cappella, B., Kappl, M. Force measurements with the atomic force microscope: Technique, interpretation and applications. Surface Science Reports. 59 (1-6), 1-152 (2005).
- Nash, M. A., Gaub, H. E. Single-Molecule Adhesion of a Copolymer to Gold. ACS NANO. 6 (12), 10735-10742 (2012).
- Hermanson, G. Bioconjugate Techniques. , Academic Press. New York. (1996).
- Kienle, S., et al. Effect of molecular architecture on single polymer adhesion. Langmuir the ACS journal of surfaces and colloids. 30 (15), 4351-4357 (2014).
- Folkers, J. P., Laibinis, P. E., Whitesides, G. M. Self-assembled monolayers of alkanethiols on gold: comparisons of monolayers containing mixtures of short- and long-chain constituents with methyl and hydroxymethyl terminal groups. Langmuir. 8 (5), 1330-1341 (1995).
- Dankerl, M., et al. Diamond Transistor Array for Extracellular Recording From Electrogenic Cells. Advanced Functional Materials. 19 (18), 2915-2923 (2009).
- Leonenko, Z. V., Carnini, A., Cramb, D. T. Supported planar bilayer formation by vesicle fusion: the interaction of phospholipid vesicles with surfaces and the effect of gramicidin on bilayer properties using atomic force microscopy. Biochimica et biophysica acta. 1509 (1-2), 131-147 (2000).
- Stetter, F. W. S., Hugel, T. The Nanomechanical Properties of Lipid Membranes are Significantly Influenced by the Presence of Ethanol. Biophysical Journal. 104 (5), 1049-1055 (2013).
- Putman, C. A. J., De Grooth, B. G., Hulst, N. F., Greve, J. A detailed analysis of the optical beam deflection technique for use in atomic force microscopy. Journal of Applied Physics. 72 (1), 6-12 (1992).
- Hutter, J. L., Bechhoefer, J. Calibration of atomic-force microscope tips. Review of Scientific Instruments. 64 (7), 1868(1993).
- Krysiak, S., Liese, S., Netz, R. R., Hugel, T. Peptide desorption kinetics from single molecule force spectroscopy studies. Journal of the American Chemical Society. 136 (2), 688-697 (2014).
- Li, I. T. S., Walker, G. C. Interfacial free energy governs single polystyrene chain collapse in water and aqueous solutions. Journal of the American Chemical Society. 132 (18), 6530-6540 (2010).
- Dudko, O. K., Hummer, G., Szabo, A. Theory, analysis, and interpretation of single-molecule force spectroscopy experiments. Proceedings of the National Academy of Sciences of the United States of America. 105 (41), 15755-15760 (2008).
- Stetter, F. W. S., Cwiklik, L., Jungwirth, P., Hugel, T. Single Lipid Extraction: The Anchoring Strength of Cholesterol in Liquid-Ordered and Liquid-Disordered Phases. Biophysical Journal. 107 (5), 1167-1175 (2014).
- Horinek, D., et al. Peptide adsorption on a hydrophobic surface results from an interplay of solvation, surface, and intrapeptide forces. Proc Natl Acad Sci U S A. 105 (8), 2842-2847 (2008).
- Ebner, A., et al. Functionalization of probe tips and supports for single-molecule recognition force microscopy. Topics in current chemistry. 285 (April), 29-76 (2008).
- Geisler, M., Balzer, B. N., Hugel, T. Polymer Adhesion at the Solid-Liquid Interface Probed by a Single-Molecule Force Sensor. Small. 5 (24), 2864-2869 (2009).
- Morfill, J., et al. Affinity-matured recombinant antibody fragments analyzed by single-molecule force spectroscopy. Biophysical journal. 93 (10), 3583-3590 (2007).
Access restricted. Please log in or start a trial to view this content.
Reprints and Permissions
Request permission to reuse the text or figures of this JoVE article
Request PermissionThis article has been published
Video Coming Soon
Copyright © 2025 MyJoVE Corporation. All rights reserved