Method Article
Integration of Wet and Dry Bench Processes Optimizes Targeted Next-generation Sequencing of Low-quality and Low-quantity Tumor Biopsies
In This Article
Summary
An integrated system for targeted next-generation sequencing of oncology specimens is described. This cross-platform system is optimized for low-quality and low-quantity tumor biopsies, accommodates low DNA inputs, includes well-characterized multi-variant controls, and features a novel variant caller that is informed by quantitative pre-analytical quality control measures.
Abstract
All next-generation sequencing (NGS) procedures include assays performed at the laboratory bench ("wet bench") and data analyses conducted using bioinformatics pipelines ("dry bench"). Both elements are essential to produce accurate and reliable results, which are particularly critical for clinical laboratories. Targeted NGS technologies have increasingly found favor in oncology applications to help advance precision medicine objectives, yet the methods often involve disconnected and variable wet and dry bench workflows and uncoordinated reagent sets. In this report, we describe a method for sequencing challenging cancer specimens with a 21-gene panel as an example of a comprehensive targeted NGS system. The system integrates functional DNA quantification and qualification, single-tube multiplexed PCR enrichment, and library purification and normalization using analytically-verified, single-source reagents with a standalone bioinformatics suite. As a result, accurate variant calls from low-quality and low-quantity formalin-fixed, paraffin-embedded (FFPE) and fine-needle aspiration (FNA) tumor biopsies can be achieved. The method can routinely assess cancer-associated variants from an input of 400 amplifiable DNA copies, and is modular in design to accommodate new gene content. Two different types of analytically-defined controls provide quality assurance and help safeguard call accuracy with clinically-relevant samples. A flexible "tag" PCR step embeds platform-specific adaptors and index codes to allow sample barcoding and compatibility with common benchtop NGS instruments. Importantly, the protocol is streamlined and can produce 24 sequence-ready libraries in a single day. Finally, the approach links wet and dry bench processes by incorporating pre-analytical sample quality control results directly into the variant calling algorithms to improve mutation detection accuracy and differentiate false-negative and indeterminate calls. This targeted NGS method uses advances in both wetware and software to achieve high-depth, multiplexed sequencing and sensitive analysis of heterogeneous cancer samples for diagnostic applications.
Introduction
Precision medicine relies on the individualization of diagnostic and therapeutic options for patients. The promise of tailored treatments is a direct consequence of an improved understanding of disease pathways that can inform the linkage of molecular diagnostics and targeted therapeutics. For example, the use of molecularly-targeted therapies increased from 11% to 46% from 2003 to 20131, and anti-cancer drugs such as vemurafenib and crizotinib are FDA-cleared with companion diagnostic tests. With its ability to accurately recover low-abundance sequence targets across highly multiplexed sample sets, next-generation sequencing (NGS) has emerged as a method of choice for evaluating genetic aberrations associated with cancer and identifying molecular targets for precision medicine.
The most common solid tumor biopsies for molecular testing include formalin-fixed, paraffin-embedded (FFPE) and fine-needle aspiration (FNA) specimens. These samples are fraught with low-quantity and/or low-quality nucleic acids that challenge accurate NGS assessments2-5. Current commercial NGS methods for the analysis of these specimens are based on a patchwork of different reagents, protocols, and informatics tools that represent moving targets of continual improvements. For example, changes in assay chemistries and/or software occurred every 1-2 months for the most commonly-used targeted NGS kits6. This instability reflects a lack of coherence in constructing and verifying a unified NGS system for challenging specimen types, particularly for cancer testing, and puts an undue burden on laboratories to develop cohesive protocols that are optimized from sample-to-results. Indeed, one recent survey of NGS users highlighted the difficulties of these "rapidly changing" technologies, along with the requirements for established, medically-actionable content, entrenched bioinformatics expertise, a solidified and integrated procedure that can be rapidly implemented, and streamlined workflows and simplified protocols that facilitate on-the-job training7. In this article, a comprehensive system for targeted NGS is described that addresses these gaps.
The presented methodology integrates all procedural steps from pre-analytical to post-analytical at both wet and dry benches to improve the accuracy, sensitivity, and reliability of target quantification and detection for NGS of clinically-relevant cancer gene loci. This approach begins with the quantification of "functional" DNA4 to assess DNA quality, guide input into the PCR enrichment step, and guard against false-positive calls that can arise from the interrogation of very low template copies. A single-tube multiplex PCR then enriches for 46 loci in 21 cancer genes using only 400 amplifiable DNA copies, followed by incorporation of platform-specific sequences for NGS using common desktop sequencing instruments. Libraries are purified using a simple magnetic bead procedure and quantified with a novel, calibration-free qPCR assay. A standalone bioinformatics suite, informed by sample DNA QC results to improve call performance, provides sequence analysis following NGS. We present data using this systems approach for targeted NGS to reveal base-substitution mutations, insertion/deletions (indels), and copy number variants (CNVs) in low-quality and low-quantity tumor biopsies such as FFPE and FNA samples, and run controls.
Protocol
Note: This protocol describes the simultaneous processing of samples using a MiSeq NGS System but can be adapted for the Personal Genome Machine (PGM) instrument. For the recommended minimum DNA input of 400 amplifiable template copies, the assay is capable of producing at least 3,000x median coverage for each of 96 samples per NGS run, and equivalent coverage depth for 24 samples using the PGM on a 318 chip. The method also requires the use of a real-time PCR instrument.
1. DNA Functional Quantification and Quality Control (QC)
- Thaw reagents: 2x Master Mix, Primer Probe Mix, Inhibition Primer Probe Mix, 6-carboxy-X-rhodamine (ROX), Diluent, and the four human genomic DNA calibration curve standards (DNA Standard (50 ng/µl), DNA Standard (10 ng/µl), DNA Standard (2 ng/µl), and DNA Standard (0.4 ng/µl)) (Table 1). Vortex all reagents for 10 sec and centrifuge at maximum speed for 10 sec to collect contents. Keep the 2x master mix on ice.
- Prepare a sufficient amount of master mix for the total number of samples to be tested and include 10% more volume to avoid shortages due to pipetting. Prepare the master mix in a microcentrifuge tube using the following volumes per sample: 5 µl 2x Master Mix, 0.5 µl Primer Probe Mix, 0.5 µl Inhibition Primer Probe Mix, 0.05 µl ROX and 2.95 µl Diluent. Vortex for 10 sec and centrifuge at maximum speed for 10 sec to collect contents.
- Add 9 µl master mix into wells of a 96-well plate.
- Add 1 µl of the DNA Standards in duplicate to generate a calibration curve. Mix by pipetting up-and-down 5 times.
- Ensure the nucleic acid sample is well mixed before use. Add 1 µl sample to the master mix and mix by pipetting up-and-down 5 times.
- Seal the plate, vortex for 10 sec and centrifuge at maximum speed for 10 sec to collect contents.
- Place the plate into the PCR System. Assign both FAM (functional quantification) and VIC (functional inhibition) detectors for each sample according to the manufacturer's instructions. Perform PCR cycles of 10 min at 95 °C, and 40 cycles (15 sec at 95 °C, 1 min at 60 °C).
- Analyze the qPCR data by generating a linear regression plot for each of the duplicate DNA standards using software protocols.
- Plot the Log10 of the copy number for each DNA standard on the x-axis and the corresponding FAM Cq value on the y-axis.
- Confirm that the results from the nucleic acid sample fall within the dynamic range of the DNA Standards calibration curve, and then calculate the concentration of the unknown DNA in "functional" or amplifiable copy number per µl from its corresponding position on the reference standard curve. Figure 1 shows examples of calibration curves that passed and failed.
- Determine if amplification occurred in each reaction by checking for the presence of the non-human target amplicon in the VIC channel.
Note: As a positive control, the Inhibition Primer Probe Mix contains primers specific for a non-human exogenous target and the corresponding template. The Inhibition Primer Probe Mix is a component of the master mix which is added to each reaction, including the no-template control (NTC). In absence of an inhibitor, the PCR product for the non-human target should always be detected in the VIC channel. An "undetected" Cq for a sample in the VIC channel indicates the presence of PCR inhibitors that may benefit from subsequent clean-up of the sample prior to further processing.
2. Library Preparation: Gene-specific (GS) PCR
- Prepare a sufficient amount of master mix for the total number of samples to be tested and include 10% more volume to avoid shortages due to pipetting. Prepare the GS PCR master mix in a microcentrifuge tube using the following volumes per sample: 5 µl 2x Amplification Master Mix (Table 1) and 1 µl Pan Cancer Primer Panel (Table 1). Mix by pipetting up-and-down, vortex for 10 sec and centrifuge at maximum speed for 10 sec to collect contents.
- Aliquot the 6 µl GS PCR master mix into wells of a 96-well plate. Add 4 µl of each nucleic acid sample into individual wells. To other wells, add 4 µl of the FFPE Control (Table 1), 4 µl of the Multi-Variant control (Table 1), and 4 µl of nuclease-free water for a procedural NTC. For each addition, mix by pipetting up-and-down 5 times.
- Seal the plate, vortex for 10 sec and centrifuge at maximum speed for 10 sec to collect contents.
- Place the plate in the thermocycler for the following PCR cycles: 5 min at 95 °C, 2 cycles (15 sec at 95 °C, 4 min at 60 °C), 23 cycles (15 sec at 95 °C, 4 min at 72 °C), and a final extension of 10 min at 72 °C. Hold at 4 °C.
Note: After completion of step 2.4, the plate will be referred to as the GS PCR plate.
3. Library Preparation: Tag PCR
- Thaw reagents: 2x Index Master Mix (Table 1) and Index Codes (Table 1). Vortex for 10 sec and centrifuge at maximum speed for 10 sec to collect contents.
Note: Index Codes are premixed to provide a unique set of pairwise indices (barcodes) for each sample. - In a 96-well plate, add 7.5 µl of the 2x Index Master Mix and 5.5 µl of an Index Code to a specified well and mix by pipetting up-and-down 5 times.
- Carefully open the GS PCR plate, and add 2 µL GS PCR product to the new plate with the master mix. Mix by pipetting up-and-down 5 times. For each sample, record the Sample ID and the corresponding pairwise Index Codes. Seal the plate, vortex for 10 sec and centrifuge at maximum speed for 10 sec to collect contents.
- Place the plate in the thermocycler and PCR for 5 min at 95 °C, 10 cycles (30 sec at 95 °C, 30 sec at 55 °C, 1 min at 72 °C), and a final extension of 10 min at 72 °C. Hold at 4 °C.
Note: After completion of step 3.4, the plate will be referred to as the Tag PCR plate.
4. Library Purification and Size Selection
- Remove the Library Pure Prep magnetic beads (Table 1) and Elution Buffer (Table 1) from 2-8 °C and allow to equilibrate to RT for 30 min. Add 9.6 ml 100% ethanol to the Wash Buffer (Table 1) container, cap and mix by inverting the bottle several times.
- Vortex the magnetic beads for 10 sec and add 11 µl into separate wells of a 96-well plate.
- Open the Tag PCR plate and add 10 µl of Tag PCR product to the beads and pipet mix 5 times. Incubate the mixture for 4 min at RT.
- Place the 96-well plate on the magnetic stand (Table 1) for 4 min. With the 96-well plate still on the stand, remove and discard the supernatant with a pipette.
- Remove the 96-well plate from the magnetic stand and add 100 µl ethanol-containing Wash Buffer to each well and mix by pipetting up-and-down 5 times. Incubate for 2 min.
- Place the 96-well plate on the magnetic stand for 2 min, then remove and discard the supernatant with a pipette.
- Repeat step 4.5, for a total of 2 ethanol washes, removing as much wash solution possible after the second wash.
- With the 96-well plate on the magnetic stand, dry the beads for 2 min at RT, then remove the plate from the stand.
- Resuspend the beads by adding 20 µl Elution Buffer to each well and pipet up-and-down 5 times.
- Incubate for 2 min at RT.
- Place the 96-well plate back on the magnetic stand for 4 min, and carefully remove and transfer 18 µl of the clear supernatant to a new well.
Note: The procedure may be safely stopped at this step and samples stored at -15 to -30°C. To restart, thaw frozen samples on ice before proceeding.
5. Library Quantification
- Thaw Library Quant (LQ) reagents: 2x LQ Master Mix, LQ Primer / Probe Mix, LQ Standard, LQ Positive Control, LQ Diluent, and LQ ROX (Table 1). Vortex for 10 sec and centrifuge at maximum speed for 10 sec to collect contents.
- Using purified library products, perform a serial dilution of each individual sample in LQ Diluent.
- Add 2 µl (library purified product) to 198 µl LQ Diluent and mix up-and-down with a pipet 10 times.
- Add 2 µl (1:100 dilution) to 198 µl LQ Diluent and mix up-and-down with a pipet 10 times.
- Prepare a sufficient amount of LQ master mix for the total number of samples to be tested and include 10% more volume to avoid shortages due to pipetting. Prepare the LQ Master Mix in a microcentrifuge tube using the following volumes per sample: 5 µl 2X LQ Master Mix, 2 µl LQ Primer/Probe Mix, 0.5 µl LQ Standard and 0.5 µl LQ ROX. Mix by pipetting up-and-down, vortex for 10 sec and centrifuge at maximum speed for 10 sec to collect contents.
- Add 8 µl LQ master mix to a well of an optical 96-well plate.
- In separate wells, add 2 µl diluted library, 2 µl LQ Positive Control and 2 µl LQ Diluent (NTC) and mix by pipetting up-and-down 5 times. Seal the plate with optical adhesive film, vortex for 10 sec and centrifuge at 400 x g for 10 sec to collect contents.
- Assign both FAM and VIC detectors for each sample. Perform PCR amplification using cycling conditions of 5 min at 95 °C, and 40 cycles (15 sec at 95 °C, 1 min at 60 °C).
- Determine the concentration of each sample (nM) using the comparative Cq method. Calculate the difference of the known LQ Standard (Cq VIC) to the unknown library (Cq FAM). The concentration of the Diluted Sample (pM) is calculated using the following equation:
[Conclib]nM = 12.5 x 2ΔCq
If using a dilution factor other than 10,000, calculate the ratio of the target dilution factor to 10,000, and multiply this factor by the result of the equation in 5.7.
6. Library Normalization and Sample Pooling
- Determine the median concentration (nM) across all samples (each containing a unique pairwise index) to be pooled.
- Determine the individual sample volume (µl) to pool by multiplying the median concentration across all samples by 5, then dividing by its individual concentration (nM). Round the resulting value to the nearest integer. Round volumes with values of <2 µl to 2 µl, and volumes >15 µl to 15 µl.
- Add the normalized volume (µl) for each sample to a single microcentrifuge tube to create the sample pool.
- Calculate the new concentration for each sample using rounded integer values and record the results.
- To determine the concentration of the sample pool, calculate the sum of all individual concentrations and record the resulting value (nM).
- Dilute the sample pool to 1.25 nM using Sequencing Diluent (Table 1).
Note: The procedure may be safely stopped at this step and samples stored at -15 to -30 °C. To restart, thaw frozen samples on ice before proceeding.
7. Sequencing
- Denature the sample pool in the presence of PhiX Control v3 (Table 1) by adding the following: 15 µl of 1.25 nM Sample Pool, 3 µl of 0.5 nM PhiX and 2 µl of 1 N NaOH. Vortex briefly followed by a brief centrifugation and incubate for 5 min at RT.
- Place the denatured sample pool on ice.
- Add 8 µl of denatured library to 992 µl of pre-chilled HT1-Hyb buffer to a microcentrifuge tube. Vortex briefly to mix, followed by a brief centrifugation to collect contents. Keep on ice.
- Add 600 µl of the denatured and diluted library to position #17 of the reagent cartridge.
- Thaw Read 1 Sequencing Primers (Table 1), Index Read Sequencing Primers (Table 1), and Read 2 Sequencing Primers (Table 1). In microcentrifuge tubes, separately dilute 4 µl Sequencing Primers with 636 µl HT1-Hyb buffer. Note: HT1-Hyb buffer is provided with the sequencing reagent kit (Table 1).
- Mix by vortexing for 10 sec and centrifuge at maximum speed for 10 sec to collect contents. Add 600 µl of diluted Read 1 Sequencing Primers to position #18 of the sequencing reagent cartridge, 600 µl of diluted Index Read Primers to position #19, and 600 µl of diluted Read 2 Sequencing Primers to position #20.
- Load the reagents on the NGS instrument (Table 1) and sequence according to the manufacturer's instructions. Perform a paired-end 2 x 150 cycle sequencing run.
8. Data Analysis
Note: The NGS instrument software converts cluster images to base calls and quality scores, and demultiplexes pairwise indices to generate individual gzip-compressed FASTQ (*.fastq.gz) files for each sample. Prior to analyzing the demultiplexed files, the reader must download and install the associated bioinformatics software (Table 1). The software can be installed on a consumer-grade Windows PC and does not require specialized computing hardware or an internet connection to perform the data analysis.
- Double-click the software desktop icon.
- Login to the system using the username and password provided in the software manual.
- Open the project dashboard, and click "New Project".
- Name the project and provide an optional project description. Select the targeted NGS panel type and NGS instrument type. Click "Save and continue".
- Upload the compressed FASTQ files for the forward and reverse reads. Do not upload the "unassigned" FASTQs, which contain reads that failed to demultiplex. Click "Save and continue".
- Input the number of functional input copies used to prepare each library as determined by the DNA functional quantification assay (see Step 1 above). Manually add values or copy and paste values from a spreadsheet into the annotation table. Click "Save and continue."
- Review the annotated libraries uploaded for analysis and click "Submit analysis" to initiate the analysis.
- Monitor the progress of the analysis displayed through the project dashboard.
Note: An analysis complete status indication is presented when the results are ready for review. - Review the analyzed results for sample QC metrics including total coverage per library, percentage of reads passing filters, amplicon coverage depth and uniformity. Review the variant calls for each sequenced library with dbSNP, COSMIC, 1,000 genomes and other sources of functional and population level annotation.
- Export the raw results as summary spreadsheet tables, *.bam files and *.vcf files for long-term storage or downstream analysis with complementary informatics tools.
Results
A total of 90 samples (74 unique) representing positive and negative controls, previously characterized cell lines, and residual clinical FFPE tumor biopsies were assessed for amplifiable DNA, input into multiplex PCR enrichment, tagged with sequence adapters, barcoded, and analyzed in a single benchtop NGS instrument run (Figure 2) that produced 19.1 M reads passing filter. Equimolar sample pooling resulted in high depth sequencing (3,692x reads) and uniform coverage (97.8% of amplicons covered within 5-fold of the median read depth). Outliers comprised no-template controls, one cell-line DNA with a large copy number amplification, and one FFPE DNA that was flagged for PCR inhibition by the pre-analytical QC assay (Figure 3). Coverage uniformity across the 46 amplicons was maintained using three different operators (Figure 4A), and for different low-quality FFPE DNA samples (Figure 4B). An FFPE tumor DNA control, formulated from a mixture of residual clinical specimens to achieve 5% BRAF V600E (quantified by droplet digital PCR), was reported to have the target BRAF mutation at abundances of 3.9, 5.3, and 6.5% by three operators using an input of 400 amplifiable copies (and thus only 20 mutant copies) (Figure 4B and "FFPE3" of inset table). Further, a mixture of 12 synthetic DNA templates, each representing a known "driver" base-substitution mutation, revealed the expected mutations at the intended range of 9 - 17% mean allele frequency (Table 2). Dilution of cell-line and FFPE DNA samples with copy number amplifications demonstrated dose-dependence for variants in EGFR and KRAS, respectively (Figure 5). Importantly, FFPE DNA input could be reduced to as few as 50 amplifiable copies or 1.2 ng of bulk DNA while preserving the detection of known mutations without false-positive calls (Figure 6). DNA inputs were accommodated over a 100-fold range up to at least 50,000 amplifiable copies (Table 3). In this and related experiments, variant calls in 22 FFPE and 20 FNA specimens were reported in agreement with independent methods with shared mutation coverage (Table 4).
The sensitivity and positive predictive value for the assay was determined from an analysis of 97 samples, including FFPE, FNA, fresh-frozen, and cell-line DNA, and a total of 195 sequencing results. The results revealed 365 true positive variant calls, 4 false negative calls, and 1 false positive call for a sensitivity of 98.9% (95% CI: 97.1-99.7%) and a positive predictive value (PPV) of 99.7% (95% CI: 98.2-99.99%). Analyses of indels were performed for two common EGFR variants (p.E746_A750delELREA and p.V769_D770insASV) in 33 sample-runs, demonstrating a sensitivity of 93.9% (95% CI: 78.4-98.9%) and a PPV of 100% (95% CI: 86.3-100%) with variants detected over a range of 2.4-84.8%.
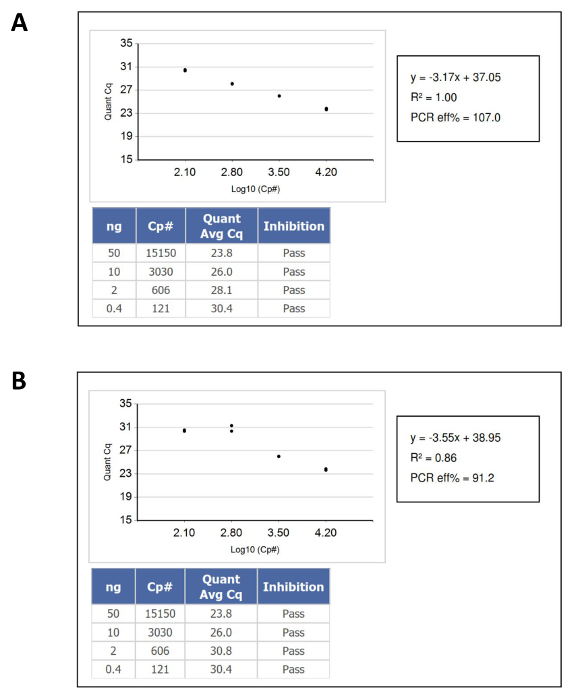
Figure 1: An Example of DNA Quantification Calibration Curves that Pass and Fail QC Criteria. (A) A passing standard curve. (B) A failing standard curve. In this case, the failure was caused by duplicate pipetting of the lowest input DNA standard. Please click here to view a larger version of this figure.
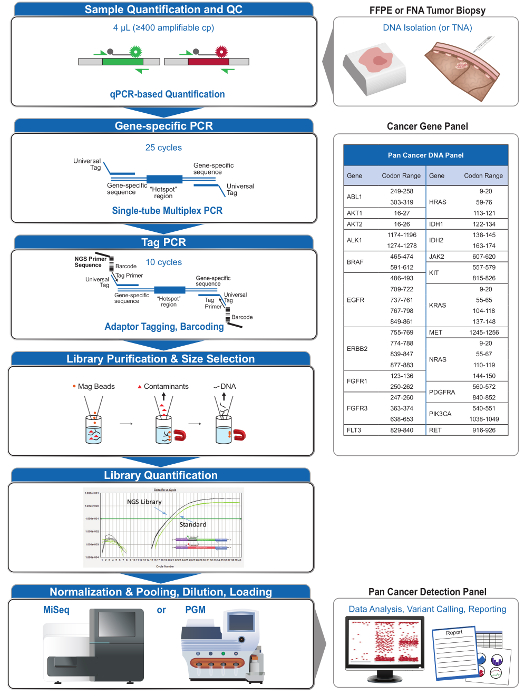
Figure 2: Overview of a Comprehensive Targeted NGS System for Oncology Applications that Integrates Pre-analytical, Analytical, and Post-analytical Workflows. Please click here to view a larger version of this figure.
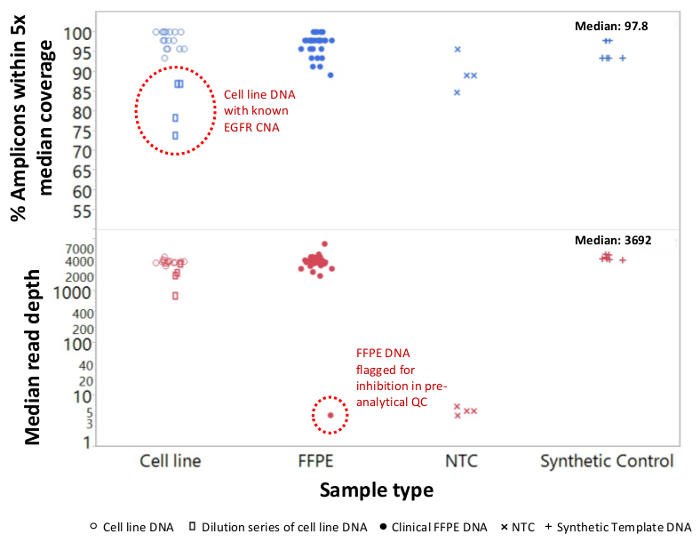
Figure 3: Read Coverage and Uniformity for Targeted NGS of Cancer Genes in Low-quality FFPE DNA Compared to Intact Cell-line DNA and Controls. A total of 90 samples that included residual clinical FFPE (closed circles), cell-line (open circles), and synthetic template DNA (plus symbols) were processed using single-tube, 21-gene multiplex PCR enrichment. Each amplicon library was tagged with adapter sequences for the NGS instrument, barcoded with a distinct dual-index code, purified, quantified, and normalized to a concentration of 2.5 nM. The DNA library was sequenced and analyzed by the companion bioinformatics software. Sample deviations included a dilution series of MDA-MB-468 cell-line DNA bearing a large EGFR copy number amplification (top, open rectangles within dotted circle) that distorted coverage uniformity and one melanoma FFPE sample that failed to generate an appreciable number of reads due to carryover of PCR inhibitors from the DNA extraction. The melanoma sample failure (bottom, dotted circle) was predicted by the pre-analytical qPCR DNA QC assay. NTC, no-template control (x symbols). Please click here to view a larger version of this figure.
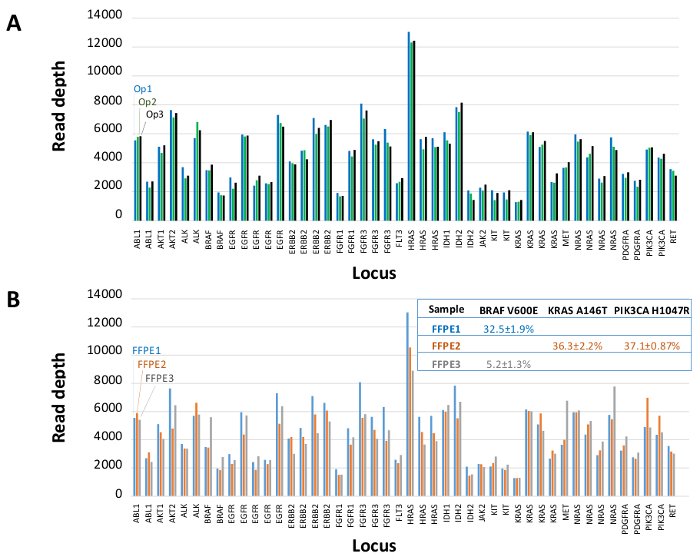
Figure 4: Amplicon-by-amplicon Read Coverage, Uniformity and Variant Detection in Residual Clinical FFPE Tumor DNA. (A) Read coverage across all enriched loci in a representative FFPE DNA sample measured across three different operators. Operator 1, Op1 (blue bars); Operator 2, Op2 (green bars); Operator 3, Op3 (black bars). (B) Coverage uniformity and variant calls evaluated using three FFPE tumor samples, including a control mixture (FFPE3, gray bars and text) comprised of a known 5% BRAF c.1799T>A mutation. FFPE1 (blue bars and text), FFPE2 (orange bars and text). Please click here to view a larger version of this figure.
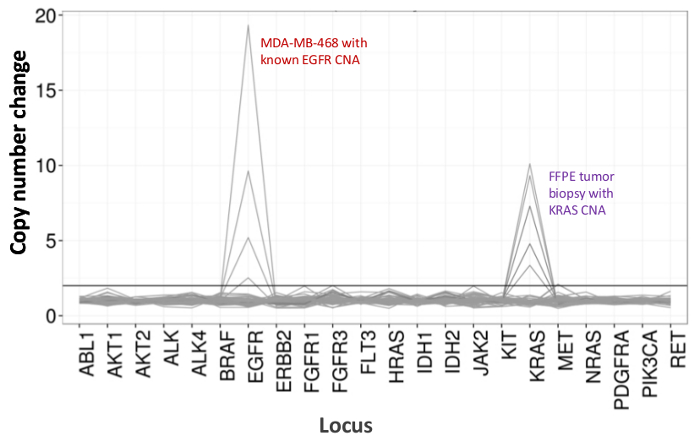
Figure 5: Dose-dependent Detection of Copy Number Variants in Cell-line and FFPE DNA. MDA-MB-468 cell-line DNA with a well-characterized EGFR copy number amplification was progressively diluted in a background of a reference non-mutated cell-line DNA to illustrate the decrease in copy number change as a function of the dilution. The percentage of each cell-line DNA sample is shown with a distinct line (0, 12.5, 25, 50, and 100%). Dilution of an ovarian FFPE tumor sample with a known KRAS amplification revealed a similar profile using the same titration series but with replicates of 100% FFPE DNA for the two top lines. Please click here to view a larger version of this figure.
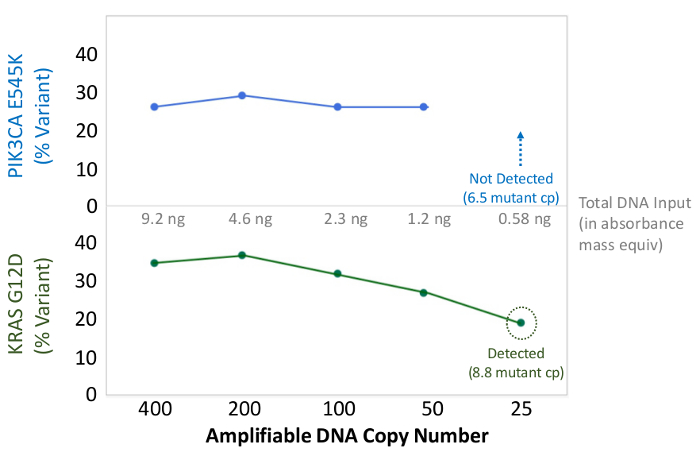
Figure 6: Accurate Mutation Detection and Quantification to 50 Amplifiable FFPE DNA Copies, or 1.2 ng Bulk DNA. The amplifiable copy number of a colon cancer FFPE DNA was determined by the qPCR-based QC assay, and diluted from 400 to 25 copies as an input into multiplex PCR enrichment prior to sequencing. The bioinformatics pipeline correctly called both of the known variants down to 50 copies, or the equivalent of ~10 mutant templates. Please click here to view a larger version of this figure.
| Name of Material/Material | Company | Catalog Number |
| 2x Quantidex Master Mix | Asuragen | 145345 |
| Quant Primer Probe Mix | Asuragen | 145336 |
| Inhibition Primer Probe Mix | Asuragen | 145344 |
| ROX | Asuragen | 145346 |
| Diluent | Asuragen | 145339 |
| DNA Standard (50) | Asuragen | 145340 |
| DNA Standard (10) | Asuragen | 145341 |
| DNA Standard (2) | Asuragen | 145342 |
| DNA Standard (0.4) | Asuragen | 145343 |
| 2x Amplification Master Mix | Asuragen | 145348 |
| Pan Cancer Primer Panel | Asuragen | 145347 |
| Pan Cancer FFPE Control | Asuragen | 145349 |
| Pan Cancer Multi-Variant Control | Asuragen | 145350 |
| Library Pure Prep Beads | Asuragen | 145351 |
| Wash Buffer | Asuragen | 145352 |
| Elution Buffer | Asuragen | 145353 |
| 2x LQ Master Mix | Asuragen | 145358 |
| LQ Diluent | Asuragen | 145354 |
| LQ Positive Control | Asuragen | 145355 |
| LQ Standard | Asuragen | 145356 |
| LQ Primer / Probe Mix (ILMN) | Asuragen | 145357 |
| LQ ROX | Asuragen | 145359 |
| Index Codes (ILMN) - Set A | Asuragen | 150004 |
| AIL001 - AIL048 (48) | ||
| Index Codes (ILMN) - Set B | Asuragen | 150005 |
| AIL049 - AIL096(48) | ||
| 2x Index Master Mix | Asuragen | 145361 |
| Read 1 Sequencing Primers | Asuragen | 150001 |
| Index Read Sequencing Primers | Asuragen | 150002 |
| Read 2 Sequencing Primers | Asuragen | 150003 |
| Sequencing Diluent | Asuragen | 145365 |
| Illumina MiSeq | Illumina | |
| MiSeq Reagent Kit v3 (600-cycle) | Illumina | MS-102-3003 |
| MiSeq Reagent Nano Kit v2 (300-cycle) | Illumina | MS-103-1001 |
| PhiX Control v3 | Illumina | FC-110-3001 |
| Magnetic Stand-96 (Or equivalent device) | Ambion | AM10027 |
| Quantidex Reporter Software | Asuragen |
Table 1: Reagents and Kits. Upon first use of the ROX, store the vial at 2-8 °C. Do not refreeze. Software can be downloaded at www.asuragen.com.
| Gene | COSMIC variant | COSMIC amino acid | % Variant |
| NRAS | c.182A>G | p.Q61R | 13.3 |
| NRAS | c.35G>A | p.G12D | 15.2 |
| HRAS | c.182A>G | p.Q61R | 17.8 |
| HRAS | c.35G>A | p.G12D | 9.2 |
| KRAS | c.182A>G | p.Q61R | 13.5 |
| KRAS | c.35G>A | p.G12D | 19.1 |
| PIK3CA | c.1633G>A | p.E545K | 9.3 |
| PIK3CA | c.3140A>G | p.H1047R | 9.1 |
| KIT | c.2447A>T | p.D816V | 14.6 |
| EGFR | c.2369C>T | p.T790M | 11.3 |
| EGFR | c.2573T>G | p.L858R | 14.9 |
| BRAF | c.1799T>A | p.V600E | 17.3 |
Table 2: A Pooled Synthetic Control is Comprised of 12 “Driver” Cancer Gene Variants that are Quantified at 9-17% Abundance. A mixture of 12 different double-stranded synthetic templates bearing 12 distinct mutations was evaluated following sequencing. All variants were correctly called with no false positives.
| Sample ID | Functional cps | Gene | COSMIC variant | COSMIC amino acid | % Variant | Median read depth | % within 5x of median |
| BCPAP | 400 | BRAF | c.1799T>A | p.V600E | 99.5 | 3289 | 96% |
| BCPAP | 10,000 | BRAF | c.1799T>A | p.V600E | 99.7 | 4040 | 98% |
| BCPAP | 25,000 | BRAF | c.1799T>A | p.V600E | 99.4 | 3687 | 96% |
| BCPAP | 50,000 | BRAF | c.1799T>A | p.V600E | 99.7 | 4611 | 93% |
Table 3: Coverage and Variant Calling are Preserved Over a >100-fold Range of DNA Input. Amplifiable DNA from a BCPAP cell line was input into multiplex PCR enrichment at 400 to 50,000 copies and sequenced. Read depth, coverage uniformity, mutation detection, and mutation accuracy were preserved across the input range.
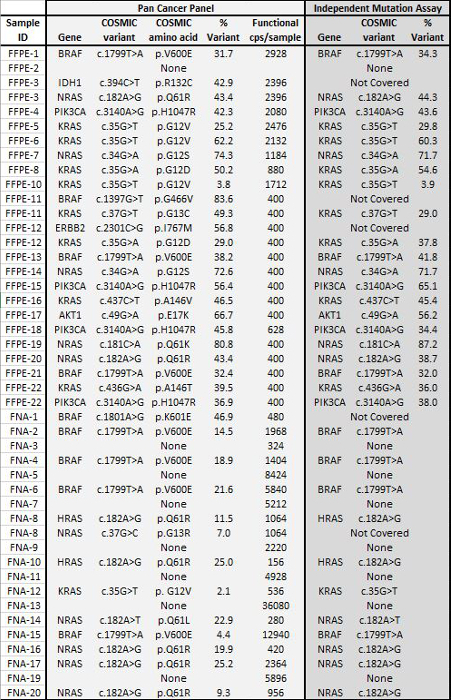
Table 4: Variant Calls in 22 FFPE and 20 FNA Tumor Biopsies Agree with Results from Independent Mutation Assays. A set of 22 FFPE tumor DNA with mutation status previously determined by orthogonal targeted NGS assays was input at 400 to 2,928 amplifiable copies into the PCR enrichment step and sequenced using the 21-gene Pan Cancer panel. In addition, a cohort of 20 FNA DNA samples previously characterized using a liquid bead array mutation assay8 was PCR amplified using 156 to 36,080 input amplifiable copies and sequenced. All overlapping calls between the Pan Cancer NGS panel and the reference methods were in agreement. Please click here to view a larger version of this figure.
Discussion
NGS technologies have redefined expectations for interrogating the molecular profiles of tumor biopsies in clinical settings9. A number of targeted NGS panels have been developed as research technologies, laboratory developed tests, and commercially available products and custom panels for assessing multiple types of clinical specimens3,5,10-15. Reports from multiple studies have demonstrated the value of NGS as a sensitive and specific clinical tool for the detection of genomic alterations3,10-12,14. Yet studies have also demonstrated the risk of artifacts which can cause false-positive results from challenging cancer biopsies such as FFPE specimens2-5,12,14. Additionally, recent publications have highlighted high failure rates for NGS using oncology specimens16 and false-positive calls with commercial targeted NGS panels that are aggravated by the use of low-input DNA12. As a result, some laboratories have either modified or added additional checks and balances to commercially available targeted NGS technologies to improve performance, often to ensure accuracy or confirm the findings from the bioinformatic analyses5,10,11.
The 21-gene panel (Figure 2) was developed as targeted content for a comprehensive NGS system to interrogate evidence-based, actionable mutations in challenging specimen types such as FFPE and FNA tumor biopsies. The workflow has a number of benefits: 1) consistency by providing uniform amplicon coverage (Figures 3 and 4, Table 3); 2) ease-of-use by providing pre-formulated, optimized reagent sets, and simplifying the bioinformatics requirements; 3) efficiency by streamlining the workflow and reducing the number of pipetting steps as compared to other commercial NGS methods; and 4) accuracy by incorporating a DNA QC assay for assessing the amplifiable DNA copy number to ensure acceptable template diversity and avoid stochastic fluctuations in variant detection4. The integration of the pre-analytical QC data with the bioinformatics analysis allows for low inputs of FFPE DNA. This was achieved by training a decision-tree algorithm using different functional copies of DNA input across 400 FFPE samples with independent measures of truth, and incorporating this algorithm into the bioinformatic software. As a result, the recommended input of 400 amplifiable copies, typically equivalent to ~5-20 ng of FFPE DNA, compares favorably to other methods10-12, including hybridization-based enrichment where ~250 ng of FFPE DNA is recommended17,18. Although the technique is described for use on a MiSeq platform, it can be modified by using Tag PCR primers with instrument-specific adaptors to enable sequence analysis on other NGS platforms.
Several steps are critical to ensure success of the procedure. The pre-analytical QC assay determines the amplifiable copy number of DNA and reports functional inhibition. However, if less than 400 amplifiable DNA copies are used in the PCR enrichment step, there is an increased risk of a false-negative call from samples with low-abundance mutations (Figure 6). Additionally, care must be taken during library purification to prevent over-drying of the magnetic beads during the washing or elution steps. Furthermore, successful library quantification is highly dependent on the accurate dilution of library DNA. For the best outcome, the difference of the qPCR results for the sample library (Cq FAM) compared to the LQ Standard (Cq VIC) should be ≤3.3 Cq. If the difference is greater than 3.3 Cq, re-dilution and testing of the sample is recommended. Although an excellent correlation has been observed between this competitive qPCR method and commercial kits that offer absolute quantification using a standard curve, an offset of the library input into the clonal amplification step relative to other methods may be necessary to achieve optimal seeding density.
Some cancer specimens are particularly challenging to sequence because of inhibitors that persist after DNA isolation. To identify these samples prior to library preparation, the qPCR QC assay also detects amplification inhibition by including an exogenous template that serves as both an internal control and a sentinel for functional inhibition. An example is presented in Figure 3 in which a melanoma DNA sample failed to pass the QC inhibition metric prior to sequencing and then failed to generate a library that could be sequenced. The failure was likely a consequence of melanin contamination, a known PCR inhibitor, carried over from the FFPE DNA isolation step. Samples that are identified by the QC assay to be at risk for amplification failure may be salvaged through an extra clean-up step to remove potential inhibitors.
The targeted 21-gene panel focuses on evidence-based gene hotspots and provides a complete system with optimized reagents and controls for DNA QC, NGS and bioinformatics software that is informed by pre-analytical "functional" DNA quantification results. The method accurately detects base-substitution mutations and indels from low-input DNA, and provides an example of an NGS system with the option to expand panel content, to detect additional variants such as CNVs and be adapted for targeted RNA sequencing.
Disclosures
JH, AH, RZ, BCH, and GJL are employees and have stock ownership in Asuragen, Inc. RZ, BCH, and GJL are co-inventors on a patent application for improving variant calling using amplifiable copy number information determined for each sample.
Acknowledgements
We thank Dr. Annette Schlageter for review of the manuscript. This work was supported in part by grant CP120017 from the Cancer Prevention and Research Institute of Texas (PI: GJL).
Materials
| Name | Company | Catalog Number | Comments |
| 2x Quantidex Master Mix | Asuragen | 145345 | |
| Quant Primer Probe Mix | Asuragen | 145336 | |
| Inhibition Primer Probe Mix | Asuragen | 145344 | |
| ROX | Asuragen | 145346 | |
| Diluent | Asuragen | 145339 | |
| DNA Standard (50) | Asuragen | 145340 | |
| DNA Standard (10) | Asuragen | 145341 | |
| DNA Standard (2) | Asuragen | 145342 | |
| DNA Standard (0.4) | Asuragen | 145343 | |
| 2X Amplification Master Mix | Asuragen | 145348 | |
| Pan Cancer Primer Panel | Asuragen | 145347 | |
| Pan Cancer FFPE Control | Asuragen | 145349 | |
| Pan Cancer Multi-Variant Control | Asuragen | 145350 | |
| Library Pure Prep Beads | Asuragen | 145351 | |
| Wash Buffer | Asuragen | 145352 | |
| Elution Buffer | Asuragen | 145353 | |
| 2X LQ Master Mix | Asuragen | 145358 | |
| LQ Diluent | Asuragen | 145354 | |
| LQ Positive Control | Asuragen | 145355 | |
| LQ Standard | Asuragen | 145356 | |
| LQ Primer/Probe Mix (ILMN) | Asuragen | 145357 | |
| LQ ROX | Asuragen | 145359 | |
| Index Codes (ILMN) - Set A, AIL001 - AIL048 (48) | Asuragen | 150004 | |
| Index Codes (ILMN) - Set B, AIL049 - AIL096(48) | Asuragen | 150005 | |
| 2x Index Master Mix | Asuragen | 145361 | |
| Read 1 Sequencing Primers | Asuragen | 150001 | |
| Index Read Sequencing Primers | Asuragen | 150002 | |
| Read 2 Sequencing Primers | Asuragen | 150003 | |
| Sequencing Diluent | Asuragen | 145365 | |
| Illumina MiSeq | Illumina | ||
| MiSeq Reagent Kit v3 (600-cycle) | Illumina | MS-102-3003 | |
| MiSeq Reagent Nano Kit v2 (300-cycle) | Illumina | MS-103-1001 | |
| PhiX Control v3 | Illumina | FC-110-3001 | |
| Magnetic Stand-96 (Or equivalent device) | Ambion | AM10027 | |
| Quantidex Reporter Software | Asuragen |
References
- Chen, G., Mosier, S., Gocke, C. D., Lin, M. T., Eshleman, J. R. Cytosine deamination is a major cause of baseline noise in next-generation sequencing. Mol Diagn Ther. 18 (5), 587-593 (2014).
- Choudhary, A., et al. Evaluation of an integrated clinical workflow for targeted next-generation sequencing of low-quality tumor DNA using a 51-gene enrichment panel. BMC Med Genomics. 7, 62 (2014).
- Sah, S., et al. Functional DNA quantification guides accurate next-generation sequencing mutation detection in formalin-fixed, paraffin-embedded tumor biopsies. Genome Med. 5 (8), 77 (2013).
- Zhang, L., et al. Profiling cancer gene mutations in clinical formalin-fixed, paraffin-embedded colorectal tumor specimens using targeted next-generation sequencing. Oncologist. 19 (4), 336-343 (2014).
- Latham, G. J. Next-generation sequencing of formalin-fixed, paraffin-embedded tumor biopsies: navigating the perils of old and new technology to advance cancer diagnosis. Expert Rev Mol Diagn. 13 (8), 769-772 (2013).
- Crawford, J. M., et al. The business of genomic testing: a survey of early adopters. Genet Med. 16 (12), 954-961 (2014).
- Smith, D. L., et al. A multiplex technology platform for the rapid analysis of clinically actionable genetic alterations and validation for BRAF p.V600E detection in 1549 cytologic and histologic specimens. Arch Pathol Lab Med. 138 (3), 371-378 (2014).
- Thomas, F., Desmedt, C., Aftimos, P., Awada, A. Impact of tumor sequencing on the use of anticancer drugs. Curr Opin Oncol. 26 (3), 347-356 (2014).
- Singh, R. R., et al. Clinical validation of a next-generation sequencing screen for mutational hotspots in 46 cancer-related genes. J Mol Diagn. 15 (5), 607-622 (2013).
- Beadling, C., et al. Combining highly multiplexed PCR with semiconductor-based sequencing for rapid cancer genotyping. J Mol Diagn. 15 (2), 171-176 (2013).
- McCall, C. M., et al. False positives in multiplex PCR-based next-generation sequencing have unique signatures. J Mol Diagn. 16 (5), 541-549 (2014).
- Schleifman, E. B., et al. Next generation MUT-MAP, a high-sensitivity high-throughput microfluidics chip-based mutation analysis panel. PLoS One. 9 (3), e90761 (2014).
- Wong, S. Q., et al. Sequence artefacts in a prospective series of formalin-fixed tumours tested for mutations in hotspot regions by massively parallel sequencing. BMC Med Genomics. 7, 23 (2014).
- Narayan, A., et al. Ultrasensitive measurement of hotspot mutations in tumor DNA in blood using error-suppressed multiplexed deep sequencing. Cancer Res. 72 (14), 3492-3498 (2012).
- Hagemann, I. S., et al. Clinical next-generation sequencing in patients with non-small cell lung cancer. Cancer. 121 (4), 631-639 (2015).
- Won, H. H., Scott, S. N., Brannon, A. R., Shah, R. H., Berger, M. F. Detecting somatic genetic alterations in tumor specimens by exon capture and massively parallel sequencing. J Vis Exp. (80), e50710 (2013).
- Simen, B. B., et al. Validation of a next-generation-sequencing cancer panel for use in the clinical laboratory. Arch Pathol Lab Med. 139 (4), 508-517 (2015).
Reprints and Permissions
Request permission to reuse the text or figures of this JoVE article
Request PermissionThis article has been published
Video Coming Soon
Copyright © 2025 MyJoVE Corporation. All rights reserved