
Method Article
PET Imaging of Neuroinflammation Using [11C]DPA-713 in a Mouse Model of Ischemic Stroke
In This Article
Summary
Positron Emission Tomography (PET) imaging of translocator protein 18 kDa (TSPO) provides a non-invasive means to visualize the dynamic role of neuroinflammation in the development and progression of brain diseases. This protocol describes TSPO-PET and ex vivo autoradiography to detect neuroinflammation in a mouse model of ischemic stroke.
Abstract
Neuroinflammation is central to the pathological cascade following ischemic stroke. Non-invasive molecular imaging methods have the potential to provide critical insights into the temporal dynamics and role of certain neuroimmune interactions in stroke. Specifically, Positron Emission Tomography (PET) imaging of translocator protein 18 kDa (TSPO), a marker of activated microglia and peripheral myeloid-lineage cells, provides a means to detect and track neuroinflammation in vivo. Here, we present a method to accurately quantify neuroinflammation using [11C]N,N-Diethyl-2-[2-(4-methoxyphenyl)-5,7-dimethylpyrazolo[1,5-a]pyrimidin-3-yl]acetamide ([11C]DPA-713), a promising second generation TSPO-PET radiotracer, in distal middle cerebral artery occlusion (dMCAO) compared to sham-operated mice. MRI was performed 2 days post-dMCAO surgery to confirm stroke and define the infarct location and volume. PET/Computed Tomography (CT) imaging was carried out 6 days post-dMCAO to capture the peak increase in TSPO levels following stroke. Quantitation of PET images was conducted to assess the uptake of [11C]DPA-713 in the brain and spleen of dMCAO and sham mice to assess central and peripheral levels of inflammation. In vivo [11C]DPA-713 brain uptake was confirmed using ex vivo autoradiography.
Introduction
Stroke is the fifth leading cause of death and a major cause of disability in the United States1. Ischemic stroke represents an overwhelming majority of these cases (~87%), occurring when there is localized disruption in blood flow to the brain (e.g., by a blood clot or fatty deposit). Oxygen and nutrient supplies to the affected areas are subsequently reduced and a complex pathologic cascade is initiated resulting in neuronal death within the stroke core (infarct) in addition to the surrounding areas. Neuroinflammation is a crucial component in the pathway leading to this damage, with both resident brain immune cells (microglia) and infiltrating peripheral immune cells (neutrophils, T cells, B cells, and monocytes/macrophages) thought to contribute to this destructive cascade2,3. Activated microglia and macrophages are central to this neuroinflammatory response, with reports of both deleterious and beneficial effects following ischemic stroke2. Thus, it is imperative to assess the in vivo contribution of these cells following stroke.
PET is a powerful 3-dimensional molecular imaging technique that enables visualization of biological processes in vivo through the use of specific molecules labeled with positron (β+) emitting radionuclides such as 11C, 13N, 15O and 18F. This non-invasive method has many advantages over ex vivo methods (e.g., immunohistochemistry) as it permits the acquisition of molecular information in real time, in living intact subjects, and allows for longitudinal investigation. PET imaging of TSPO, a marker of activated microglia and peripheral myeloid-lineage cells, provides a means to quantify and track innate immune cell responses within the body, and can be utilized to assess inflammation after stroke and response to therapeutic interventions. TSPO, formerly known as the peripheral-type benzodiazepine receptor, is an 18 kDa protein that is believed to play a role in cholesterol transport and the synthesis of neurosteroids4. Moreover, evidence suggests that TSPO is involved in neuroinflammation and neuronal survival5,6, with reports of increased expression in many neurological disorders involving inflammation including stroke7, dementia8, Parkinson's disease9 and multiple sclerosis10. TSPO is located on outer mitochondrial membranes and is highly expressed in the periphery, particularly in steroid associated tissues (e.g., glands) and with intermediate levels seen in the heart, kidneys, and lungs10.However in the healthy brain, TSPO levels are low and restricted mainly to glia6,11. Upon neuronal injury, such as that observed in stroke, TSPO levels in the central nervous system (CNS) increase significantly. This observed upregulation of TSPO can be exploited to image neuroinflammation in vivo, with expression levels providing an accurate indicator of inflammation severity. Hence, the goal of this method is to accurately quantify thein vivo contribution of neuroinflammation in a mouse model of ischemic stroke using TSPO-PET.
Multiple TSPO tracers have been developed for PET imaging of neuroinflammation. Here, TSPO-PET imaging is described using [11C]DPA-71312, a promising second generation TSPO tracer, which has shown enhanced signal to noise and lower non-specific binding than the more historically used [11C]PK11195 13. As an example, the dMCAO mouse model of stroke was chosen for this method14. This model involves temporal craniotomy and permanent ligation of the distal middle cerebral artery, resulting in focal ischemia of the somatosensory cortex. This is advantageous in pre-clinical stroke research due the high reproducibility of ischemic damage and low mortality rates associated with this model. To date, TSPO-PET imaging studies have yet to be reported in the dMCAO rodent model. However, previous PET imaging studies using the middle cerebral artery occlusion (MCAO) model, a more severe and variable stroke model, in both mice and rats, have reported TSPO expression to increase from day 3 and peak around day 7 post-stroke15,16,17,18. Hence, we performed PET imaging 6 days post-dMCAO to coincide with elevated TSPO expression. [11C]DPA-713 uptake in the brain was assessed in ipsilateral (infarcted) and contralateral hemispheres. TSPO-PET was combined with structural MRI, allowing for precise delineation of infarct and contralateral regions of interest (ROIs). Here we describe both an atlas-based and an MRI-driven ROI approach to calculate [11C]DPA-713 uptake. Radiotracer uptake in spleen was also assessed to investigate peripheral levels of inflammation between groups. This method has the potential to provide critical insights into the spatiotemporal dynamics and role of specific neuroimmune interactions in stroke and other neurological diseases.
Protocol
All animal studies were carried out in accordance with the Administrative Panel on Laboratory Animal Care (APLAC) at Stanford University, a program accredited by the Association for the Assessment and Accreditation of Laboratory Animal Care. Before this procedure, three-month-old C57BL/6 female mice underwent dMCAO surgery following standard procedure and sterile conditions14.
1. Structural MRI (2 Days Post-dMCAO Surgery)
- Open the operating software (see Table of Materials) and set-up the acquisition by creating a new exam. Select the localizer and turborare T2 sequences in the palette explorer and drag into the exam window.
- Secure the respiratory and heat probes to the mouse bed using soft tape, and place a strip of protective absorbent padding over both to create a sterile environment.
- Attach an air heater to the animal bed and turn on the fan so that the warm air is on and keeping the mouse heated. Use an automated monitoring system to ensure body temperature and respiration rate are maintained at appropriate levels for the duration of the scan.
- Anesthetize the mouse in an induction chamber using 3% Isoflurane initially, then maintain at 1-2% (2 L/min, 100% O2). Ensure a heat pad is turned on under the induction chamber to keep the mouse warm during induction. Once anesthetized, apply eye lubricant to the mouse to avoid drying and the formation of corneal ulcers.
- Turn on the anesthesia system (Isoflurane 1-2%, 2 L/min 100% O2) connected to the MRI scanner and transfer the animal to the mouse bed.
- Position the mouse head-prone onto the bite bar and fix the ear bars in place, making sure they do not protrude outside of the diameter of the bed.
- Slide the RF coil over the mouse head and push the coil and bed into the bore, placing it specifically for isocenter.
- Acquire the localizer to view the mouse position in all 3 dimensions and use this image to define the volume for T2 turborare (TE: 33 ms, TR: 2,500 ms, 2 averages, 17 slices, 0.083 x 0.92 mm resolution, 2 min 40 sec total time) acquisition. dMCAO surgery results in an infarct in the somatosensory cortex14; therefore, ensure this region is covered in the T2-weighted image.
- Remove the mice from the scanner and recover the mice in a heated chamber.
2. PET/CT Calibrations and Workflow Setup (6 Days Post-dMCAO Surgery)
- Create an imaging workflow in the scanner-operating software to include a CT attenuation acquisition, 60-minute C-11 dynamic PET acquisition (350 - 650 keV level discrimination, 3.438 ns coincidence window), histogram (20 frames: 5 x 15 sec, 4 x 1 min, 11 x 5 min; with dead time correction) and a 3DOSEM-OP reconstruction (2 iterations, 18 subsets) to create 128 x 128 x 159 images with 0.776 x 0.776 x 0.96 mm voxel size.
- Perform x-ray source conditioning via the CT calibration panel located at the top left corner of the interface. This calibration must be carried out weekly or before the scan if the system has not been used in the past 48 h.
- Perform dark/light (D/L) and center offset (C/O) calibrations.
- Press the CT calibration button (X) in the top left of the interface.
- Select D/L and C/O for the CT file that you will be running, remove the bed from the gantry and run the D/L calibration.
- Insert the calibration tool bed into the scanner and run the C/O calibration, making sure to switch the selection on the interface to "calibration tool" instead of "70 mm palette".
- Remove the calibration tool and return the standard PET bed, making sure to change the selection on the interface back to "70 mm palette".
- Secure a 4-mouse imaging bed onto the scanner platform using tape and attach the anesthesia tubing (Figure 1A). Ensure that isoflurane is flowing through the tubes and that there are no kinks.
- Push the bed forward so it is in the center of the field of view (FOV), close the CT door and obtain a scout view of the CT to ensure the bed is in the correct position.
- Perform a "standard" calibration of the PET/CT scanner using an in-house manufactured phantom containing a known dose of C-11 solution as a radiation source.
- Prepare a 20 mL syringe filled with the tracer dose equivalent to that administered to one mouse (~250 - 350 µCi/9 - 13 MBq of C-11 tracer diluted in saline).
- Record the activity in the standard using a dose calibrator and note the time of measurement.
- Conduct a PET/CT scan of the standard using the exact same parameters that will be used to image mice (as described above). Do this weekly to create a correction factor for the PET scanner to apply to the imaging data.
3. Workspace Setup for PET/CT Imaging
- Create a sterile environment by using a disinfectant with virucide (see Table of Materials) and placing protective absorbent padding on all surfaces.
- Ensure isoflurane and oxygen tanks are adequately filled.
- Prepare tail vein catheters by filling a 1 mL syringe (fitted with a 27.5 G needle tip) with 0.9% sodium chloride (sterile saline) and flushing through a 27.5 G, 24 cm butterfly catheter. Cut off the wings of the catheter before cannulating to ensure they do not block the view of the tail vein and to help with ease of moving the mice into the scanner without displacing the catheter.
- Ensure all essential equipment is laid out at the workstation including spare "flush" syringes (filled with sterile saline), eye lubricant, ethanol swabs, heat lamps, prepared catheters (pre-filled with saline), surgical tape, tissue glue, 0.5 mL dose syringes, scissors, and a lighter to seal catheter after successful placement in tail vein (Figure 1B).
4. Animal Preparation and Cannulation
- Weigh mice to determine the maximum volume allowed to be injected into each mouse (i.e., volume of tracer and any saline administered must not exceed 10% of body weight).
- Anesthetize mice in an induction chamber using 3% Isoflurane and maintain at 1-2% (2 L/min 100% O2).
- Apply eye lubricant to each mouse and confirm anesthetization via pedal reflex (toe pinch). Adjust anesthesia levels if necessary.
- Place the mouse onto a heated bed fitted with a nose cone to deliver isoflurane at 1-2% (2 L/min 100% O2).
- While the mouse is anesthetized, perform tail vein cannulation using the following protocol:
- Place mouse on its side to expose one of the lateral veins, while head remains in the nose cone.
- Warm the tail using a heat lamp, being careful not to overheat or burn the tail, and swab with an alcohol wipe to dilate the vein and sterilize the injection site.
- Hold the needle with the bevel up and align it with the vein at an acute angle.
- Lightly apply pressure to puncture the skin and level out the needle so it is in line with the vein.
- Gently push forward a few millimeters past the bevel so the needle enters the vein.
- Confirm the catheter is in by administering a small (10-20 µL) flush of saline. The saline should leave the syringe smoothly and the vein should clear. If any resistance or back pressure is observed, it is likely the catheter is not in the vein and re-attempting cannulation is advisable. If clotting is observed, use heparin (1,000 units heparin per mL saline) for cannulation setup and flushing.
NOTE: We have assessed cannulation with and without heparin in the mouse strain of interest, and since no clotting was observed, saline alone was used for cannulations. - Secure the catheter to the tail using a small drop of tissue glue, followed by surgical tape, to ensure that the catheter remains immobile when transferring the mice to the scanner.
- Remove the flush syringe from the end of catheter and seal the end with lighter, ensuring the researcher is not near any isoflurane or ethanol.
- Repeat for 3 additional mice so that all 4 mice to be scanned are cannulated and prepared.
- Turn on the anesthesia flow (2.5% Isoflurane, 2 L/minute 100% O2) connected to the PET/CT and carefully position the mice prone in the scanner bed, ensuring catheters remain in place and each mouse’s head is straight and secure within the nose cone. Tape the head and the body of each mouse to the bed with soft surgical tape, ensuring breathing is not restricted by the placement of the tape. Record the position of each mouse to allow for correct location and group allocation for image analysis.
- Keep mice heated throughout the procedure (e.g., using a heat lamp or hot air pump system to ensure mice are kept warm without overheating). Monitor respiratory rate of all mice, either visually if using an open gantry or through a remote monitoring system using respiratory pads, and alter the anesthesia levels as necessary.
5. CT Acquisition
- Once animals are secure in the bed and respiration is stable, turn on the laser cross hairs and move the scanning bed so that they align with the brain of all four mice. Move the scanner bed in to the acquisition position (position 3) with the brains of the mice as close to the center of the FOV as possible.
- Acquire a scout view image of the mice to verify their position (use a 200 mm FOV), and adjust the position by dragging the FOV box on the interface if necessary. Click "Start Workflow" in the scanner software to begin the CT scan, making sure to select "display interactive user prompts" so the PET scan can be manually started prior to tracer injection.
6. [11C]DPA-713 Dose Preparation
- Synthesize [11C]DPA-713 as previously described12, ensuring you are wearing appropriate PPE (personal protective equipment) for handling radioactivity, including a lab coat, gloves, and personal finger and body dosimeters. Ensure you change gloves regularly to prevent radioactive contamination, and increase your distance from the radioactive source when possible.
- Use forceps to carefully transfer the radiotracer vial behind a lead shield.
- Prepare 0.5 mL dose syringes for each mouse containing approximately 250-350 µCi/9-13 MBq in 100-200 µL volume to ensure a dose adequate for a 60-minute dynamic PET scan (dose administered should be determined considering the half-life of the isotope and time-line of the study design, with the volume depending on the mouse weight).
- Measure the activity using a dose calibrator set to C-11, located in close proximity to the cannulation site, and record the times of measurement and injection to enable decay correction. Draw up the doses just before the CT ends to limit decay and ensure the desired level of radioactivity will be injected in each mouse.
- Verify that there are no air bubbles in the dose syringe before measuring the activity and injecting into each mouse.
7. PET Acquisition
- Once the mice automatically advance from CT to PET, set up the back of the scanner for [11C]DPA-713 injection (Figure 1C). Place protective absorbent padding on a ledge and make sure scissors and lighter are on hand.
- Snip the sealed catheter tubing with scissors, check catheter lines are clear of any bubbles, and confirm the cannula is still within the vein by performing a 10-20 µL saline flush. Load the measured dose syringes from step 6.4 into each of the 4 catheters, keeping track of which dose was given to each mouse.
- Click "OK" when the PET scan is ready to start while simultaneously starting a 10 second timer. Have two researchers at the back of the scanner with the dose syringes in hand, to inject all 4 mice simultaneously upon the timer reaching zero. Flush each catheter with 50-100 µL of saline (depending on the length of catheter tubing — i.e., the dead volume) to make sure the full dose enters the tail vein, and re-seal the tubing once again using a lighter.
- Measure the dose syringes using a dose calibrator to obtain a residual radioactivity value (any tracer left in the syringe). Take note of the values and the time they are recorded.
- Once the scan is complete, home the PET bed to the original position using the horizontal "home" button within the motion control panel. Remove the mice from the scanner and carefully remove the catheter. Gently apply pressure to the cannulation site to prevent excessive bleeding.
- Measure the residual activity in the catheter using a dose calibrator as previously described.
- If mice are to be recovered ensure this is done in a warm environment (e.g., in a box with a heated pad underneath or containing a glove filled with warm water) to ease recovery. If planning to euthanize the mice, place the mice into an induction chamber containing isoflurane so that they remain anaesthetized prior to euthanasia via perfusion.
- To reconstruct the data, open the post-processing managing software (see Table of Materials), which will automatically reconstruct each scan using the histogram data that was generated from the lst file.
8. Brain Autoradiography
- Prior to the experiment, erase the digital autoradiography film by exposing it to white light for 10-15 min and keep in a radioactivity-free area until use.
- Prepare 0.5 mL dose syringes for each mouse containing approximately 1.0-1.5 mCi/37-56 MBq to ensure a dose adequate for autoradiography.
- Measure the radioactivity in the dose syringe, using a dose calibrator, prior to injection to obtain an accurate reading of the activity.
- Cannulate as previously described and inject mice immediately in an area suitable for radioactivity.
- Remove the catheter after injection and measure the residual radioactivity.
- Leave the mice in a heated induction chamber so that they remain anaesthetized prior to perfusion and euthanasia.
- Perform euthanasia while mice are deeply anaesthetized (continual inhalation of 4% Isoflurane, 2 L/min 100% O2) via PBS perfusion and bilateral thoracotomy 30 min post-[11C]DPA-713 injection.
- Open the abdominal cavity and cut through the diaphragm to expose the heart.
- Insert a butterfly catheter infusion needle into the left ventricle of the heart, and snip the right atrium and inferior vena cava.
- Slowly perfuse with PBS (~20-30 mL) using a 20 mL syringe.
- Carefully remove the brain from the skull using forceps and scissors.
- Place the brain in a freezing mold filled with optimal cutting temperature (OCT) liquid, making sure the brain is level and centered within the mold, with the olfactory bulbs oriented towards the notches in the mold (to provide landmarks and orientation once the brain is removed from the mold).
- Place mold on dry ice for 10 -15 min or until the OCT becomes opaque.
- Immediately place each mold in the cryostat microtome set to -18 °C, and equilibrate for 10 min prior to mounting.
- Peel away the freezing mold and mount the brain to the microtome platform using a small amount of fresh OCT as the "glue".
- Leave mounted brain in the microtome to freeze for 2 min.
- Slice through the brain until the stroke location is exposed (i.e., ROI). Use the MR image to locate the infarct within the brain of each animal. For dMCAO, this should consistently be in the somatosensory cortex; however, the length of the stroke may vary slightly.
- Section the region of the brain spanning the infarct, placing 20 µm-thick sections on glass microscope slides labeled with the appropriate mouse number.
- Open the autoradiography cassette and line the bottom of the cassette with one sheet of Saran wrap. Arrange the slides section side up on top of the saran wrap in the cassette and take note of the position of each slide. Optionally, take a picture of the slide placement to assist with later analysis.
- Gently place another layer of saran wrap on top (after waiting ~2 min following collection of last brain section - allowing it to dry and adhere to the slide) and carefully place the digital autoradiography film (white side facing down) on top of the slides.
- Close the cassette tightly and leave in a -20 °C freezer, allowing the sections to decay on the film for an adequate exposure time (~5-10 half-lives).
- Scan the film after the exposure time using a phosphor imager to generate a digital image for subsequent analysis.
9. Dynamic PET Image Analysis
- Open image analysis software (see Table of Materials) and click on the "open data" icon to load the CT image (as the source) and the "append data" icon to load the dynamic PET (as the reference).
- Perform a visual quality control of the data via the time-series operator in the drop-down menu: Select reference ("ref") and "global" and apply an appropriate min and max for the color scale. Visualize the dynamic PET data frame by frame, verifying radioactivity uptake and checking for any motion confounds within the scan.
- Create an average PET image using the "arithmetic operator".
- Choose "average selected", unselect "ref", and ensure input 1 ("Inp1"), input 2 ("Inp2") and input star ("Inp*"-includes the rest of the PET frames in the scan) are selected to create an average of all the PET frames.
- Go to the "data manager" tab (DM) and drag the average image up to the "input1" position for visualization purposes. Redistribute the color scale by clicking on the automatic calculation in the "min-max" tool.
- Register the CT to the average PET file using the "automatic 3D" function in the "re-orientation/registration" drop-down menu.
- Select "ref" and "Inp1", and choose "rigid", "fast", "Inp1 to Ref" registration. Visually check the registration in all 3 dimensions and manually adjust if necessary in the "manual 3D" tab using the "translation" and "rotation" functions.
- When satisfied with the registration, select "Inp2" and "Inp*", and apply to all PET frames by clicking the checkmark. Right click on the CT and PET files in the DM and save as raw.
- Crop the brain of one mouse at a time for brain analysis using the CT as a guide: Select "cropping" from the drop-down menu and drag the image boundaries to crop the head of the mouse below the brainstem. Re-orientate the PET and CT images using the "manual 3D reorientation" function as described above so that the skull is straight in all dimensions.
- Load in the MR image for that mouse (in DICOM format) using the "append data" button on the top left of the interface. Move the MR using the "manual 3D reorientation" and fit to the skull within the CT image (make sure all modalities are in the same orientation).
- Draw the stroke ROI on the MR image using the "3D ROI tool".
- Turn off the PET visualization by deselecting it within the visual controller tab (VC) and use only the MR and the CT to draw the ROI.
- Click on the "add ROI" button to create a new ROI and name it "infarct". Select the "spline tool", left clicking to draw the ROI border and right click to close it.
- Repeat through all slices encompassing the stroke, making sure not to capture any of the skull in the ROI, with best practice being to leave a voxel gap between the skull border and stroke ROI.
- Generate a contralateral ROI using the infarct volume.
- Create a new ROI and label it "contralateral". Right click on the Infarct ROI and select "export". Drag the ROI to position 2 ("Inp1").
- With only "Inp1" selected, apply a left right flip using the "operator" function within the "reorientation/registration" menu. Tick the "ROI" box, choose "view only", and manually move the new ROI to the identical region on the contralateral side. Select the "arithmetic's" operator and apply a scalar multiplication of 2 to the new ROI, permitting independent quantification of ROIs.
- Return to the 3D ROI tool. Go to the "expert and experimental" tab and click on the "import ROI" button. Select Inp1 from the dialog box to load the new volume as the contralateral ROI.
- Right click on the average PET image and unload it and turn the PET back on. Generate the quantitative uptake results using the "export results" icon within the 3D ROI tool.
- Perform additional split brain analysis if desired (i.e., automated ROI generation of right versus left brain hemisphere regions using a 3D mouse brain atlas plugin module for Vivoquant software).
- Re-load the registered PET/CT images.
- Import the mouse brain atlas by clicking on the "advanced modules" menu and selecting the 3D brain atlas tool. Select "all regions left/right" in the "advanced settings" and click "run" to import the 3D atlas.
- Manually fit the atlas within the brain using the skull as a border.
- Re-run the atlas making sure that "import 3D ROI" is checked to generate a spreadsheet of results for all 14 left and right hemisphere ROIs (medulla, cerebellum, midbrain, pons, cortex, hippocampus, thalamus, hypothalamus, striatum, pallidum, olfactory bulbs, corpus callosum and white matter).
- Quantify tracer uptake in the spleen using the scanner operating software (see Table of Materials).
- Load PET and CT image files by highlighting them in the database and clicking on "general analysis".
- Click on the registration tab and co-register PET and CT images clicking on the "rigid registration" icon.
- Click on the ROI quantification tab, click on the "create ROI" icon and name it spleen.
- Choose the "sphere" tool to draw spleen ROIs using the CT file for reference, ensuring there is no overlap with kidney uptake (using the PET image and signal to avoid spillover from kidneys).
- Edit the ROIs to maintain consistent ROI volumes between animals.
- Calculate a standard correction value for uptake normalization.
- Load the PET/CT data from the standard scan and create a cylinder ROI encompassing the 20 mL syringe using the "manual 3D ROI" tool.
- Obtain the level of radioactivity contained within the standard using the spreadsheet icon.
- Use this nCi/cc result and the original recorded radioactivity for the standard (i.e., the dose calibrator measurement of the standard in nCi/cc) to create a correction factor for PET uptake values. That is, divide the radioactivity of the standard recorded by the dose calibrator by the radioactivity calculated from the PET image of the standard.
- Use the dose activities and time of measurements to decay correct to the time of PET acquisition for all mice (i.e calculate the dose activity at the start of the PET scan).
- Repeat for the residual values and subtract from the decay corrected dose to calculate the exact activity each animal received.
- After applying this decay correction, also apply the standard correction to make sure the data are at the right activity level. Ensure these corrections are applied to the manually drawn ROI results, and brain atlas ROI data relevant brain regions for dMCAO location (i.e., cortex, hippocampus and striatum).
- Calculate the %ID/g for all ROIs using the following equation: %ID/g = (ROI radioactivity in nCi/cc / decay corrected dose received in nCi/cc) x 100. Plot %ID/g as a function of time using graphing software to generate time activity curves for each ROI.
- Use scanner software for final image visualization and figure generation. Normalize images according to the decay corrected dose received by each mouse at the time of scanning, ensuring all images are on the same %ID/g scale.
NOTE:This is necessary to enable accurate comparison of images from different mice and/or images from studies performed on different days
10. Autoradiography Image Analysis
- Open the digital image (.gel file) in ImageJ software. Adjust the brightness and contrast to visually threshold the image and apply an appropriate color "lookup table".
NOTE: Royal most accurately resembles the color scale used in PET. - Use the ROI manager to manually draw ROIs around infarct and corresponding contralateral regions.
- Use the measure function to quantify the mean pixel intensity of each ROI and export results. Plot using statistical software.
Results
Mice underwent MRI to verify successful stroke, and [11C]DPA-713 PET was carried out by scanning 4 mice simultaneously. PET, CT, and MR images were co-registered prior to manually drawing brain ROIs and performing the semi-automated split brain atlas analysis, to investigate tracer uptake in ipsilateral and contralateral regions (Figure 2).
PET/CT images and time activity curves (TACs-radiotracer activity as a function of time) display increased [11C]DPA-713 uptake in the ipsilateral versus contralateral hemispheres (Figure 3A). Quantification of dynamic PET brain images, using summed data from 50-60 min, revealed a significant increase in tracer uptake (% ID/g) in the ipsilateral (infarcted) compared to the contralateral hemisphere in dMCAO, but not in sham mice using the manually drawn ROI approach (Figure 3B). Increased uptake was also observed in the ipsilateral hemisphere between dMCAO and sham mice. No significant differences between ipsilateral and contralateral hemispheres were observed using the atlas approach, likely due to the atlas ROIs being larger than the size of the infarct (usually restricted to the somatosensory cortex), therefore diluting the signal. However, overall increased uptake in dMCAO compared to sham was observed for all ROIs, which aligns with previous reports using MCAO model mice, demonstrating increased TSPO expression in regions outside of the infarct19. Ipsilateral/contralateral ratios were increased in the dMCAO versus sham mice using both approaches; however, this difference was only significant in the cortex using the brain atlas approach due to larger variance in the ROI approach. This may be overcome by increasing the number of mice in each group. Quantification of [11C]DPA-713 uptake in spleen showed no significant differences between groups (Figure 4).
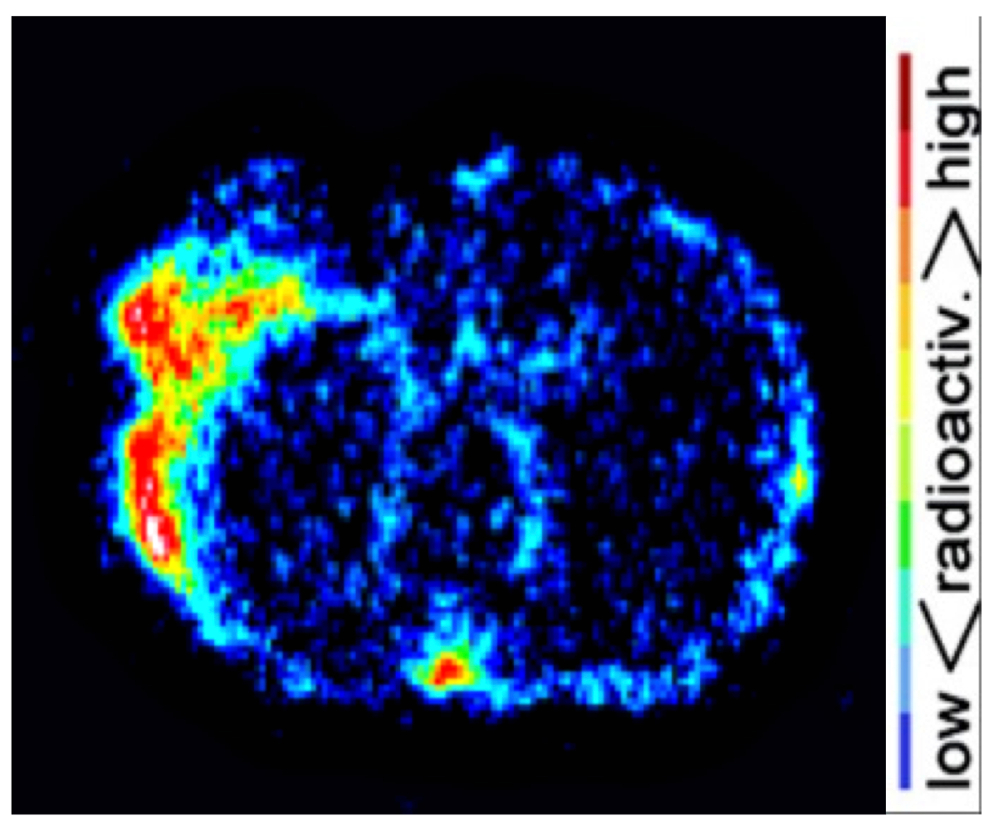
Brain dMCAO mouse PET imaging results were confirmed by ex vivo high resolution digital autoradiography (Figure 5). Increased [11C]DPA-713 uptake was observed in infarcted tissue with negligible signal in surrounding healthy brain tissue. Quantitation of these images revealed ipsilateral to contralateral ratios ranging from 1.4 to 2.09 in dMCAO mice.

Figure 1: PET Scanner and Workspace Set-up. All workspaces were covered in protective absorbent padding to create a sterile environment. (A) After calibrations, a 3D-printed mouse bed, equipped for imaging 4 mice simultaneously was secured in the scanner and nose cones for all 4 mice attached to the anesthesia. (B) Necessary equipment for PET imaging were prepared in advance, including saline-filled 27.5 G catheters, eye lubricant, ethanol swabs, heat lamps, surgical tape, tissue glue, 0.5 mL dose syringes, scissors and a lighter. (C) For radiotracer injection, place saline-flush syringes and scissors at the back of the scanner. Please click here to view a larger version of this figure.

Figure 2: Ipsilateral/Contralateral ROI and Right/Left-Split Hemisphere Brain Atlas PET Image Analysis Process. Image analysis software was used to determine the tracer uptake in ipsilateral and contralateral regions of interest (ROIs) using manually drawn ROIs and a semi-automated 3D split-brain atlas approach. Automatic 3D PET/CT registration was carried out followed by manual registration of the brain MRI within the corresponding mouse skull defined in the CT image. The 3D ROI tool was used to manually draw ipsilateral (red) and contralateral (green) ROIs using the infarct on the MRI as a reference. For the split-brain approach, the 3D left/right-split mouse brain atlas was loaded and fitted within the skull as defined by the CT image. Brain ROIs used for quantification in this 3D mouse brain atlas included Left Cortex (Dark Grey), Left Hippocampus (Cornflower Blue), Left Striatum (Deep Pink), Right Cortex (Tomato red), Right Hippocampus (Green), and Right Striatium (Cyan). The uptake of [11C]DPA-713 in each region was obtained in nCi/cc and was subsequently converted to %ID/g by normalizing to the decay-corrected dose at time of scanning for each mouse. Please click here to view a larger version of this figure.

Figure 3: Representative In Vivo [11C]DPA-713 Brain Uptake in DMCAO and Sham Mice. (A) Dynamic PET/CT images and TACs demonstrate increased [11C]DPA-713 uptake in the ipsilateral cortex of mice that underwent DMCAO (n = 3) and a slight increase for sham (n = 3) operated mice, with DMCAO mice demonstrating significantly greater contrast in percentage injected dose between the infarct and contralateral side of the brain (%ID/g). (B) PET quantification (50-60 min summed) revealed significantly increased uptake in the ipsilateral ROI using the ROI approach and in the cortex (Ctx) using the split-brain atlas approach. No significant differences were found in the hippocampus (HC) or striatum (Str). Increased ipsilateral to contralateral ratios were seen using both analysis approaches but was only statistically significant in the Ctx using the brain atlas approach. * (p <0.05), *** (p <0.001) Please click here to view a larger version of this figure.

Figure 4: Representative In Vivo [11C]DPA-713 Spleen Uptake in dMCAO and Sham Mice. (A) [11C]DPA-713 dynamic PET/CT images showing spleen ROIs in dMCAO (n = 3) and sham (n = 3) mice. (B) Quantitative results demonstrate no significant results in spleen uptake between dMCAO and sham mice. Please click here to view a larger version of this figure.

Figure 5: Representative Autoradiography Results. Digital autoradiography images demonstrate increased [11C]DPA-713 uptake in the ipsilateral compared to contralateral hemisphere. Please click here to view a larger version of this figure.
Discussion
The presented protocol describes a method for the quantification of neuroinflammation in dMCAO and sham mice using [11C]DPA-713-PET. TSPO-PET is the most widely investigated imaging biomarker for visualizing and measuring neuroinflammation in vivo to date. TSPO expression is upregulated on glia in the brain during inflammation permitting the non-invasive detection and quantification of neuroinflammation. Moreover, it is a highly translatable technique, making it a valuable tool in both clinical and pre-clinical research. This protocol and representative results highlight the suitability of using [11C]DPA-713 PET to detect and monitor neuroinflammatory alterations in stroke and other neurological disorders in vivo.
In this study, dMCAO surgery was carried out using 3-month-old C57BL/6 female mice. This model was chosen as it gives rise to a highly reproducible infarct restricted to the somatosensory cortex, providing a model of permanent focal ischemia with low variability compared to other models of stroke (e.g., middle cerebral arterial occlusion (MCAO) filament method)14. PET imaging of stroke models has the advantage of containing an internal reference region in the brain for each animal using ROIs within the contralateral hemisphere. Since there will be some inflammation that results from the surgery alone, it is important to include mice that underwent sham surgery in the study design, whereby craniotomy and manipulation of meninges without artery occlusion was performed. Craniotomy alone can result in disruption to the underlying neuronal tissue and introduction of pathogens leading to immune responses independent of stroke20. Some inflammation after sham surgery is therefore expected and should be assessed in parallel to dMCAO to exclude the possibility of signal due to surgery alone. To avoid including inflammation resulting from the surgery without stroke in dMCAO cohort analysis, MR imaging must be conducted to confirm successful stroke surgery and infarct development. MRI also provides a structural reference frame, which is essential to accurately draw the infarct and contralateral ROIs. Additionally, accurate image processing including image registration and ROI definition are necessary to ensure reliable quantification.
Additional limitations must be kept in mind when working with C-11 labeled radiotracers for PET and autoradiography studies. It is imperative to consider the short half-life (20.33 min) of C-11, with its use generally restricted to research institutes with on-site cyclotron access. Appropriate radioactivity transportation route, dose administration, and acquisition time-points must be determined in advance with a pre-prepared detailed plan of the workflow of the experiment so that the team can work quickly and efficiently. The design and set-up of this study has been outlined to accommodate imaging of 4 mice simultaneously to increase the data output obtainable when using a C-11 tracer. If possible, it is advisable to have all mice cannulated and in the middle of their CT scan by the time the C-11 tracer arrives at the imaging facility to ensure minimal radiotracer decay prior to injection. This step-by-step protocol is also best carried out by a team containing at least 3 researchers to allow for quick cannulation, dose measurement, tracer injection, PET scanning and brain sectioning prior to significant radioactive decay. It requires two people to conduct the initiation of the PET scan and injection of all 4 mice simultaneously. The reason for beginning the PET acquisition just prior to injection is to ensure the pharmacokinetics and dynamics of tracer distribution in blood and regions of interest are accurately and completely captured. Many steps may require vigorous training and practice to ensure smooth running of the experiment. In particular, this protocol is dependent on successful tail vein cannulation of C57BL/6 mice, which can be difficult due to dark hair present on their tails, and may become more challenging after stroke has occurred or if imaging the same mice at multiple time-points.
Another consideration for PET imaging includes careful recording of radiotracer dose and residual activity measurements, including the exact time of measurement. This is essential for accurate decay correction of the injected dose at the time of the scan and is used to obtain an accurate measurement of tracer uptake (i.e., % ID/g) for each ROI. It is imperative to know the exact amount of radioactivity that was present in each mouse at the time of scanning to ensure accurate image analysis. Therefore, it is advisable to synchronize the clocks on the scanner computer and dose calibrator to avoid error when using short-lived isotopes such as C-11.
Accurate PET image quantification can also be limited by the accuracy of the scanner and set-up. Hence to ensure accurate quantification of PET/CT images, it is important to carry out quality control checks for both the CT and PET components of the scanner. CT quality control checks include X-ray source conditioning, dark/light, and center off set calibrations. These calibrations measure and correct for system noise and must be performed prior to acquisition as recommended by the scanner manufacturer. Calibrations should also be performed for the PET scanner. This typically involves scanning a "standard/ PET phantom" scan, containing a known concentration of radioactivity. When preparing the standard, it is best to use the same radioisotope used in the study, a comparable dose to that administered to a single mouse in a volume similar to the body of a mouse, and the same acquisition parameters as animal imaging. A 20 mL syringe filled with radiotracer diluted in water is used for the standard in this protocol, with the subsequent PET imaging results used to calculate a correction factor based on the actual dose measured by the calibration detector. The correction ratio can be applied to the imaging data acquired in the experiment to ensure accurate quantification of tracer uptake in regions of interest in PET images. This accounts for the positron range of the radionuclide in addition to considering any background activity present on the day of scanning. As the dose calibrator is an integral part of the generation of this correction factor, it is imperative that this equipment is also calibrated regularly according to the manufacturer guidelines.
When conducting ex vivo autoradiography it is important to pick an optimal time-point for euthanasia after injection, to ensure high signal-to-background in region(s) of interest. Thirty minutes post-injection was chosen for [11C]DPA-713 autoradiography using data acquired during dynamic PET imaging -i.e., the in vivo dynamic TACs as a guide, while also considering the short half-life of C-11 and the time involved to section and expose the brain tissue after extraction. Considering this, [11C]DPA-713 autoradiography must be performed on a separate cohort of mice to allow for injection of a higher [11C]DPA-713 dose and a 30 minute time-point for perfusion and euthanasia under anesthesia. Performing a small in vivo PET pilot study with a 3-4 mice prior to conducting ex vivo autoradiography will be helpful for determining the optimal time point for autoradiography. An additional consideration for ex vivo autoradiography is whether to recover the mice after injection or keep them anesthetized until euthanasia. Keeping them anesthetized mimics the conditions of the scan and ensures the radiotracer distribution or excretion kinetics are not altered by recovery. Furthermore, this prevents additional stress on the mice by avoiding recovery and subsequent induction. Finally, a useful addition to the ex vivo protocol would be to assess the regional damage in the brain slices used for autoradiography via immunohistochemical staining (after radioactive decay) to generate a high-resolution image of infarct location and volume.
As there are limitations with the use of a C-11 based tracer, this protocol can easily be modified for use with a F-18 (half-life of 109.77 min) based TSPO tracer, which may be more applicable to locations without an on-site cyclotron. Additionally, this protocol describes the use of a 4-mouse imaging set-up. Although this high throughput method is optimal when using a C-11 tracer, this protocol may also be modified for those using single mouse imaging beds. Careful planning and consistent training in the techniques outlined in this protocol will lead to the generation of a wealth of data using [11C]DPA-713, which can easily be applied to probe the role of neuroinflammation in disease manifestation and progression in other rodent models of neurological disorders. Moreover, this technique could be used to assess the in vivo response to immunomodulatory therapeutics targeted at microglia/macrophages.
Disclosures
The authors declare no conflicts of interests.
Acknowledgements
The authors would like to thank the Buckwalter lab (especially Dr. Todd Peterson) for providing the mouse model and performing the dMCAO and sham surgeries. Additionally, we would like to thank Thomas Liguori from Invicro for his technical assistance with VivoQuant image analysis software, Dr. Tim Doyle, Dr. Laura Pisani, Dr. Frezghi Habte from the SCi3 small animal imaging facility at Stanford for their advice and assistance in developing this imaging protocol, and the Radiochemistry facility (especially Dr. Jun Park) for their help with the synthesis of [11C]DPA-713.
Materials
| Name | Company | Catalog Number | Comments |
| Inveon PET/CT scanner | Siemens | Version 4.2 | |
| MRI scanner | Varian | 7 Telsa | |
| ParaVision software | Bruker | Version 6.0.1 | MRI operating software |
| VivoQuant software | InVicro | Version 2.5 | Image analysis software |
| Inveon Research Workspace software | Siemens | Version 4.2 | Scanner operating software. Includes microQView, the post-processing managing software |
| Dose calibrator | Capintech | CRC-15 PET | |
| Typhoon phosphor imager 9410 | GE Healthcare | 8149-30-9410 | |
| Butterfly catheters | SAI Infusion Technologies | BFL-24 | 27.5 G needle |
| 1 mL syringes | BD | ||
| Insulin syringes | BD | 329461 | 0.5 mL insulin syringes with needle |
| 20 mL syringe | VWR | BD302831 | BD Syringe Slip Tip Graduated |
| Tissue glue | Santa Cruz Animal Health | sc-361931 | 3 mL |
| Heat lamp | Fluker | 27002 | 5.5" reptile heat lamp with clamp and switch |
| 0.9% sterile saline | Pfizer | 00409-4888-10 | 0.9% sodium chloride for injection, 10 mL |
| Eye lubricant | Watson Rugby | PV926977 | Artificial Tears Lubricant Eye Ointment, 1/8 oz |
| Chux absorbent sheets | ThermoFisher Scientific | 1420662 | Disposable absorbent padding |
| Iris scissors | World Precision Instruments | 503708-12 | 11.5 cm, Straight, 12-pack |
| Surgical tape | 3M Durapore | 1538-0 | 1/2" x 10 yard roll, silk, hypoallergenic |
| Mouse PET bed | In house | 4 mouse PET bed | |
| Lighter | Bic | UDP2WMDC | |
| Isoflurane | Henry Schein | NDC 11695-6776-2 | Isothesia, inhalation anesthetic, 250 mL |
| Oxygen | Praxiar | UN1072 | Compressed gas |
| Autoradiography cassette | Cole Palmer | EW-21700-34 | Aluminum, 8" x 10" |
| Autoradiography film | GE Life Sciences | 28-9564-78 | Storage Phosphor Screen BAS-IP SR 2025 E Super Resolution, 20 × 25 cm, screen only |
| Microtome blades | ThermoFisher Scientific | 30-508-35 | MB35 Premier Disposable, 34° cutting angle |
| Microtome | Microm | HM 550 | |
| Microscope slides | Fisher Scientific | 12-550-15 | Superfrost™ Plus Microscope Slides |
| OCT liquid | VWR | 25608-930 | Formulation of water-soluble glycols and resins for cryostat sectioning at temperatures of -10°C (14°F) and below |
| Freezing molds | Poly sciences | 18646A-1 | Disposable paraffin molds |
| Saran wrap | Saran | 25700001300 | |
| Disinfectant | Virkon S |
References
- Benjamin, E. J., et al. Heart disease and stroke statistics-2017 update: A report from the american heart association. Circulation. 135 (10), 146-603 (2017).
- Jin, R., Yang, G., Li, G. Inflammatory mechanisms in ischemic stroke: role of inflammatory cells. J Leukoc Biol. 87 (5), 779-789 (2010).
- Wang, Q., Tang, X. N., Yenari, M. A. The inflammatory response in stroke. J Neuroimmunol. 184 (1-2), 53-68 (2007).
- Brown, R. C., Papadopoulos, V. Role of the peripheral-type benzodiazepine receptor in adrenal and brain steroidogenesis. Int Rev Neurobiol. 46, 117-143 (2001).
- Papadopoulos, V., Lecanu, L., Brown, R. C., Han, Z., Yao, Z. X. Peripheral-type benzodiazepine receptor in neurosteroid biosynthesis, neuropathology and neurological disorders. Neuroscience. 138 (3), 749-756 (2006).
- Scarf, A. M., Kassiou, M. The translocator protein. J Nucl Med. 52 (5), 677-680 (2011).
- Cerami, C., Perani, D. Imaging neuroinflammation in ischemic stroke and in the atherosclerotic vascular disease. Curr Vasc Pharmacol. 13 (2), 218-222 (2015).
- Stefaniak, J., O'Brien, J. Imaging of neuroinflammation in dementia: a review. J Neurol Neurosurg Psychiatry. 87 (1), 21-28 (2016).
- Gerhard, A. TSPO imaging in parkinsonian disorders. Clin Transl Imaging. 4, 183-190 (2016).
- Airas, L., Rissanen, E., Rinne, J. O. Imaging neuroinflammation in multiple sclerosis using TSPO-PET. Clin Transl Imaging. 3, 461-473 (2015).
- Fan, J., Lindemann, P., Feuilloley, M. G., Papadopoulos, V. Structural and functional evolution of the translocator protein (18 kDa). Curr Mol Med. 12 (4), 369-386 (2012).
- James, M. L., et al. Synthesis and in vivo evaluation of a novel peripheral benzodiazepine receptor PET radioligand. Bioorg Med Chem. 13 (22), 6188-6194 (2005).
- Boutin, H., et al. 11C-DPA-713: A novel peripheral benzodiazepine receptor PET ligand for in vivo imaging of neuroinflammation. J Nucl Med. 48 (4), 573-581 (2007).
- Doyle, K. P., Buckwalter, M. S. A mouse model of permanent focal ischemia: distal middle cerebral artery occlusion. Methods Mol Biol. 1135, 103-110 (2014).
- Wang, Y., et al. [(18)F]DPA-714 PET imaging of AMD3100 treatment in a mouse model of stroke. Mol Pharm. 11 (18), 3463-3470 (2014).
- Domercq, M., et al. PET Imaging with [(18)F]FSPG evidences the role of system xc(-) on brain inflammation following cerebral ischemia in rats. Theranostics. 6 (11), 1753-1767 (2016).
- Toth, M., et al. Acute neuroinflammation in a clinically relevant focal cortical ischemic stroke model in rat: longitudinal positron emission tomography and immunofluorescent tracking. Brain Struct Funct. 221 (3), 1279-1290 (2016).
- Walter, H. L., et al. In vivo analysis of neuroinflammation in the late chronic phase after experimental stroke. Neuroscience. 292, 71-80 (2015).
- Rojas, S., et al. Imaging brain inflammation with [(11)C]PK11195 by PET and induction of the peripheral-type benzodiazepine receptor after transient focal ischemia in rats. J Cereb Blood Flow Metab. 27 (12), 1975-1986 (2007).
- Glazier, S. S., O'Rourke, D. M., Graham, D. I., Welsh, F. A. Induction of ischemic tolerance following brief focal ischemia in rat brain. J Cereb Blood Flow Metab. 14 (4), 545-553 (1994).
Reprints and Permissions
Request permission to reuse the text or figures of this JoVE article
Request PermissionThis article has been published
Video Coming Soon
Copyright © 2025 MyJoVE Corporation. All rights reserved