
A subscription to JoVE is required to view this content. Sign in or start your free trial.
Method Article
Evaluating the Function of the Foot Core System in the Elderly
In This Article
Summary
The functional core stability of the foot contributes to the human static posture and dynamic activities. This paper proposes a comprehensive evaluation for the function of the foot core system, which combines three subsystems. It may provide increased awareness and multifaceted protocol to explore the foot function among different populations.
Abstract
As a complex structure to link the body and the ground, the foot contributes to postural control in human static and dynamic activities. The foot core is rooted in the functional interdependence of the passive, active, and neural subsystems, which combine into the foot core system controlling foot motion and stability. The foot arch (passive subsystem), responsible for load, is considered the functional core of the foot, and its stability is necessary for normal foot functions. The functional abnormalities of the foot have been widely reported in the elderly, such as weakness of toe flexor muscles, abnormal foot postures, and decreased plantar sensory sensitivity. In this paper, a comprehensive approach is introduced for evaluating the foot function based on foot core subsystems. The strength and morphology of the foot intrinsic and extrinsic muscles were used to evaluate the foot muscle (active subsystem) function. The doming strength test was applied to determine the function of foot intrinsic muscles, while the toe flexion strength test focused more on the function of extrinsic muscles. The navicular drop test and foot posture index were applied to evaluate foot arch (passive subsystem) function. For the neural subsystem, the plantar light touch threshold test and two-point discrimination test were used to assess plantar tactile sensitivity at nine regions of the foot. This study provides new insights into the foot core function in the elderly and other populations.
Introduction
The human foot is a highly complex structure, consisting of bones, muscles, and tendons that attach to the foot. As a segment of the lower extremity, the foot constantly provides direct source contact with the supporting surface and hence contributes to weight-bearing tasks1. Based on the complex biomechanical interplay between muscles and passive structures, the foot contributes to shock absorption, adjusts for irregular surfaces, and generates momentum. Evidence shows that the foot contributes meaningfully to postural stability, walking, and running2,3,4.
According to a new paradigm proposed by McKeon5 in 2015, the foot core is rooted in the functional interdependence of the passive, active, and neural subsystems, which combine into the foot core system controlling foot motion and stability. In this paradigm, the foot bony anatomy forms the functional half dome, which includes the longitudinal arches and transverse metatarsal arches and flexibly adapts to load changes6. This half dome and passive structures, including the ligaments and joint capsules, constitute the passive subsystem. Additionally, the active subsystem consists of foot intrinsic muscles, extrinsic muscles, and tendons. The intrinsic muscles act as local stabilizers responsible for supporting the foot arches, load dependence, and modulation7,8, while the extrinsic muscles generate foot motion as global movers. For the neural subsystem, several kinds of sensory receptors (e.g., capsuloligamentous and cutaneous receptors) in the plantar fascia, ligaments, joint capsules, muscles, and tendons contribute to foot dome deformation, gait, and balance9,10.
Several researchers have speculated that the foot contributes to daily activities in two main ways. One is by mechanical support via the functional arch and the modulation among lower limb muscles. The other is the input of plantar sensory information about the position11. Based on the foot core system, deficits in this system, including foot posture, the strength of intrinsic and extrinsic foot muscles, and sensation sensibility, may predispose to the weakness of mobility and balance9,11,12,13.
However, with advancing age, alterations to the aspect, biomechanics, structure, and function of the foot commonly occur, including foot or toe deformities, weakness of foot or toe strength, plantar pressure distribution, and reduced plantar tactile sensitivity14,15,16,17. The presence of toe deformity and the severity of hallux valgus are associated with mobility and fall risk in the elderly11,18. Moreover, the strength of toe flexor muscles, which used to be overlooked, contributes to balance in elderly people19. Meanwhile, the elderly are also at higher risks to have foot conditions associated with pathologies such as diabetes, peripheral arterial disease, neuropathy, and osteoarthritis20,21.
The assessment, examination, and health care of the foot, especially in the elderly, have attracted increasing attention14,21. However, there is a limited study to explore the comprehensive evaluation for the function of the foot core system. Numerous studies aimed to explore foot pathological problems in the elderly, such as pain and nail, skin, bone/joint, and neurovascular disorders21,22,23. The role of the foot in mechanical support and sensory input during daily activities and as a functional core system needs to be recognized and evaluated, which was ignored in previous studies. Especially, the foot active components, including the intrinsic and extrinsic muscles, works as the local stabilizers and global movers and contribute to the foot stability and behavior in static posture and dynamic movement5.
The toe flexion strength is singularly reported to represent foot muscle strength, and it's also utilized to explore the relationship between foot function and other health situations, such as balance, and mobility24,25,26. Inherently, the foot muscle strength is limited to distinguishing the action of intrinsic and extrinsic muscles. Moreover, several tests, including the paper grip test and an intrinsic positive test, were criticized as non-quantitative tests that have poor reliability and validity7,27. Recently, a new evaluation of foot doming strength was reported to quantify the intrinsic foot muscle strength and it has been shown to have a good validity28. By measuring the doming (short-foot movement) strength, it contributes to directly quantifying the function of intrinsic muscle.
Therefore, a protocol is proposed here aiming to explore the characteristics of the foot in the elderly based on the foot core system, especially the function of the active subsystem. This protocol provides a comprehensive assessment to investigate foot core stability, including the passive, active, and neural subsystem, in the elderly. Moreover, alterations in foot core function have been reported in several health situations, such as plantar fasciitis, flat foot, and diabetes24,29,30. In the future studies, it might help to evaluate the foot function among different populations in a multidimensional measurement.
Access restricted. Please log in or start a trial to view this content.
Protocol
This study was conducted at the Sports Medicine and Rehabilitation Centre, Shanghai University of Sport, and has been approved by the ethics committee of the Shanghai University of Sport (No. 102772020RT001). Before the test, the participants were given details about the experimental purpose and procedures; all participants signed the informed consent.
1. Participant selection
- Include participants who (1) are aged over 60 years old; (2) can maintain standing position alone; (3) can walk independently, without help from others, prosthesis, or mobility aids; (4) can display normal cognitive function and can understand the procedures and instructions of the test. Exclude participants who (1) were diagnosed with severe cardiopulmonary disease; (2) diagnosed with motor neuron disorders, such as Alzheimer's disease and Parkinson's disease; and (3) had a history of lower limb trauma in the past year were excluded.
NOTE: To evaluate the function of the foot core system, 42 elderly participants and 42 young participants whose demographic data matched with the old group (control group) were recruited for this study. The sample size was calculated for t-test with setting of α = 0.05, power (1 − β) = 0.95, and effect size = 0.8. The result shows that 42 participants in each group should be included in this study.
2. Active subsystem
NOTE: The morphology and strength tests of intrinsic and extrinsic foot muscles are used to evaluate the active subsystem.
- Muscle morphology
- Turn on the musculoskeletal ultrasound system, and then click on the Freeze button. Plug the probe connector into the connection port on the rear side of the host and lock the Probe Lock button. Click on the iStation button, and then click on New Patient. Input the ID, name, gender, and date of birth of each participant.
NOTE: The probe cable should be arranged properly and placed in a location where it will not be easily trampled to ensure that the cable is not entangled with the other objects. Place the probe in a safe location to avoid collision and damage. - Abductor hallucis (AbH): Apply the ultrasound coupling gel at the middle of the scanning line of tuberosity and navicular tuberosity. Place the probe at the medial calcaneal tuberosity toward the navicular tuberosity. Move the probe sightly to capture the thickest part of the AbH, and then click on the Save button to save the still image.
- Then, rotate the probe 90° to obtain the cross-sectional image of the AbH and save the image.
NOTE: Maintain good contact between the probe and the skin without applying excessive pressure in muscle morphology measurements.
- Then, rotate the probe 90° to obtain the cross-sectional image of the AbH and save the image.
- Flexor digitorum brevis (FDB): Align the probe longitudinally on the line from the medial tubercle of the calcaneus to the third toe and scan the muscle to measure the thickness. Rotate the probe 90° to obtain the cross-sectional image.
- Quadratus plantae (QP): Align the probe longitudinally along the muscle fibers at the talocalcaneonavicular joint. Move the probe sightly to locate the thickest part of QP. Capture three images for thickness measurement. Rotate the probe 90° to obtain cross-sectional images.
NOTE: QP lies deep in the FDB. - Flexor hallucis brevis (FHB): Mark the first metatarsal, apply the ultrasound coupling gel, and then place the probe longitudinally along the shaft. Move the probe sightly to capture the thickest part of the FHB, and then rotate the probe 90° to obtain the cross-sectional image.
- Peroneus longus and brevis (PER): Instruct the participants to lie in the supine position. Mark the fibular head and the inferior border of the lateral malleolus, and mark 50% of the line connecting the two points. Apply the coupling gel and place the probe to capture the thickness. To obtain the cross-sectional image, rotate the probe 90° at the point where the thickness measurement was taken.
- Tibialis anterior (TA): Apply the coupling gel in front of the calf over 20% of the distance between the fibular head and the inferior border of the lateral malleolus. Place the probe longitudinally along the TA to obtain a thickness measurement.
NOTE: Due to the scanning range of the probe, the CSA of the TA cannot be captured completely. - Image measurement: Look for the previously captured images on the right side of the screen. Use the trackball to move the cursor, select one image, and click on the Set button. Then, click on the Measure button. The measurement items appear on the left side of the screen.
- Thickness: Use the trackball to move the cursor, select the distance measurement, and click on the Set button. Mark the two points of the thickest part of the muscle in the image (Figure 1 and Figure 2). Record the distance for the thickness.
- Cross-sectional area (CSA): Use the trackball to move the cursor to trace the periphery of the muscle in the image. After tracing the cross-section of the entire muscle, click on the Set button (Figure 1 and Figure 2). Record the area for the CSA.
- Turn on the musculoskeletal ultrasound system, and then click on the Freeze button. Plug the probe connector into the connection port on the rear side of the host and lock the Probe Lock button. Click on the iStation button, and then click on New Patient. Input the ID, name, gender, and date of birth of each participant.
- Muscle strength
- Insert dynamometer Bluetooth stick into the USB interface of the computer. Open the dynamometer and FET Data Collection Software and click on the Start Gauge button to wait for automatic pairing.
- Toe flexion strength test (FT1)
- Instruct the participant to sit in a chair with 90° flexion of the knee and ankle joint. Fix the dynamometer to the front side of the wooden frame. Connect the great toe to the dynamometer by carabiner (Figure 3B).
NOTE: Adjust the appropriate bars to avoid pain during the test. - Interchange the panels behind the foot to ensure that the heel to the head of the first metatarsal is supported while still allowing for unimpaired toe flexion. Adjust the carabiner so that the toe produces a steady baseline force, and then click on the Reset button to zero out the dynamometer.
- Click on the Start Gauge button in the software. Instruct the participant to remain stable until instructed to flex the big toe, pull as hard as possible for 3 s, and then relax the grip. Click on the Stop Gauge button, and save the data collected.
- Instruct the participant to sit in a chair with 90° flexion of the knee and ankle joint. Fix the dynamometer to the front side of the wooden frame. Connect the great toe to the dynamometer by carabiner (Figure 3B).
- Toe flexion strength test (FT2-3 and FT2-5)
- Use the T-shaped metal bars to attach to the dynamometer. Instruct the participant to flex the 2nd-3rd toes or 2nd-5th toes. Perform a similar test procedure as the FT1 test (Figure 3C,D).
- Doming test
- Place the dynamometer against the scaphoid tubercle. Instruct the participant to slide the forefoot toward the heel or raise the arch as much as possible without lifting or curling the toes, which would result in "shortening" of the foot and a raised medial longitudinal arch (Figure 3A).
- Then, ask the participant to do maximum voluntary contraction for 3 s. Perform data collection like previous toe flexion tests (steps 2.2.2 and 2.2.3).
NOTE: Record three successful trials for the data process and provide sufficient rest time between trials to avoid fatigue.
- Open the program software processing window and import the CSV files of the original strength data.
- Toe flexion force (FT1, FT2-3, FT2-5): Click on the Run button, select the Automatic Calculation option in the calculation list, and then click on the Calculation button. The software will actively calculate the peak strength of the toe grip (Figure 4).
- Doming force data: Import the original data into the software and click on the Run button. Select the Manual Calculation option in the calculation list. Then, drag the movable 0.5 s window manually, where the force curve is in the shape of a plateau, and the software will automatically calculate the average force in the window (Figure 5).

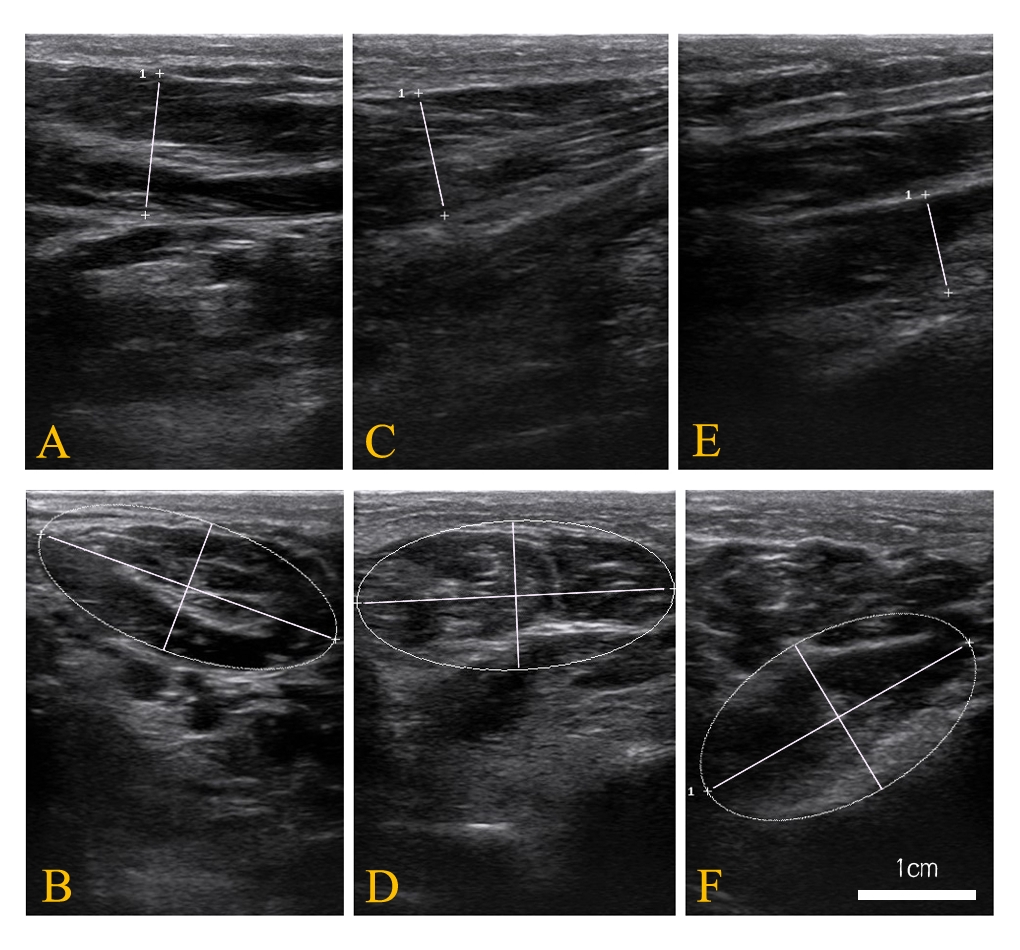
Figure 1: Representative ultrasound images of three intrinsic muscles. (A) Thickness Image of the abductor hallucis; (B) cross-sectional area of the abductor hallucis; (C) thickness image of the flexor digitorum brevis; (D) cross-sectional area of the flexor digitorum brevis; (E) thickness image of the quadratus plantae; and (F) cross-sectional area of the quadratus plantae. Please click here to view a larger version of this figure.

Figure 2: Representative ultrasound images of three extrinsic muscles. (A) Thickness image of the flexor hallucis brevis; (B) cross-sectional area of the flexor hallucis brevis; (C) thickness image of peroneus longus and brevis muscles; (D) cross-sectional area of peroneus longus and brevis muscles; and (E) thickness image of the tibialis anterior. Please click here to view a larger version of this figure.

Figure 3: Foot muscle strength test. (A) Doming test; (B) toe flexion strength test (FT1); (C) toe flexion strength test (FT2-3); (D) toe flexion strength test (FT2-5). Please click here to view a larger version of this figure.

Figure 4: Representative toe flexion strength plot. The peak force of toe flexion is calculated as the average value of six data points around the selected peak point. In the custom software, it is programmed that 10 points, including peak force remain relatively stable to avoid false peaks, which means that the remaining nine points do not exceed ±0.5 of the peak value. Please click here to view a larger version of this figure.

Figure 5: Representative doming strength plot. The force of maximum voluntary contraction is calculated for the doming strength. A movable 0.5 s window is present to determine where the force curve is in the shape of a plateau, which could be dragged manually. The strength of doming is programmed to calculate the average value of the selection window (0.5 ms). Please click here to view a larger version of this figure.
3. Passive subsystem
NOTE: The ND and foot posture index-6 (FPI-6) tests were applied to evaluate the foot structure (passive subsystem).
- Navicular drop (ND) test
- Assemble the height vernier caliper with the base, fixture block, and scribing claw. To specify the navicular tuberosity, extend the scribing claw through a stick. Place the height vernier caliper on the horizontal platform.
NOTE: The ND test is performed on the same horizontal platform. - Instruct the participants to sit on a height-adjustable chair and turn sideways to allow visualization of the medial longitudinal arch. Palpate the navicular tuberosity and mark its location. Instruct the participants to sit in a position where the knee, hip, and ankle joints make a 90° angle.
- Palpate the medial and lateral aspects of the participant's talus head. Supinate and pronate the subtalar joint until the medial and lateral sides of the talus are equally positioned.
- Align the head of the scribing claw with the marked navicular tuberosity. Read and record the height at this non-weight-bearing position (height 1).
- Instruct the participants to stand and keep the normal, bilateral, weight-bearing stance. Consistently, record the height (height 2).
- Define the vertical movement of the navicular tuberosity (i.e., height 1-height 2) in the sagittal plane as ND.
NOTE: In the process of the ND test, the participants must keep straight and look straight ahead.
- Assemble the height vernier caliper with the base, fixture block, and scribing claw. To specify the navicular tuberosity, extend the scribing claw through a stick. Place the height vernier caliper on the horizontal platform.
- Foot posture index-6 (FPI-6)
- Perform the FPI-6 test on the horizontal platform as in the ND test (step 3.1.1).
- Instruct the participants to take several steps, marching on the spot, and then stand in their relaxed stance position with double limb support. Inform them to stand still for approximately 2 min during the assessment.
- Palpate the talar head and rate its position on the lateral and medial sides.
- Palpate the lateral malleolar and score the supra- and infra-lateral malleolar curvature.
- Observe the calcaneal frontal plane position and score the angle between the posterior aspect of the calcaneus and the long axis of the foot.
- Palate the talonavicular joint (TNJ) and score the bulge or concave in this area.
- Palate and observe the curve of the medial longitudinal arch and score its height and congruence.
- Observe the forefoot directly behind and in line with the long axis of the heel and score the relative position of the forefoot on the rearfoot (abduction/adduction).
NOTE: In this test, each item is scored as -2, -1, 0, 1, and 2 (see Supplementary File 1).
4. Neural subsystem
NOTE: In the assessment of the neural subsystem, the plantar light touch threshold, and a two-point discriminator (TPD) were applied to evaluate the plantar sensitivity.
- Plantar light touch threshold
- Prepare Semmes-Weinstein monofilament (SWM) kit, consisting of 20 pieces. Each SWM kit has an index number ranging from 1.65 to 6.65 (1.65, 2.36, 2.44, 2.83, 3.22, 3.61, 3.84, 4.08, 4.17, 4.31, 4.56, 4.74, 4.93, 5.07, 5.18, 5.46, 5.88, 6.10, 6.45, and 6.65), which is related to a calibrated breaking force (i.e., index 1.65 is the equivalent of 0.008 g of force).
NOTE: The higher the index value, the stiffer and harder it is to bend. - Mark the test regions in the plantar sole, including the first toe (T1), first metatarsal head (MT1), third metatarsal head (MT3), fifth metatarsal head (MT5), midfoot (M), and heel (H).
- Apply 4.74 SWM to the participants' thenar eminences to feel the stimulus, which they will receive on the plantar sole in the formal test. Instruct participants to say "yes" and inform the examiner of the accurate site clearly and loudly every time the participants perceive the sensory stimulus of SWM at any tested sites.
NOTE: Every marked region can be replaced by one specific number in the convenience of memory. - Place each participant in the prone position on a standard treatment table facing away from the examiner with the foot hanging on the edge of the table. Instruct them to close their eyes and wear headphones to avoid the assistance of vision and minimize distraction, respectively.
- Apply SWM perpendicularly to the skin at the target region. Pressure is appropriate until the nylon SWM is bent to form a "C" shape. Then, hold it for 1 s before removal. 4.74 SWM is first applied over the marked region, and a 4-2-1 stepping algorithm is utilized to standardize the assessment21. Test six plantar regions at random.
NOTE: Provide a few seconds for rest in the interval of trails in case of sensory disturbance between marked regions. The last detected SWM is regarded as the threshold for that site.
- Prepare Semmes-Weinstein monofilament (SWM) kit, consisting of 20 pieces. Each SWM kit has an index number ranging from 1.65 to 6.65 (1.65, 2.36, 2.44, 2.83, 3.22, 3.61, 3.84, 4.08, 4.17, 4.31, 4.56, 4.74, 4.93, 5.07, 5.18, 5.46, 5.88, 6.10, 6.45, and 6.65), which is related to a calibrated breaking force (i.e., index 1.65 is the equivalent of 0.008 g of force).
- Two-point discriminator (TPD)
- Prepare the two-point discriminator device. The adjustable device has different distances, ranging from 1 mm to 15 mm.
NOTE: One side of the dial ranges from 1 mm to 8 mm, and revolving the dial to the other side ranges from 9 mm to 15 mm. - Mark the six test regions in the plantar sole, which are the same as those in the case of the plantar light touch threshold test (step 4.1.2).
- To make participants familiar with the testing process, apply the two-point discriminator in the participants' tip of the middle finger. Inform them to say "one" if they perceived one point or "two" if they perceived two points.
NOTE: The test position is the same as that in the plantar light touch threshold test. The participants should keep their eyes closed. - Start the test from the greatest distance (8 mm), and then decrease the width distance by 5 mm until the participants report one point. Move the device in 1 mm increments applying randomization of one or two points until the participants can consistently identify two points at a test width.
NOTE: Three times of correctly identifying two-point touch out of five touches is defined as positive. The last two-point value is recorded as the TPD threshold value.
- Prepare the two-point discriminator device. The adjustable device has different distances, ranging from 1 mm to 15 mm.
Access restricted. Please log in or start a trial to view this content.
Results
In this study, 84 participants were included for measurement. The young group included 42 university students with an average age of 22.4 ± 2.9 years and height of 1.60 ± 0.05 m. The elderly group included 42 community-dwelling elderly with an average age of 68.9 ± 3.3 years and height of 1.59 ± 0.05 m.
Representative active subsystem results
The morphology and strength of foot muscles are used to determine the function of the active subsystem. M...
Access restricted. Please log in or start a trial to view this content.
Discussion
The presented protocol is used to measure the characteristics of the foot in the elderly, which provides a comprehensive assessment to investigate foot core stability, including the passive, active, and neural subsystems. This new paradigm illuminates the foot function that interacts to stabilize the foot and sustain sensorimotor function in daily activities33. In previous studies, the researchers paid more attention to exploring foot deformity; toe flexion strength; diminished plantar sensory; an...
Access restricted. Please log in or start a trial to view this content.
Disclosures
The authors have no conflicts of interest.
Acknowledgements
The authors acknowledge the funding of the Breeding Program of Shanghai Tenth People's Hospital (YNCR2C022).
Access restricted. Please log in or start a trial to view this content.
Materials
| Name | Company | Catalog Number | Comments |
| Diagnostic Ultrasound System | Mindray | It is used in clinical ultrasonic diagnostic examination. | |
| ergoFet dynamometer | ergoFet | It is an accurate, portable, push/pull force gauge, which is designed to be a stand-alone gauge for capturing individual force measurements under any job condition. | |
| Height vernier caliper | It is an accurate measure tool for height. | ||
| LabVIEW | It is a customed program software for strength analysis. | ||
| Semmes-Weinstein monofilaments | Baseline | It consists of 20 pieces, and each SWM haves an index number ranging from 1.65 to 6.65, that is related with a calibrated breaking force. | |
| Two-Point Discriminator | Touch Test | It is a set of two aluminum discs, each containing a series of prongs spaced between 1 to 15 mm apart. |
References
- Guidozzi, F. Foot problems in older women. Climacteric: The Journal of the International Menopause Society. 20 (6), 518-521 (2017).
- Zelik, K. E., Honert, E. C. Ankle and foot power in gait analysis: Implications for science, technology and clinical assessment. Journal of Biomechanics. 75, 1-12 (2018).
- Farris, D. J., Kelly, L. A., Cresswell, A. G., Lichtwark, G. A. The functional importance of human foot muscles for bipedal locomotion. Proceedings of the National Academy of Sciences of the United States of America. 116 (5), 1645-1650 (2019).
- Bruijn, S. M., van Dieen, J. H. Control of human gait stability through foot placement. Journal of The Royal Society Interface. 15 (143), 20170816(2018).
- McKeon, P. O., Hertel, J., Bramble, D., Davis, I. The foot core system: a new paradigm for understanding intrinsic foot muscle function. British Journal of Sports Medicine. 49 (5), 290(2015).
- McKenzie, J. The foot as a half-dome. British Medical Journal. 1 (4921), 1068-1069 (1955).
- Soysa, A., Hiller, C., Refshauge, K., Burns, J. Importance and challenges of measuring intrinsic foot muscle strength. Journal of Foot and Ankle Research. 5 (1), 29(2012).
- Kelly, L. A., Cresswell, A. G., Racinais, S., Whiteley, R., Lichtwark, G. Intrinsic foot muscles have the capacity to control deformation of the longitudinal arch. Journal Of the Royal Society Interface. 11 (93), 20131188(2014).
- Galica, A. M., et al. Subsensory vibrations to the feet reduce gait variability in elderly fallers. Gait & Posture. 30 (3), 383-387 (2009).
- Park, J. H. The effects of plantar perception training on balance and falls efficacy of the elderly with a history of falls: A single-blind, randomized controlled trial. Archives of Gerontology and Geriatrics. 77, 19-23 (2018).
- Menz, H. B., Morris, M. E., Lord, S. R. Foot and ankle characteristics associated with impaired balance and functional ability in older people. The journals of gerontology. Series A, Biological Sciences and Medical Sciences. 60 (12), 1546-1552 (2005).
- Cobb, S. C., Bazett-Jones, D. M., Joshi, M. N., Earl-Boehm, J. E., James, C. R. The relationship among foot posture, core and lower extremity muscle function, and postural stability. Journal of Athletic Training. 49 (2), 173-180 (2014).
- Koyama, K., Yamauchi, J. Altered postural sway following fatiguing foot muscle exercises. PloS One. 12 (12), 0189184(2017).
- Rodriguez-Sanz, D., et al. Foot disorders in the elderly: A mini-review. Disease-a-Month: DM. 64 (3), 64-91 (2018).
- Osoba, M. Y., Rao, A. K., Agrawal, S. K., Lalwani, A. K. Balance and gait in the elderly: A contemporary review. Laryngoscope Investigative Otolaryngology. 4 (1), 143-153 (2019).
- Gimunova, M., Zvonar, M., Mikeska, O. The effect of aging and gender on plantar pressure distribution during the gait in elderly. Acta of Bioengineering and Biomechanics. 20 (4), 139-144 (2018).
- Cen, X., Jiang, X., Gu, Y. Do different muscle strength levels affect stability during unplanned gait termination. Acta of Bioengineering and Biomechanics. 21 (4), 27-35 (2019).
- Mickle, K. J., Munro, B. J., Lord, S. R., Menz, H. B., Steele, J. R. ISB Clinical Biomechanics Award 2009: toe weakness and deformity increase the risk of falls in older people. Clinical Biomechanics. 24 (10), 787-791 (2009).
- Spink, M. J., et al. Foot and ankle strength, range of motion, posture, and deformity are associated with balance and functional ability in older adults. Archives of Physical Medicine and Rehabilitation. 92 (1), 68-75 (2011).
- Singhal, A., Segal, A. R., Munshi, M. N. Diabetes in long-term care facilities. Current Diabetes Reports. 14 (3), 464(2014).
- James, K., Orkaby, A. R., Schwartz, A. W. Foot examination for older adults. The American Journal of Medicine. 134 (1), 30-35 (2021).
- Awale, A., et al. Foot function, foot pain, and falls in older adults: The Framingham foot study. Gerontology. 63 (4), 318-324 (2017).
- Stolt, M., Suhonen, R., Voutilainen, P., Leino-Kilpi, H. Foot health in older people and the nurses' role in foot health care--a review of literature. Scandinavian Journal of Caring Sciences. 24 (1), 194-201 (2010).
- Kusagawa, Y., et al. Toe flexor strength is associated with mobility in older adults with pronated and supinated feet but not with neutral feet. Journal of Foot and Ankle Research. 13 (1), 55(2020).
- Yamauchi, J., Koyama, K. Toe flexor strength is not related to postural stability during static upright standing in healthy young individuals. Gait & Posture. 73, 323-327 (2019).
- Uritani, D., Fukumoto, T., Matsumoto, D., Shima, M. The relationship between toe grip strength and dynamic balance or functional mobility among community-dwelling Japanese older adults: A cross-sectional study. Journal of Aging and Physical Activity. 24 (3), 459-464 (2016).
- Menz, H. B., Zammit, G. V., Munteanu, S. E., Scott, G. Plantarflexion strength of the toes: age and gender differences and evaluation of a clinical screening test. Foot & Ankle International. 27 (12), 1103-1108 (2006).
- Ridge, S. T., Myrer, J. W., Olsen, M. T., Jurgensmeier, K., Johnson, A. W. Reliability of doming and toe flexion testing to quantify foot muscle strength. Journal of Foot and Ankle Research. 10, 55(2017).
- Wang, X., Chen, L., Liu, W., Su, B., Zhang, Y. Early detection of atrophy of foot muscles in Chinese patients of type 2 diabetes mellitus by high-frequency ultrasonography. Journal of Diabetes Research. 2014, 927069(2014).
- Jung, D. Y., Koh, E. K., Kwon, O. Y. Effect of foot orthoses and short-foot exercise on the cross-sectional area of the abductor hallucis muscle in subjects with pes planus: a randomized controlled trial. Journal of Back and Musculoskeletal Rehabilitation. 24 (4), 225-231 (2011).
- Snyder, B. A., Munter, A. D., Houston, M. N., Hoch, J. M., Hoch, M. C. Interrater and intrarater reliability of the semmes-weinstein monofilament 4-2-1 stepping algorithm. Muscle & Nerve. 53 (6), 918-924 (2016).
- Redmond, A. C., Crane, Y. Z., Menz, H. B. Normative values for the Foot Posture Index. Journal of Foot and Ankle Research. 1 (1), 6(2008).
- McKeon, P. O., Fourchet, F. Freeing the foot: integrating the foot core system into rehabilitation for lower extremity injuries. Clinics in Sports Medicine. 34 (2), 347-361 (2015).
- Navarro-Peternella, F. M., Teston, E. F., Dos Santos Santiago Ribeiro, B. M., Marcon, S. S. Plantar cutaneous sensory stimulation improves foot sensibility and gait speed in older adults with diabetes: A clinical trial. Advances in Skin & Wound Care. 32 (12), 568-573 (2019).
- Felicetti, G., Thoumie, P., Do, M. C., Schieppati, M. Cutaneous and muscular afferents from the foot and sensory fusion processing: Physiology and pathology in neuropathies. Journal of the Peripheral Nervous System: JPNS. 26 (1), 17-34 (2021).
- Park, D. J., Lee, K. S., Park, S. Y. Effects of two foot-ankle interventions on foot structure, function, and balance ability in obese people with Pes Planus. Healthcare. 9 (6), 667(2021).
- Garth, W. P., Miller, S. T. Evaluation of claw toe deformity, weakness of the foot intrinsics, and posteromedial shin pain. The American Journal of Sports Medicine. 17 (6), 821-827 (1989).
- Machado, A. S., Bombach, G. D., Duysens, J., Carpes, F. P. Differences in foot sensitivity and plantar pressure between young adults and elderly. Archives of Gerontology and Geriatrics. 63, 67-71 (2016).
- Scott, G., Menz, H. B., Newcombe, L. Age-related differences in foot structure and function. Gait & Posture. 26 (1), 68-75 (2007).
- Protopapas, K., Perry, S. D. The effect of a 12-week custom foot orthotic intervention on muscle size and muscle activity of the intrinsic foot muscle of young adults during gait termination. Clinical Biomechanics. 78, 105063(2020).
- Mickle, K. J., Angin, S., Crofts, G., Nester, C. J. Effects of age on strength and morphology of toe flexor muscles. The Journal of Orthopaedic and Sports Physical Therapy. 46 (12), 1065-1070 (2016).
- Endo, M., Ashton-Miller, J. A., Alexander, N. B. Effects of age and gender on toe flexor muscle strength. Journal of Gerontology: MEDICAL SCIENCES. 57 (6), 392-397 (2002).
- Mickle, K. J., Nester, C. J., Crofts, G., Steele, J. R. Reliability of ultrasound to measure morphology of the toe flexor muscles. Journal of Foot and Ankle Research. 6 (1), 12(2013).
- Headlee, D. L., Leonard, J. L., Hart, J. M., Ingersoll, C. D., Hertel, J. Fatigue of the plantar intrinsic foot muscles increases navicular drop. Journal of electromyography and kinesiology : official journal of the International Society of Electrophysiological Kinesiology. 18 (3), 420-425 (2008).
- Han, J., Park, S., Jung, S., Choi, Y., Song, H. Comparisons of changes in the two-point discrimination test following muscle fatigue in healthy adults. Journal of Physical Therapy Science. 27 (3), 551-554 (2015).
- Greenman, R. L., et al. Foot small muscle atrophy is present before the detection of clinical neuropathy. Diabetes Care. 28 (6), 1425-1430 (2005).
- Viseux, F. J. F. The sensory role of the sole of the foot: Review and update on clinical perspectives. Neurophysiologie Clinique = Clinical Neurophysiology. 50 (1), 55-68 (2020).
- Sakamoto, K., Kudo, S. Morphological characteristics of intrinsic foot muscles among flat foot and normal foot using ultrasonography. Acta of Bioengineering and Biomechanics. 22 (4), 161-166 (2020).
- Cheung, R. T. H., Sze, L. K. Y., Mok, N. W., Ng, G. Y. F. Intrinsic foot muscle volume in experienced runners with and without chronic plantar fasciitis. Journal of Science and Medicine in Sport. 19 (9), 713-715 (2016).
Access restricted. Please log in or start a trial to view this content.
Reprints and Permissions
Request permission to reuse the text or figures of this JoVE article
Request PermissionExplore More Articles
This article has been published
Video Coming Soon
Copyright © 2025 MyJoVE Corporation. All rights reserved