
A subscription to JoVE is required to view this content. Sign in or start your free trial.
Method Article
High-Resolution Neutron Spectroscopy to Study Picosecond-Nanosecond Dynamics of Proteins and Hydration Water
In This Article
Summary
Neutron backscattering spectroscopy offers a nondestructive and label-free access to the ps-ns dynamics of proteins and their hydration water. The workflow is presented with two studies on amyloid proteins: on the time-resolved dynamics of lysozyme during aggregation and on the hydration water dynamics of tau upon fiber formation.
Abstract
Neutron scattering offers the possibility to probe the dynamics within samples for a wide range of energies in a nondestructive manner and without labeling other than deuterium. In particular, neutron backscattering spectroscopy records the scattering signals at multiple scattering angles simultaneously and is well suited to study the dynamics of biological systems on the ps-ns timescale. By employing D2O-and possibly deuterated buffer components-the method allows monitoring of both center-of-mass diffusion and backbone and side-chain motions (internal dynamics) of proteins in liquid state.
Additionally, hydration water dynamics can be studied by employing powders of perdeuterated proteins hydrated with H2O. This paper presents the workflow employed on the instrument IN16B at the Institut Laue-Langevin (ILL) to investigate protein and hydration water dynamics. The preparation of solution samples and hydrated protein powder samples using vapor exchange is explained. The data analysis procedure for both protein and hydration water dynamics is described for different types of datasets (quasielastic spectra or fixed-window scans) that can be obtained on a neutron backscattering spectrometer.
The method is illustrated with two studies involving amyloid proteins. The aggregation of lysozyme into µm sized spherical aggregates-denoted particulates-is shown to occur in a one-step process on the space and time range probed on IN16B, while the internal dynamics remains unchanged. Further, the dynamics of hydration water of tau was studied on hydrated powders of perdeuterated protein. It is shown that translational motions of water are activated upon the formation of amyloid fibers. Finally, critical steps in the protocol are discussed as to how neutron scattering is positioned regarding the study of dynamics with respect to other experimental biophysical methods.
Introduction
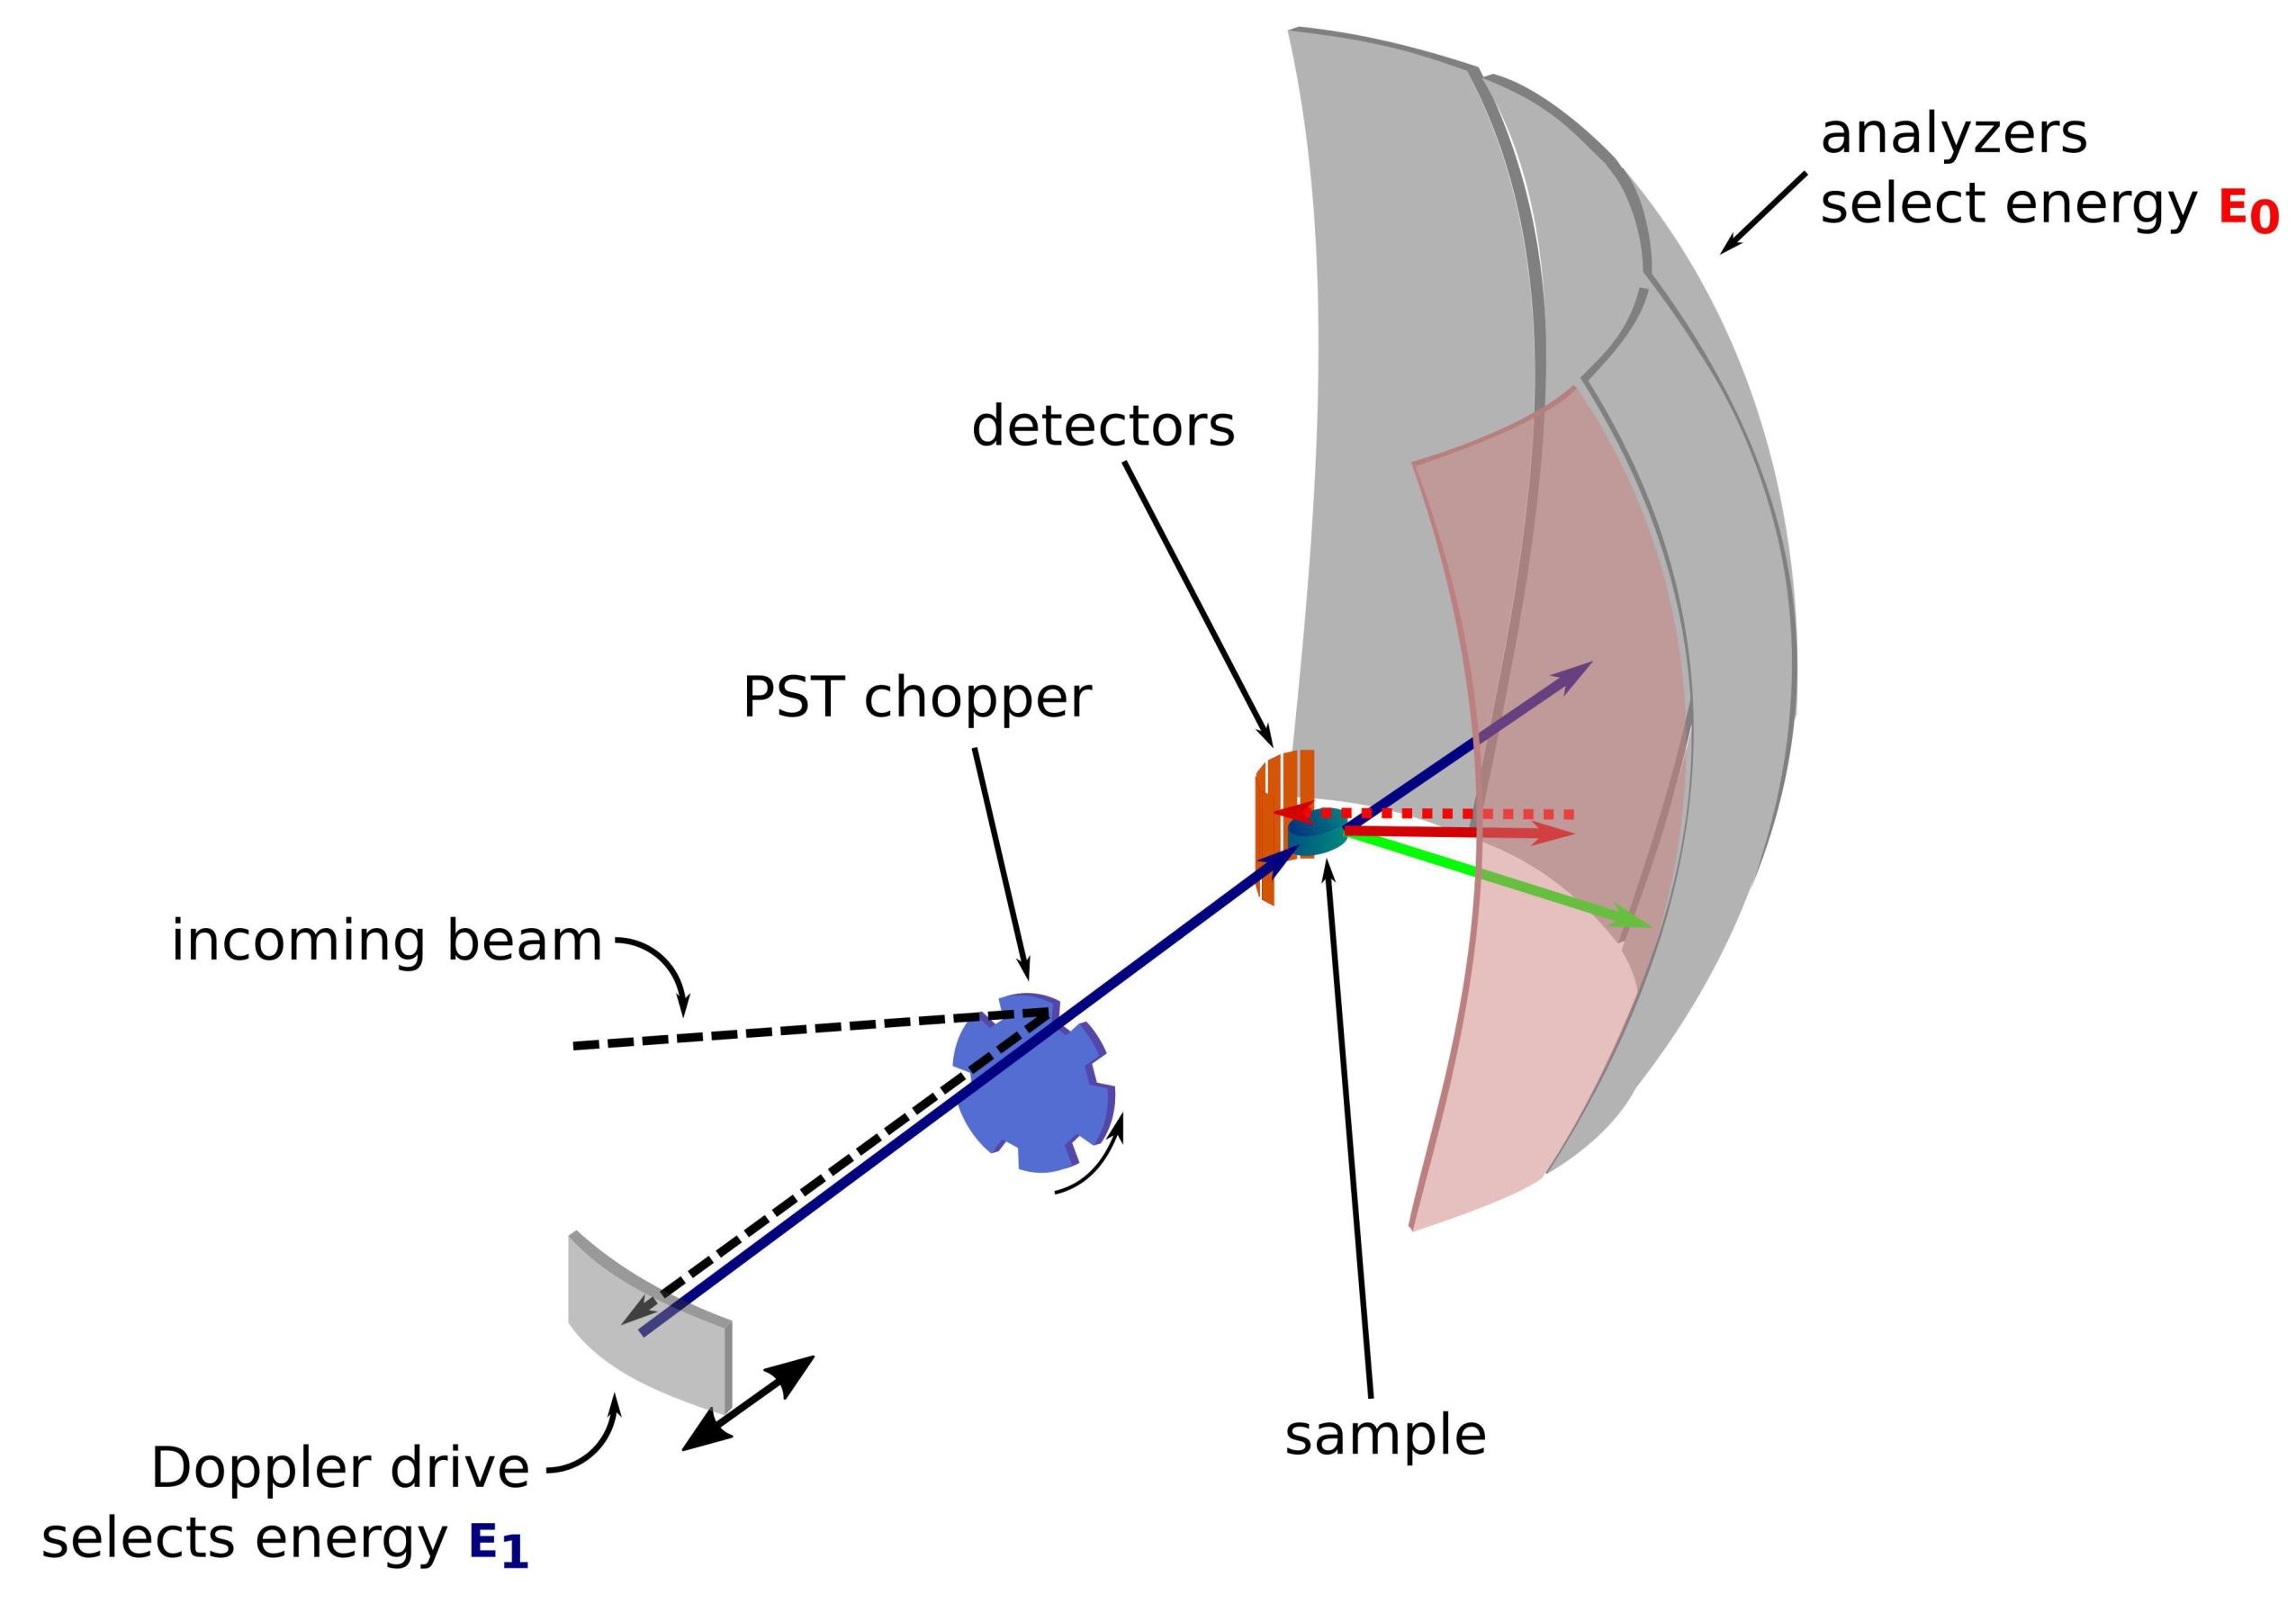
The neutron is a charge-less and massive particle that has been successfully used over the years to probe samples in various fields from fundamental physics to biology1. For biological applications, small-angle neutron scattering, inelastic neutron scattering, and neutron crystallography and reflectometry are extensively used2,3,4. Inelastic neutron scattering provides an ensemble-averaged measurement of the dynamics without requiring specific labeling per se, and a signal quality that does not depend on the size or the protein5. The measurement can be done using a highly complex environment for the protein under study that mimics the intracellular medium, such as a deuterated bacterial lysate or even in vivo3,6,7. Different experimental setups can be used to study the dynamics, namely i) time-of-flight-giving access to sub-ps-ps dynamics, ii) backscattering-giving access to ps-ns dynamics, and iii) spin-echo-giving access to dynamics from ns to hundreds of ns. Neutron backscattering makes use of the Bragg's law 2d sinθ = nλ, where d is the distance between planes in a crystal, θ the scattering angle, n the scattering order, and λ the wavelength. The use of crystals for backscattering toward the detectors allows for achieving a high resolution in energy, typically ~0.8 µeV. To measure the energy exchange, either a Doppler drive carrying a crystal in backscattering is used to define and tune the incoming neutron wavelength8,9,10 (Figure 1), or a time-of-flight setup can be used at the cost of a decrease in energy resolution11.

Figure 1: Sketch of a neutron backscattering spectrometer with a Doppler drive. The incoming beam hits the phase space transformation (PST) chopper42, which increases the flux at the sample position. It is then backscattered towards the sample by the Doppler drive, which selects an energy E1 (cyan arrow). The neutrons are then scattered by the sample (with different energies represented by the color of the arrows) and the analyzers, made of Si 111 crystals, will only backscatter neutrons with a specific energy E0 (red colored arrows here). Hence, the momentum transfer q is obtained from the detected position of the neutron on the detector array, and the energy transfer is obtained from the difference E1- E0. The time-of-flight expected for the neutron pulse produced by the PST is used to discard the signal from the neutrons scattered directly toward the detector tubes. Abbreviation: PST = phase space transformation. Please click here to view a larger version of this figure.
For backscattering spectroscopy, the main contribution to the signal from hydrogen proton-rich samples, such as proteins, comes from incoherent scattering, for which the scattering intensity Sinc(q, ω) is shown by Eq (1)12
 (1)
(1)
Where σinc is the incoherent cross-section of the element considered, k' is the norm of the scattered wavevector, k the norm of the incoming wavevector, q (= k - k') the momentum transfer, rj(t) the position vector of atom j at time t, and ω the frequency corresponding to the energy transfer between the incoming neutron and the system. The angular brackets denote the ensemble average. Hence, incoherent scattering probes the ensemble-averaged single-particle self-correlation of atom positions with time and gives the self-dynamics averaged over all atoms in the system and different time origins (ensemble average). The scattering function is the Fourier transform in time of the intermediate scattering function I(q, t), which can be viewed as the Fourier transform in space of the van Hove correlation function shown by Eq (2):
 (2)
(2)
Where ρ(r,t) is the probability density of finding an atom at position r and time t13.
For a Fickian diffusion process, the self-diffusion function results (see Eq (3)) after a double Fourier transform in a scattering function consisting in a Lorentzian of line width given by γ = Dq2.
 (3)
(3)
More sophisticated models were developed and found useful such as the jump diffusion model by Singwi and Sjölander for ps-ns internal protein dynamics14 or the rotation model by Sears for hydration water15,16,17.
On the neutron backscattering (NBS) instrument IN16B8,9 at the ILL, Grenoble, France (Supplemental Figure S1), a setup commonly used with proteins consists of Si 111 crystals for the analyzers with a Doppler drive for tuning the incoming wavelength (Supplemental Figure S2A), thereby giving access to the momentum transfer range ~0.2 Å-1 < q < ~2 Å-1 and energy transfer range of -30 µeV <  < 30 µeV-corresponding to timescales ranging from a few ps to a few ns and distances of a few Å. In addition, IN16B offers the possibility to perform elastic and inelastic fixed-window scans (E/IFWS)10, which include data acquisition at a fixed energy transfer. As the flux is limited when working with neutrons, E/IFWS allows maximization of the flux for one energy transfer, thus reducing the acquisition time needed to obtain a satisfying signal-to-noise ratio. A more recent option is the backscattering and time-of-flight spectrometer (BATS) mode11, which allows measurement of a wide range of energy transfers, (e.g., -150 µeV < < 150 µeV), with a higher flux than with the Doppler drive, yet at the cost of a lower energy resolution (Supplemental Figure S2B).
An important property of neutron scattering is that the incoherent cross section σinc has a 40 times higher value for hydrogen than for deuterium and is negligible for other elements commonly found in biological samples. Therefore, the dynamics of proteins in a liquid environment can be studied by using a deuterated buffer, and the powder state allows for the study of either protein internal dynamics with hydrogenated protein powder hydrated with D2O, or the study of hydration water for perdeuterated protein powder hydrated with H2O. In the liquid state, neutron backscattering typically allows simultaneously accessing of the center-of-mass self-diffusion of proteins (Fickian-type diffusion) and their internal dynamics. The latter are backbone and side-chain motions usually described by the so-called jump diffusion model or others3,18. In hydrogenated protein powders, the protein diffusion is absent and only internal dynamics needs to be modeled. For hydration water, the contributions of translational and rotational motions of water molecules present a different dependence on the momentum transfer q, which allows for their distinction in the data analysis process17.
This paper illustrates the neutron backscattering method with the study of proteins that were found to be able to unfold, aggregate into a canonical form consisting of stacks of β-strands-the so-called cross-β pattern19,20-and form elongated fibers. This is the so-called amyloid aggregation, which is extensively studied due to its central role in neurodegenerative disorders such as Alzheimer's or Parkinson's diseases21,22. The study of the amyloid proteins is also motivated by the functional role they can play23,24 or their high potential for the development of novel biomaterials25. The physicochemical determinants of the amyloid aggregation remain unclear, and no general theory of amyloid aggregation is available, despite tremendous progress during the past years21,26.
Amyloid aggregation implies changes in protein structure and stability with time, the study of which naturally implies dynamics, linked to protein conformation stability, protein function, and protein energy landscape27. Dynamics is directly linked to the stability of a specific state through the entropic contribution for the fastest motions28, and protein function can be sustained by motions on various timescales from sub-ps for light-sensitive proteins29 to ms for domain motions, which can be facilitated by picosecond-nanosecond dynamics30.
Two examples of using neutron backscattering spectroscopy to study amyloid proteins will be presented, one in the liquid state to study protein dynamics and one in the hydrated powder state to study hydration water dynamics. The first example concerns the aggregation of lysozyme into µm sized spheres (called particulates) followed in real time5, and the second a comparison of water dynamics in native and aggregated states of the human protein tau31.
Lysozyme is an enzyme involved in immune defense and is composed of 129 amino acid residues. Lysozyme can form particulates in deuterated buffer at pD of 10.5 and at a temperature of 90 °C. With neutron scattering, we showed that the time evolution of the center-of-mass diffusion coefficient of lysozyme follows the single exponential kinetics of thioflavin T fluorescence (a fluorescent probe used to monitor the formation of amyloid cross-β patterns32), indicating that the formation particulate superstructures and cross-β patterns occur in a single step with the same rate. Moreover, the internal dynamics remained constant throughout the aggregation process, which can be explained either by a fast conformational change that cannot be observed on NBS instruments, or by the absence of significant change in protein internal energy upon aggregation.
The human protein tau is an intrinsically disordered protein (IDP) consisting of 441 amino acids for the so-called 2N4R isoform, which is notably involved in Alzheimer's disease33. Using neutron backscattering on powders of perdeuterated protein tau, we showed that hydration water dynamics is increased in the fiber state, with a higher population of water molecules undergoing translational motions. The result suggests that an increase in hydration water entropy might drive the amyloid fibrillation of tau.
Protocol
1. Prepare the deuterated buffer for proteins in the liquid state
- Dissolve all components of the buffer in pure D2O.
- If the pH electrode was calibrated in H2O, adjust the pD according to the formula pD = pH + 0.4 using NaOD or DCl34.
NOTE: The use of D2O instead of H2O might affect protein solubility and the buffer conditions might need to be adapted, (e.g., by a slight change in salt concentration).
2. Prepare the H2O-hydrated powders of perdeuterated protein
- Prepare the sample holder.
- Thoroughly clean a flat aluminum sample holder with its indium wire seal and screws with water and ethanol and let it dry.
NOTE: A flat sample holder is used such that the powder can be homogenously distributed over the surface. The amount of powder should be sufficient such that it can be maintained between the walls and does not fall when the sample holder is placed vertically. - Weigh the different parts of the sample holder-bottom, lid, and indium wire-separately on a precision balance.
- Place the 1 mm indium wire seal in the groove of the bottom part of the sample holder, leaving a small overlap where the two ends join (Figure 2A).
- Place an appropriate amount of lyophilized protein (typically ~100 mg of protein) such that it fills the inner surface of the bottom part of the sample holder.
- Thoroughly clean a flat aluminum sample holder with its indium wire seal and screws with water and ethanol and let it dry.
- Hydrate the protein powder.
- Place the sample holder in a desiccator with a Petri dish containing P2O5 powder for 24 h to completely dry the protein powder35 (Figure 2B). Weigh the dry bottom part of the sample holder containing the indium seal and the dry powder to obtain mdry.
CAUTION: P2O5 powder is very corrosive. - Remove the P2O5 from the desiccator and put a Petri dish with D2O inside. Control the mass of the powder regularly to check the hydration level h = mhyd / mdry where mhyd and mdry are the mass of the hydrated powder and dry powder, respectively.
NOTE: For highly hydrophobic proteins such as insulin, it might be necessary to increase the temperature inside the desiccator to get a higher vapor pressure and reach the desired hydration level h. - Repeat steps 2.2.1 and 2.2.2 at least three times to properly convert all exchangeable hydrogens to deuterons.
NOTE: Alternatively, cycles of freeze-drying and dissolution in pure D2O might be used for better H/D exchange provided that the protein is not affected by it. - Hydrate the powder to slightly above the desired level, let the bottom part of the sample holder with the indium wire and hydrated powder remain on the precision balance, and wait for the mass to decrease slowly to the desired value to get the target h (typically 0.2-0.4 if a medium sized globular protein is to be covered by one complete hydration layer).
- Quickly put the lid on the bottom part and close the sample holder first with four screws to stop the vapor exchange (Supplemental Figure S3A).
- Place and tighten all remaining screws until no gap is visible between the bottom part and the lid (Supplemental Figure S3B).
- Weigh the sealed sample holder to check for any potential hydration loss via leaks after the neutron experiment.
- Place the sample holder in a desiccator with a Petri dish containing P2O5 powder for 24 h to completely dry the protein powder35 (Figure 2B). Weigh the dry bottom part of the sample holder containing the indium seal and the dry powder to obtain mdry.
3. Perform the incoherent neutron scattering experiment
- Discuss and double-check the configuration of the instrument needed for the experiment with the local contact some weeks before the assigned beamtime.
- Prepare the liquid state sample.
- Dissolve the protein in the deuterated buffer.
- Determine the appropriate volume of liquid to be put in the sample holder using water (ensure there is no overflow when the sample holder is closed; Figure 2C).
NOTE: The following steps (3.3 and 3.4) describe an experiment conducted on the NBS spectrometer IN16B at the ILL8,9, using a cryofurnace as a sample environment. The instrument control system will change from one instrument to the other, but the working principles remain the same.
- Insert the sample.
- Thoroughly dry the sample stick (Figure 2D), and remove the previous sample, if any, after checking that the ionizing radiation dose is lower than 100 µSv/h before handling any material (at the ILL).
- Place the sample, check for proper centering relative to the beam center (Supplemental Figure S4), and insert the sample stick in the cryofurnace (Figure 2D). Turn on the vacuum pump to reach less than 10-3 bar, and flush out the air inside the cryofurnace by repeating the following three times: fill the cryofurnace with helium gas until atmospheric pressure is reached, and remove the gas again using the vacuum pump.
NOTE: In case of a flat sample holder, the sample holder must be oriented at a 45° angle relative to the incoming beam. The useful momentum transfer range could be reduced due to absorption and scattering by the cell. A strong neutron absorber such as cadmium can be used to mask certain parts of the sample holder (e.g., screws, thick parts). - Introduce some helium gas in the cryofurnace such that the pressure is ~0.05 bar.
- Acquire data (e.g., using NOMAD on IN16B at the ILL, it is assumed that the user prefers a temperature of 200 K before acquiring a quasielastic neutron spectrum (QENS) spectrum, then E/IFWS during a temperature ramp to 310 K at 0.5 K per min and finally a QENS at 310 K).
- Using NOMAD, in the execution tab, drag and drop a FurnaceCryostat controller in the Launch Pad. Set the temperature to 200 K. Use the fast mode and a timeout of 30 min such that the temperature has time to stabilize. Click on the rotating arrows icon to run it in the background such that data can be acquired during the temperature decrease.
- Drag and drop the IN16DopplerSettings controller, set the speed profile to Accurate velocity set by Max ΔE, a value of 0.00 µeV and 128 channels to obtain an EFWS configuration.
- Drag and drop a Count controller, fill the Subtitle field with a name that allows easy identification of the data, and set 60 repetitions of 30 s scans (Supplemental Figure S5A).
- Drag and drop an IN16DopplerSettings controller, set the speed profile to Sine set by Speed with a value of 4.5 m/s and 2,048 channels to obtain a QENS configuration.
- Drag and drop a Count controller with 4 repetitions of 30 min scans (Supplemental Figure S5B).
- For the temperature ramp, drag and drop a FurnaceCryostat controller, set the temperature to 310 K, set Ramp to SetPoint with Δ = 0.05 K and 6 s. Use a time out of 220 min (Supplemental Figure S6A).
- Use a for loop with 65 repetitions. Inside, insert an IN16DopplerSettings controller as in step 3.4.2, followed by a single count of 30 s. Subsequently, insert IN16DopplerSettings, as described previously but using an energy offset of 1.5 µeV and 1,024 channels followed by a single count of 3 min (Supplemental Figure S6B).
- To acquire the last QENS at 310 K, drag and drop IN16DopplerSettings and Count controllers configured as described in steps 3.4.4 and 3.4.5, respectively.
- Press the start button (right triangle on the bottom of the window) to run the script.
NOTE: Every experiment will require the acquisition of calibration data; that is, the empty cell for subtraction or absorption corrections, the buffer alone at the different temperatures used to model the background, and a measurement of vanadium (or equivalently, the sample at a temperature of 10 K or lower) to obtain the resolution function of the instrument.
4. Data analysis - QENS
- Import the dataset using the 'IN16B_QENS.process()' method in the Python software nPDyn v3.x36
>>>> from nPDyn.dataParsers import IN16B_QENS
>>> sample = IN16B_QENS(
...<path to data files>
... [detGroup=<integer or detector grouping file in XML
...format>]
... ).process()
>>> sample = sample.get_q_range(0.3, 1.8) - Perform data corrections (optional) with the following commands (see the documentation of nPDyn for more information, Figure 3):
#it is assumed that data for empty cell, vanadium, and buffer
# were imported already in dataset called 'empty_cell', 'vanadium',
# and 'buffer', respectively.
# for empty cell subtraction with a scaling factor
# (errors are propagated automatically)
>>> sample = sample - 0.95 * empty_cell
# for correction using Paalman-Ping coefficient
# (mutually exclusive with the example above)
>>> sample = sample.absorptionCorrection(empty_cell)
# for normalization
>>> sample = sample.normalize(vanadium)
# for binning along observable axis
# observable is the aggregation time here
>>> sample = sample.bin(3, axis=0) - Fit the calibration data. The dataset-samples, empty cell, deuterated buffer (if needed), and vanadium-can be fitted using built-in models or a user-defined model (see nPDyn documentation):
>>> from nPDyn.models.builtins import (
... modelPVoigt,
... modelWater,
...modelCalibratedD2O,
... )
# builtin models use a column vector of the momentum
# transfer q values
>>> q = vanadium.q[:, None]
# the vanadium is fitted using a pseudo-Voigt profile
>>> vanadium.fit(modelPVoigt(q)) - Use the built-in model for hydration water called 'modelWater'. This model reads as shown by Eq (4)17
 (4)
(4)
Where a0, ar, and at are scalars accounting for the relative contribution of elastic signal, rotational motions, and translational motions, respectively; j1(qd) is the lth order spherical Bessel function, with q being the momentum transfer; d the O-H distance in the water molecule; δ(ω) is the Dirac delta, which is multiplied by the EISF here; N is the highest order of the spherical Bessel function used (typically ~5); and
and  are the Lorentzian rotational and translational motions, respectively; b(q) is a flat background term. The spherical Bessel functions give the relative contribution of each angular momentum state of the water molecules, and the number N is determined based on the momentum transfer q-range. In the case of a typical NBS spectrometer, the terms up to N = 4 almost entirely explain the signal (Supplemental Figure S7).
# here, equation 2 is used for hydration water
# convolution with resolution function and addition of
# D2O background is done automatically with the
# provided arguments
>>> sample.fit(modelWater(q),
... res=vanadium,
... bkgd=buffer,
... volume_fraction_bkgd=0.95
... )
NOTE: The contributions of rotational and translational motions should be convoluted to be perfectly rigorous. The success of an additive model is to be attributed to the presence of distinct populations of water on the protein surface and the limited energy range accessible. - Use the following to plot the data (Figure 4):
>>> from nPDyn.plot import plot
>>> plot(sample)
5. Data analysis - temperature ramp, elastic fixed-window scans (EFWS)
- Use a procedure similar to section 4 to normalize the temperature ramp data by the signal at the lowest temperature (typically 10 K):
>>> from nPDyn.dataParsers import IN16B_FWS
>>> sample = IN16B_FWS(
... <path to data files>,
... detGroup=[detGroup=<integer or detector grouping file in XML format>]
... ).process()
# normalization with the 5 first points on the observable
# axis, which correspond to the temperature
>>> sample /= sample[:5].mean(0)
# the momentum transfer q range used here is smaller
# as the model used is valid for low q only
>>> sample = sample.get_q_range(0.2, 0.8) - Use a simple Gaussian model to start, the width of which is given by the so-called mean squared displacement (MSD). Build and fit the model using the following commands:
>>> import numpy as np
>>> from nPDyn.models import Parameters, Model, Component
# a is a scaling factor
>>> params = Parameters(
... a={'value': 1, 'bounds': (0, np.inf)},
... msd={'value': 1, 'bounds': (0, np.inf)}
... )
>>> model = Model(params)
>>> model.addComponent(Component(
… 'gaussian',
… lambda x, a, msd: a * np.exp(-x ** 2 * msd / 6)
… ))
>>> sample.fit(model, x=sample.q[:, None])
>>> plot(sample)
NOTE: The Gaussian approximation always holds for q2MSD << 1, but wider momentum transfer range can be used for relative comparison between samples. More sophisticated models, which go beyond the Gaussian approximation, have been developed37,38,39.
6. Data analysis - elastic and inelastic fixed-window scans (E/IFWS)
- Similar to step 4, import the dataset but using the 'IN16B_FWS' class:
>>> from nPDyn.dataParsers import IN16B_FWS
>>> sample = IN16B_FWS(
...<path to data files>
... [detGroup=<integer or detector grouping file in XML format>]
... ).process()
>>> sample = sample.get_q_range(0.3, 1.8) - Fit the calibration data and sample data.
- Analyze the E/IFWS data using a generalized MSD40 or by considering them as coarse-QENS spectra (having only a few data points on the energy axis). When E/IFWS is viewed as coarse-QENS, models used for QENS are used to fit the whole E/IFWS dataset at once (global fit of energy transfers and momentum transfers).
NOTE: The latter solution-using models for QENS on E/IFWS data-is used here where the momentum transfer dependence of center-of-mass diffusion and protein internal dynamics are imposed. - Model protein dynamics in liquids using the following Eq (5) ('modelProteinJumpDiff' in nPDyn):
 (5)
(5)
Where R(q,ω) is the resolution function; β a scalar independent for each momentum transfer q; a0 is the elastic incoherent structure factor (EISF); a Lorentzian accounting for center-of-mass diffusion with a width given by Eq (6);
  is a Lorentzian that includes center-of-mass diffusion and a contribution following the jump-diffusion model14 accounting for internal dynamics (Eq (7);
  being the fitted signal from D2O rescaled by its volume fraction in the sample.
γ = Dsq2 (6)
Ds being the self-diffusion coefficient.
 (7)
(7)
Di being the apparent diffusion coefficient for internal dynamics and τ a relaxation time for diffusive motions.
>>> from nPDyn.models.builtins import (
... modelPVoigt,
... modelProteinJumpDiff,
...modelCalibratedD2O,
... )
# builtin models use a column vector of the momentum
# transfer q values
>>> q = vanadium.q[:, None]
# the vanadium is fitted using a pseudo-Voigt profile
>>> vanadium.fit(modelPVoigt(q))
# for pure D2O, a model with calibrated linewidth
# for different temperatures is included in nPDyn
>>> buffer.fit(modelCalibratedD2O(q, temp=363))
# here, equation 3 is used for liquid samples
# convolution with resolution function and addition of
# D2O background is done automatically with the# provided arguments
>>> sample.fit(modelProteinJumpDiff(q),
... res=vanadium,
... bkgd=buffer,
... volume_fraction_bkgd=0.95
... )
- Analyze the E/IFWS data using a generalized MSD40 or by considering them as coarse-QENS spectra (having only a few data points on the energy axis). When E/IFWS is viewed as coarse-QENS, models used for QENS are used to fit the whole E/IFWS dataset at once (global fit of energy transfers and momentum transfers).
- Plot the fitted data using:
>>> from nPDyn.plot import plot
>>> plot(sample)
Results
The aggregation of lysozyme into particulates was performed at 90 °C with a protein concentration of 50 mg/mL in a deuterated buffer (0.1 M NaCl at pD 10.5). The formation of particulates is triggered by the temperature increase to 90 °C and occurs within 6 h (Supplemental Figure S8). The data acquisition was performed on IN16B, as described in the protocol above (data are permanently curated by the ILL and accessible at http://dx.doi.org/10.5291/ILL-DATA.8-04-811).
Discussion
Neutron spectroscopy is the only method that allows probing the ensemble-averaged ps-ns dynamics of protein samples regardless of the size of the protein or the complexity of the solution when deuteration is used6. Specifically, by probing self-diffusion of protein assemblies in solution, the hydrodynamic size of such assemblies can be unambiguously determined. Nonetheless, the method is commonly limited by the low neutron flux, which implies long acquisition times and the requirement of high amou...
Disclosures
The authors have no conflicts of interest to disclose.
Acknowledgements
The authors are grateful to Michaela Zamponi at the Jülich Centre for Neutron Science at the Heinz Maier-Leibnitz Zentrum, Garching, Germany, for part of the neutron scattering experiments conducted on the instrument SPHERES. This work has benefited from the activities of the Deuteration Laboratory (DLAB) consortium funded by the European Union under Contracts HPRI-2001-50065 and RII3-CT-2003-505925, and from UK Engineering and Physical Sciences Research Council (EPSRC)-funded activity within the Institut Laue Langevin EMBL DLAB under Grants GR/R99393/01 and EP/C015452/1. Support by the European Commission under the 7th Framework Programme through the Key Action: Strengthening the European Research Area, Research Infrastructures is acknowledged [Contract 226507 (NMI3)]. Kevin Pounot and Christian Beck thank the Federal Ministry of Education and Research (BMBF, grant number 05K19VTB) for funding of their postdoctoral fellowships.
Materials
| Name | Company | Catalog Number | Comments |
| Aluminum sample holder | Not commercially available. Either the local contact on the instrument can provide them or they can be manufactured based on a technical drawing that can be provided by the local contact. | ||
| Deuterium chloride, 35 wt. % in D2O, ≥99 atom % D | Sigma-Aldrich | 543047 | |
| Deuterium oxide (D, 99.9%) | Eurisotop | DLM-4DR-PK | |
| Dow Corning high-vacuum silicone grease | Sigma-Aldrich | Z273554-1EA | |
| Ethanol 96%, EMSURE Reag. Ph Eur | Sigma-Aldrich | 1.5901 | |
| Glass dessicator | VWR | 75871-660 | |
| Glass dessicator plate, 140 mm | VWR | 89038-068 | |
| Indium wire, 1.0 mm (0.04 in) dia, Puratronic, 99.999% | Alfa Aesar | 00470.G1 | |
| Lysozyme from chicken egg white dialyzed, lyophilized, powder, ~100,000 U/mg | Sigma-Aldrich | 62970 | |
| nPDyn | v3.x | see github.com/kpounot/nPDyn, model functions fot fitting also included in the software | |
| OHAUS AX324 Adventurer balance, internal calibration | Dutscher | 92641 | |
| Phosphorus pentoxide, ReagentPlus, 99% | Sigma-Aldrich | 214701 | |
| Pipette ErgoOne 0.5-10 μL | Starlab | S7100-0510 | |
| Pipette ErgoOne 100-1,000 μL | Starlab | S7100-1000 | |
| Pipette ErgoOne 20-200 μL | Starlab | S7100-2200 | |
| Pipette tip TipOne 1,000 μL | Starlab | S1111-6001 | |
| Pipette tip TipOne 10 μL | Starlab | S1111-3200 | |
| Pipette tip TipOne 200 μL | Starlab | S1111-0206 | |
| Sodium deuteroxide solution, 40 wt. % in D2O, 99.5 atom % D | Sigma-Aldrich | 372072 |
References
- Jacrot, B. Des neutrons pour la science: Histoire de l'Institut Laue-Langevin. Des neutrons pour la science. EDP Sciences. , (2021).
- Mahieu, E., Gabel, F. Biological small-angle neutron scattering: recent results and development. Acta Crystallographica Section D. 74 (8), 715-726 (2018).
- Grimaldo, M., Roosen-Runge, F., Zhang, F., Schreiber, F., Seydel, T. Dynamics of proteins in solution. Quarterly Reviews of Biophysics. 52, 7 (2019).
- Martel, A., et al. Membrane permeation versus amyloidogenicity: A multitechnique study of islet amyloid polypeptide interaction with model membranes. Journal of the American Chemical Society. 139 (1), 137-148 (2017).
- Pounot, K., et al. Tracking internal and global diffusive dynamics during protein aggregation by high-resolution neutron spectroscopy. The Journal of Physical Chemistry Letters. 11 (15), 6299-6304 (2020).
- Grimaldo, M., et al. Protein short-time diffusion in a naturally crowded environment. The Journal of Physical Chemistry Letters. 10 (8), 1709-1715 (2019).
- Jasnin, M., Stadler, A., Tehei, M., Zaccai, G. Specific cellular water dynamics observed in vivo by neutron scattering and NMR. Physical Chemistry Chemical Physics. 12 (35), 10154-10160 (2010).
- Frick, B. The neutron backscattering spectrometer IN16 at ILL-high energy resolution with high intensity and excellent signal-to-noise ratio. Neutron News. 13 (2), 15-22 (2002).
- Frick, B., Mamontov, E., van Eijck, L., Seydel, T. Recent backscattering instrument developments at the ILL and SNS. Zeitschrift für Physikalische Chemie. 224 (1-2), 33-60 (2010).
- Frick, B., Combet, J., van Eijck, L. New possibilities with inelastic fixed window scans and linear motor Doppler drives on high resolution neutron backscattering spectrometers. Nuclear Instruments and Methods in Physics Research Section A: Accelerators, Spectrometers, Detectors and Associated Equipment. 669, 7-13 (2012).
- Appel, M., Frick, B., Magerl, A. A flexible high speed pulse chopper system for an inverted neutron time-of-flight option on backscattering spectrometers. Scientific Reports. 8 (1), 13580 (2018).
- Squires, G. L. . Introduction to the theory of thermal neutron scattering. , (1996).
- Singwi, K. S., Sjölander, A. Diffusive motions in water and cold neutron scattering. Physical Review. 119 (3), 863-871 (1960).
- Sears, V. F. Theory of cold neutron scattering by homonuclear diatomic liquids: i. free rotation. Canadian Journal of Physics. 44 (6), 1279-1297 (1966).
- Sears, V. F. Theory of cold neutron scattering by homonuclear liquid: ii. hindered rotation. Canadian Journal of Physics. 44 (6), 1299-1311 (1966).
- Schirò, G., et al. Translational diffusion of hydration water correlates with functional motions in folded and intrinsically disordered proteins. Nature Communications. 6, 6490 (2015).
- Grimaldo, M., et al. Hierarchical molecular dynamics of bovine serum albumin in concentrated aqueous solution below and above thermal denaturation. Physical Chemistry Chemical Physics. 17 (6), 4645-4655 (2015).
- Eanes, E. D., Glenner, G. G. X-ray diffraction studies on amyloid filaments. Journal of Histochemistry & Cytochemistry. 16 (11), 673-677 (1968).
- Bonar, L., Cohen, A. S., Skinner, M. M. Characterization of the Amyloid Fibril as a Cross-β Protein. Proceedings of the Society for Experimental Biology and Medicine. 131 (4), 1373-1375 (1969).
- Chiti, F., Dobson, C. M. Protein Misfolding, Amyloid Formation, and Human Disease: A Summary of Progress Over the Last Decade. Annual Review of Biochemistry. 86 (1), 27-68 (2017).
- Knowles, T. P. J., Vendruscolo, M., Dobson, C. M. The amyloid state and its association with protein misfolding diseases. Nature Reviews Molecular Cell Biology. 15 (6), 384-396 (2014).
- Maji, S. K., et al. Functional amyloids as natural storage of peptide hormones in pituitary secretory granules. Science. 325 (5938), 328-332 (2009).
- Li, J., et al. The RIP1/RIP3 necrosome forms a functional amyloid signaling complex required for programmed necrosis. Cell. 150 (2), 339-350 (2012).
- Knowles, T. P. J., Mezzenga, R. Amyloid fibrils as building blocks for natural and artificial functional materials. Advanced Materials. 28 (31), 6546-6561 (2016).
- Stephens, A. D., Kaminski Schierle, G. S. The role of water in amyloid aggregation kinetics. Current Opinion in Structural Biology. 58, 115-123 (2019).
- Adamcik, J., Mezzenga, R. Amyloid polymorphism in the protein folding and aggregation energy landscape. Angewandte Chemie International Edition. 57 (28), 8370-8382 (2018).
- Liu, Z., et al. Entropic contribution to enhanced thermal stability in the thermostable P450 CYP119. Proceedings of the National Academy of Sciences of the United States of America. 115 (43), 10049-10058 (2018).
- Coquelle, N., et al. Chromophore twisting in the excited state of a photoswitchable fluorescent protein captured by time-resolved serial femtosecond crystallography. Nature Chemistry. 10 (1), 31-37 (2018).
- Henzler-Wildman, K. A., et al. A hierarchy of timescales in protein dynamics is linked to enzyme catalysis. Nature. 450 (7171), 913-916 (2007).
- Fichou, Y., et al. Hydration water mobility is enhanced around tau amyloid fibers. Proceedings of the National Academy of Sciences of the United States of America. 112 (20), 6365-6370 (2015).
- Burns, J., Pennock, C. A., Stoward, P. J. The specificity of the staining of amyloid deposits with thioflavine T. The Journal of Pathology and Bacteriology. 94 (2), 337-344 (1967).
- Iqbal, K., Liu, F., Gong, C. -. X., Grundke-Iqbal, I. Tau in Alzheimer disease and related tauopathies. Current Alzheimer Research. 7 (8), 656-664 (2010).
- Krȩżel, A., Bal, W. A formula for correlating pKa values determined in D2O and H2O. Journal of Inorganic Biochemistry. 98 (1), 161-166 (2004).
- Dolman, M., Halling, P. J., Moore, B. D., Waldron, S. How dry are anhydrous enzymes? Measurement of residual and buried 18O-labeled water molecules using mass spectrometry. Biopolymers. 41 (3), 313-321 (1997).
- Pounot, K. kpounotnPDyn: v3.0.0. Zenodo. , (2021).
- Yi, Z., Miao, Y., Baudry, J., Jain, N., Smith, J. C. Derivation of mean-square displacements for protein dynamics from elastic incoherent neutron scattering. Journal of Physical Chemistry B. 116 (16), 5028-5036 (2012).
- Peters, J., Kneller, G. R. Motional heterogeneity in human acetylcholinesterase revealed by a non-Gaussian model for elastic incoherent neutron scattering. The Journal of Chemical Physics. 139 (16), 165102 (2013).
- Zeller, D., Telling, M. T. F., Zamponi, M., García Sakai, V., Peters, J. Analysis of elastic incoherent neutron scattering data beyond the Gaussian approximation. The Journal of Chemical Physics. 149 (23), 234908 (2018).
- Roosen-Runge, F., Seydel, T. A generalized mean-squared displacement from inelastic fixed window scans of incoherent neutron scattering as a model-free indicator of anomalous diffusion confinement. EPJ Web of Conferences. 83, 02015 (2015).
- Ortega, A., Amorós, D., García de la Torre, J. Prediction of hydrodynamic and other solution properties of rigid proteins from atomic- and residue-level models. Biophysical Journal. 101 (4), 892-898 (2011).
- Hennig, M., Frick, B., Seydel, T. IUCr Optimum velocity of a phase-space transformer for cold-neutron backscattering spectroscopy. Journal of Applied Crystallography. 44 (3), 467-472 (2011).
- Paalman, H. H., Pings, C. J. Numerical evaluation of X-ray absorption factors for cylindrical samples and annular sample cells. Journal of Applied Physics. 33 (8), 2635-2639 (1962).
- Ow, S. -. Y., Dunstan, D. E. The effect of concentration, temperature and stirring on hen egg white lysozyme amyloid formation. Soft Matter. 9 (40), 9692-9701 (2013).
- Tominaga, T., Sahara, M., Kawakita, Y., Nakagawa, H., Yamada, T. Evaluation of sample cell materials for aqueous solutions used in quasi-elastic neutron scattering measurements. Journal of Applied Crystallography. 54 (6), 1631-1640 (2021).
- Beck, C., et al. Following protein dynamics in real time during crystallization. Crystal Growth & Design. 19 (12), 7036-7045 (2019).
- Smith, A. A., Testori, E., Cadalbert, R., Meier, B. H., Ernst, M. Characterization of fibril dynamics on three timescales by solid-state NMR. Journal of Biomolecular NMR. 65 (3-4), 171-191 (2016).
- Wang, T., Jo, H., DeGrado, W. F., Hong, M. Water distribution, dynamics, and interactions with Alzheimer's β-amyloid fibrils investigated by solid-state NMR. Journal of the American Chemical Society. 139 (17), 6242-6252 (2017).
- Rezaei-Ghaleh, N., Giller, K., Becker, S., Zweckstetter, M. Effect of zinc dinding on β-amyloid structure and dynamics: Implications for Aβ aggregation. Biophysical Journal. 101 (5), 1202-1211 (2011).
- Vugmeyster, L., et al. Fast motions of key methyl groups in amyloid-β fibrils. Biophysical Journal. 111 (10), 2135-2148 (2016).
- Yang, X., Wang, B., Hoop, C. L., Williams, J. K., Baum, J. NMR unveils an N-terminal interaction interface on acetylated-α-synuclein monomers for recruitment to fibrils. Proceedings of the National Academy of Sciences of the United States of America. 118 (18), (2021).
- Tuttle, M. D., et al. Solid-state NMR structure of a pathogenic fibril of full-length human α-synuclein. Nature Structural & Molecular Biology. 23 (5), 409-415 (2016).
- Karamanos, T. K., Kalverda, A. P., Thompson, G. S., Radford, S. E. Mechanisms of amyloid formation revealed by solution NMR. Progress in Nuclear Magnetic Resonance Spectroscopy. 88-89, 86-104 (2015).
- Lai, Y. -. C., Kuo, Y. -. H., Chiang, Y. -. W. Identifying protein conformational dynamics using spin-label ESR. Chemistry - An Asian Journal. 14 (22), 3981-3991 (2019).
- Franck, J. M., Han, S. Overhauser dynamic nuclear polarization for the study of hydration dynamics, explained. Methods in Enzymology. 615, 131-175 (2019).
- Pavlova, A., et al. Protein structural and surface water rearrangement constitute major events in the earliest aggregation stages of tau. Proceedings of the National Academy of Sciences of the United States of America. 113 (2), 127-136 (2016).
- Lin, Y., et al. Liquid-liquid phase separation of tau driven by hydrophobic interaction facilitates fibrillization of tau. bioRxiv. , (2020).
- Decatur, S. M. Elucidation of residue-level structure and dynamics of polypeptides via isotope-edited infrared spectroscopy. Accounts of Chemical Research. 39 (3), 169-175 (2006).
- Chatani, E., Tsuchisaka, Y., Masuda, Y., Water Tsenkova, R. molecular system dynamics associated with amyloidogenic nucleation as revealed by real time near infrared spectroscopy and aquaphotomics. PLoS One. 9 (7), 101997 (2014).
- Goret, G., Aoun, B., Pellegrini, E. MDANSE: An interactive analysis environment for molecular dynamics simulations. Journal of Chemical Information and Modeling. 57 (1), 1-5 (2017).
- Fujiwara, S., et al. Internal dynamics of a protein that forms the amyloid fibrils observed by neutron scattering. Journal of the Physical Society of Japan. 82, (2013).
- Schiró, G., et al. Neutron scattering reveals enhanced protein dynamics in concanavalin a amyloid fibrils. Journal of Physical Chemistry Letters. 3 (8), 992-996 (2012).
- Pounot, K., et al. Zinc determines dynamical properties and aggregation kinetics of human insulin. Biophysical Journal. 120 (5), 886-898 (2021).
- Fujiwara, S., et al. Dynamic properties of human α-synuclein related to propensity to amyloid fibril formation. Journal of Molecular Biology. 431 (17), 3229-3245 (2019).
- Sanz, A., et al. High-pressure cell for simultaneous dielectric and neutron spectroscopy. Review of Scientific Instruments. 89 (2), 023904 (2018).
- Adams, M. A., et al. Simultaneous neutron scattering and Raman scattering. Applied Spectroscopy. 63 (7), 727-732 (2009).
Reprints and Permissions
Request permission to reuse the text or figures of this JoVE article
Request PermissionThis article has been published
Video Coming Soon
Copyright © 2025 MyJoVE Corporation. All rights reserved