Method Article
Optical Trapping of Plasmonic Nanoparticles for In Situ Surface-Enhanced Raman Spectroscopy Characterizations
In This Article
Summary
The present protocol describes a convenient approach to integrating optical trapping and surface-enhanced Raman spectroscopy (SERS) to manipulate plasmonic nanoparticles for sensitive molecular detection. Without aggregating agents, the trapping laser assembles plasmonic nanoparticles to enhance the SERS signals of target analytes for in situ spectroscopic measurements.
Abstract
Surface-enhanced Raman spectroscopy (SERS) enables the ultrasensitive detection of analyte molecules in various applications due to the enhanced electric field of metallic nanostructures. Salt-induced silver nanoparticle aggregation is the most popular method for generating SERS-active substrates; however, it is limited by poor reproducibility, stability, and biocompatibility. The present protocol integrates optical manipulation and SERS detection to develop an efficient analytical platform to address this. A 1064 nm trapping laser and a 532 nm Raman probe laser are combined in a microscope to assemble silver nanoparticles, which generate plasmonic hotspots for in situ SERS measurements in aqueous environments. Without aggregating agents, this dynamic plasmonic silver nanoparticle assembly enables an approximately 50-fold enhancement of the analyte molecule signal. Moreover, it provides spatial and temporal control to form the SERS-active assembly in as low as 0.05 nM analyte-coated silver nanoparticle solution, which minimizes the potential perturbation for in vivo analysis. Hence, this optical trapping-integrated SERS platform holds great potential for efficient, reproducible, and stable molecular analyses in liquids, especially in aqueous physiological environments.
Introduction
Surface-enhanced Raman spectroscopy (SERS) is a sensitive analytical technique for directly detecting the chemical structure of target molecules at ultralow concentrations or even at the single-molecule level1,2,3,4. Laser irradiation induces localized surface plasmon resonance in metallic nanostructures, used as SERS substrates to amplify the Raman signals of target molecules. Salt-induced nanoparticle aggregates are the widely used SERS substrates, which spontaneously undergo Brownian motion in colloidal suspension liquids5,6. Further drying allows stable SERS measurements; however, impurity concentration may occur, which introduces background noise and causes irreversible damage to biological samples7. Hence, it is pertinent to develop salt-free nanoparticle aggregations, control their movement in solution, and improve biocompatibility while maintaining measurement efficiency.
Optical trapping has been adopted to control various metallic substrates and facilitate SERS detections8,9,10,11,12,13,14. An optical trap is generated by tightly focusing a laser beam to generate an optical force field, which attracts small objects to the highest-intensity region around the focus15,16. Recently, optical traps have been used to develop reproducible and sensitive plasmonic sensing platforms for various applications, displaying their unique advantages in locating and controlling the position of SERS-active metallic nanostructures in solutions17,18,19,20,21,22,23,24. The present protocol introduces an approach to combine optical tweezers and Raman spectro-microscopy to dynamically assemble silver nanoparticles (AgNPs) and stabilize them against Brownian motion in solution for efficient SERS measurements. In the AgNP assembly region, the signal of the 3,3'-dithiobis[6-nitrobenzoic acid] bis(succinimide) ester (DSNB), analyte molecules coated on the surface of AgNPs, can be enhanced by approximately 50 folds. This approach is suitable for analyzing sensitive biomolecules incompatible with chemical capping agents25,26,27. Moreover, it provides spatial and temporal control to generate the SERS-active AgNP assembly. This enables in situ detection in aqueous environments, which could lower the usage of AgNPs and minimize perturbation for in vivo analysis28,29,30. In addition, the optical trapping-induced AgNP assembly is stable, reproducible, and reversible31,32. Hence, it is a promising platform for detecting analyte molecules in solutions and under physiological conditions where salt-induced aggregation is not applicable.
In the present study, a 1064 nm trapping laser, force detection module, and brightfield illumination source are integrated into the optical tweezer microscopy system for optical manipulation and visualization of particles. A 532 nm Raman probe laser was also incorporated into the microscope and aligned with the trapping laser in the sample chamber. For spectral acquisition, backscattered light was collected and redirected into a spectrometer (Figure 1).
Protocol
1. Optical setup
- Direct a 532 nm laser beam (Raman excitation source) into the flex port of the optical tweezer microscope (see Table of Materials).
- Align the 532 nm laser beam into the stereo double-layer pathways of the optical tweezer microscope with a 750 nm long-pass dichroic mirror to combine with the original trapping laser beams to focus on the sample chamber.
- Collect the backscattered light from the sample chamber using a 750 nm long-pass dichroic mirror and redirect it into a spectrometer containing a liquid-nitrogen-cooled charge-coupled device (CCD) camera (see Table of Materials). Place a 532 nm notch filter in front of the entrance slit of the spectrometer before spectral acquisition.
NOTE: Eye protection must be used when the laser is turned on, and the laser beam must be contained within a safe area.
2. Fabrication of AgNPs
- Heat 50 mL of 1 mM AgNO3 aqueous solution in a round-bottomed flask while boiling.
- Add 1.0 mL of 0.1 M trisodium citrate solution dropwise into the boiled AgNO3 aqueous solution.
- Keep the mixture boiling for 16 min under constant stirring.
- Cool the mixture to room temperature. Yellowish color is observed.
- Centrifuge the AgNP colloids at 2000 × g for 5 min at room temperature and then remove the supernatant using a pipette.
- Resuspend the AgNP colloids with 1 mL of de-ionized water (resistivity of 18.2 MΩ cm).
- Repeat steps 2.5 and 2.6 thrice to remove the residual reducing agent.
- Characterize the size distribution of the AgNPs using scanning electron microscopy (SEM) and dynamic light scattering (DLS)33 to confirm the uniformity of the AgNPs (Figure 2). The AgNP concentration was estimated as 0.1 nM by UV absorbance34.
NOTES: Due to the low concentration, the AgNP stock solution can be maintained without clustering for 2-3 weeks. No stabilizing agents are required. If a precipitate was observed in the AgNP stock solution, a new AgNP solution was prepared following the above protocol.
3. Interaction of the DSNB analyte molecule and AgNP
- Add 200 µL of 2 mM DSNB (see Table of Materials) to 1 mL of AgNP colloid and incubate at room temperature for 3 h to coat a layer of DSNB on the surface of AgNP by the formation of the Ag-S bond between AgNP and DSNB35. A schematic representation of this interaction is shown in Figure 3.
- Centrifuge the AgNP at 2,000 × g for 5 min at room temperature and remove the supernatant.
- Resuspend the AgNP-DSNB with 1 mL of de-ionized water.
- Repeat steps 3.2 and 3.3 thrice to remove excess DSNB.
- Record the UV-visible spectra of the AgNP colloid and AgNP-DSNB solution.
NOTE: This spectra show an absorption peak shift from approximately 420 nm to 450 nm, indicating the successful coating of DSNB on the surface of AgNP (Figure 3).
4. Preparation of sample chamber and generation of AgNP assembly for SERS measurement
- Clean the glass slide and coverslip with water and ethanol.
- Attach the frame tape (0.25 mm thickness, see Table of Materials) to the glass slide to create a chamber (1.0 cm length × 1.0 cm width × 0.25 mm height).
- Add a few drops of the AgNP-DSNB solution (around 25 µL) into the frame.
- Put the coverslip on the frame tape and seal it (Figure 4).
- Add liquid nitrogen to the container of the liquid nitrogen-cooled CCD camera until the temperature reaches -120 °C.
- Block the Raman probe beam path using a magnetic laser safety screen (see Table of Materials), then turn on the 532 nm Raman excitation source laser.
- Fix the sample chamber with the AgNP-DSNB solution on the chamber holder. Add water to the water-immersed objective (60x magnification with a 1.2 numerical aperture A of 1.2) as shown in Figure 1. Then place the chamber holder immediately onto the microstage above the objective.
- Drop immersion oil on top of the coverslip and position the oil-immersed condenser to visualize particles on the microscope camera.
- Adjust the Z position of the objective by turning the knob of the microscope until the 532 nm Raman probe beam is focused on the bottom glass surface of the chamber, showing a white spot on the microscope camera (Figure 5).
- Adjust the X- and Y-positions of the microstage to move the chamber to place the central region of the chamber at the white spot. Open the optical tweezer control software (see Table of Materials) and use the equipped joystick control to move the 1064 nm trapping laser (indicated by a red circle in the optical tweezer system) to overlap with the white spot (Figure 5).
- Next, tune the knob of the microscope to move the Z position of the objective up.
NOTE: The disappearance of the white spot in the microscope camera image indicates that the 532 nm Raman probe beam is focused inside the chamber.
- Turn on the 1064 nm trapping laser to attract AgNPs in the sample chamber and create a plasmonic AgNP assembly.
NOTE: The gathering of AgNPs results in a dark spot in the sample chamber (Figure 6B).- Turn down the trapping laser beam to avoid overheating or bubble formation when required.
NOTE: Increase the trapping laser power and irradiation time if there is no apparent formation of the AgNP assembly.
- Turn down the trapping laser beam to avoid overheating or bubble formation when required.
- Adjust the position of the sample microstage to place the dark spot of the plasmonic AgNP assembly under the focus of the 532 nm Raman probe beam for spectroscopic measurements.
- Place the neutral-density (ND) filters in front of the 532 nm Raman laser outlet to adjust the power to 10 mW. Input the acquisition time (10 s for the present study, Figure 6) in the setting panel in the spectrum software (see Table of Materials) and click on the Acquire button to start the spectral acquisition.
NOTE: This generates the SERS spectrum of the analyte molecules (DSNB in the representative result and Figure 6).
Results
As proof of concept, DSNB was chosen as the analyte molecule and coated onto the surface of AgNPs. The typical SERS spectra of DSNB enhanced by the plasmonic AgNP assembly and dispersed AgNP are shown in Figure 6. Without the trapping laser, the dispersed AgNPs in the sample chamber generated a black spectrum (Figure 6A) upon excitation by the Raman probe laser. A weak and broad SERS signal was observed at approximately 1380-1450 cm-1, the characteristic peak of DSNB from its symmetric NO2 stretch, which is consistent with literature reports35,36. Since the dispersed AgNPs were under Brownian motion, the interparticle junctions were large and unstable, as illustrated in Figure 6C. Thus, the SERS signal amplification of DSNB was low for the dispersed AgNPs.
AgNPs are gathered to form a plasmonic AgNP assembly when the trapping laser is on. Increasing the power and extending the irradiation time of the trapping laser could attract more AgNPs and generate a dark spot, as shown in Figure 6B. Here, we applied a trapping laser power of 700 mM and a 20 s irradiation time to create a plasmonic AgNP assembly in a 0.05 nM DSNB-coated AgNP solution at a designated location and moment. The SERS spectrum of DSNB was obtained in the region of the plasmonic AgNP assembly (Figure 6A, red). The strong Raman band at 930 cm-1 is assigned to the nitro scissoring vibration, and the large bands at 1078 cm-1, 1152 cm-1, and 1191 cm-1 likely correspond to the succinimidyl N-C-O stretch overlapping with the aromatic ring modes of DSNB35,37. The feature bands at 1385 cm-1 and 1444 cm-1 arise from the symmetric nitro stretch of DSNB and are significantly enhanced and slightly shifted due to the reaction with the surface of AgNP35,37. Based on the previously reported SERS fingerprints of DSNB35,36,37, the band at 1579 cm-1 was assigned to the aromatic ring mode of DSNB. The overall intensities of DSNB in the plasmonic AgNP assembly were higher than those of the dispersed AgNP. Considering the intensity of the characteristic peak at 1444 cm-1, the plasmonic AgNP assembly can provide approximately a 50-fold enhancement of the SERS signal of DSNB compared to that of the dispersed AgNP. As shown in Figure 7, SERS spectra of DSNB were recorded repeatedly (20 times) for the AgNP assembly in the experiment, demonstrating identical vibrational features. The intensities of the characteristic peaks of DSNB at 1152 cm−1, 1444 cm−1, and 1579 cm−1 across these 20 SERS spectra were plotted as histograms with relative standard deviations (RSD) of 6.88%, 6.59%, and 5.48%, respectively. This further verified the reproducibility and stability. Hence, this approach is reliable for manipulating plasmonic nanoparticles and SERS detection of analyte molecules in solution.
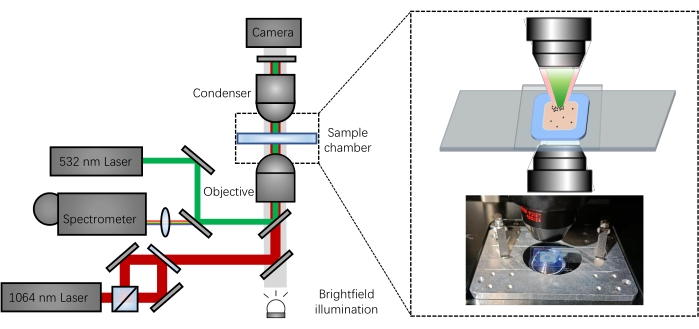
Figure 1: Schematic representation of the optical tweezer-coupled Raman spectroscopic platform. Please click here to view a larger version of this figure.
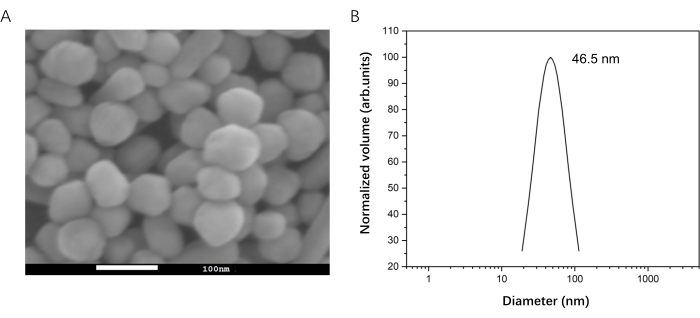
Figure 2: Preparation of AgNP for SERS measurement. (A) SEM image of AgNP. (B) Size distribution of AgNP by DLS. Please click here to view a larger version of this figure.

Figure 3: Interaction of AgNP and DSNB. (A) Schematic of the coating of DSNB on the surface of AgNP. (B) UV-visible spectra of AgNP and AgNP-DSNB. Please click here to view a larger version of this figure.
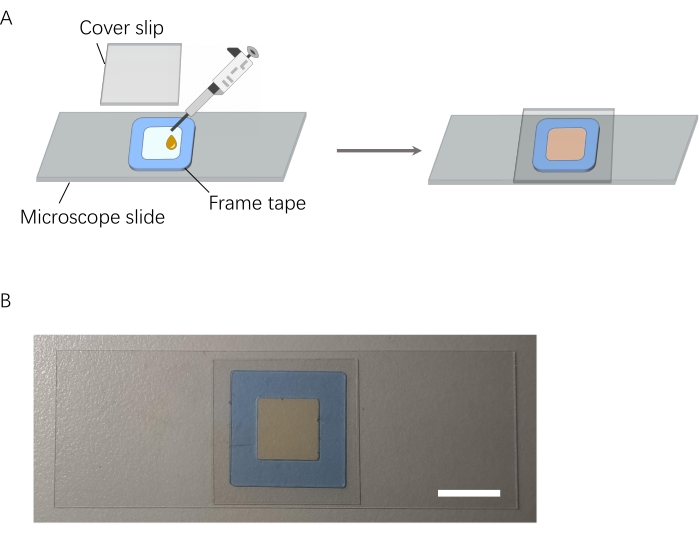
Figure 4: Schematic of sample chamber preparation. (A) Sample chamber preparation process. (B) Prepared sample chamber. Scale bar = 1 cm. Please click here to view a larger version of this figure.
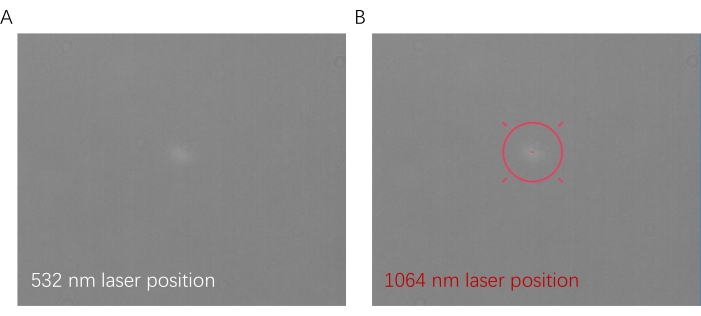
Figure 5: Position overlapping of 532 nm Raman laser and 1064 nm trapping laser. (A) Position of 532 nm Raman laser indicated by white spot. (B) Position of 1064 nm trapping laser indicated by red circle. Please click here to view a larger version of this figure.
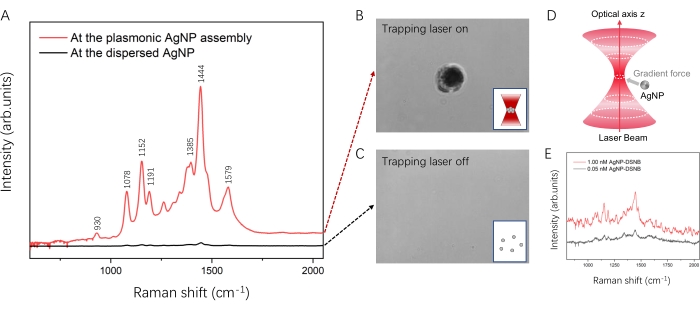
Figure 6: Typical SERS spectra of the analyte molecules enhanced by the plasmonic AgNP assembly. (A) SERS spectra of DSNB at the plasmonic AgNP assembly (red) and the dispersed AgNP (black). (B) The plasmonic AgNP assembly when the trapping laser is on shows a dark spot under microscopic visualization. (C) The dispersed AgNP when the trapping laser is off. (D) Illustration of the mechanism of AgNP assembly formation. (E) Concentration-dependent SERS intensity in the absence of the trapping laser. Please click here to view a larger version of this figure.
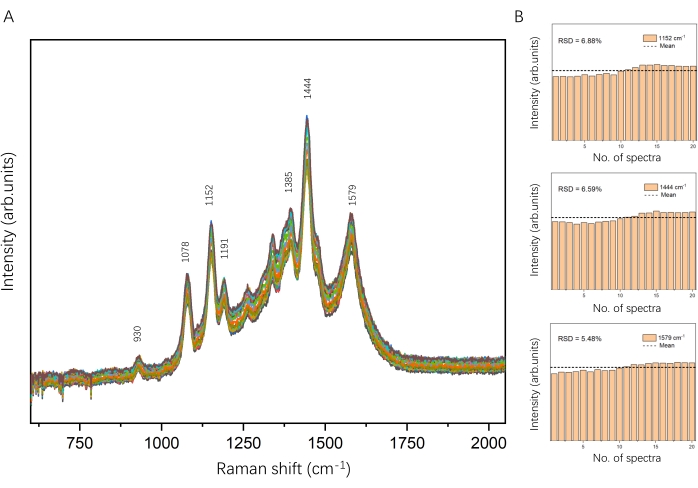
Figure 7: Reproducibility of SERS signal of DSNB. (A) 20 SERS spectra of DSNB at the plasmonic AgNP assembly recorded repeatly in the experiment. (B) Histograms of the intensities of the characteristic DSNB peaks at 1152 cm-1 (RSD = 6.88%), 1444 cm-1 (RSD = 6.59%), and 1579 cm-1 (RSD = 5.48%). Please click here to view a larger version of this figure.
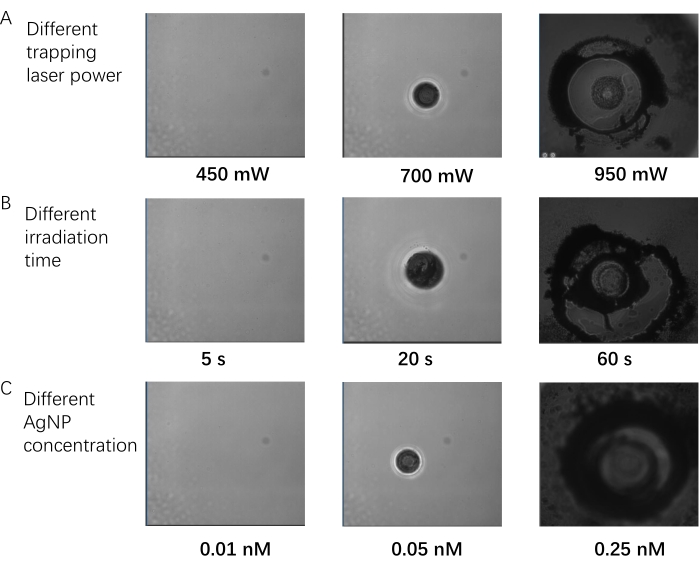
Figure 8: AgNP assembly generated under different experimental parameters. (A) Different trapping laser power; irradiation time 20 s and AgNP concentration 0.05 nM. (B) Different irradiation time; trapping laser power 700 mW and AgNP concentration 0.05 nM. (C) Different AgNP concentration; irradiation time 20 s and trapping laser power 700 mW. Please click here to view a larger version of this figure.
Supplementary Figure 1: The microscope camera images of AgNP assembly in time series when the trapping laser was turned off. Please click here to download this File.
Discussion
The present study reports an analytical platform that combines optical trapping and SERS detection for in situ molecular characterizations. A 532 nm Raman probe beam was combined with a 1064 nm trapping laser beam through stereo double-layer pathways to combine focus and collect for additional spectroscopic measurements in backscattering geometry. The trapping laser beam assembled AgNPs to form plasmonic hotspots, followed by excitation of the Raman probe laser beam to generate the SERS signal of the analyte molecules in solution. As a proof of concept, the detection of DSNB was demonstrated, which was coated on the surface of AgNPs. In the AgNP assembly region controlled by the trapping laser beam, an approximately 50-fold enhancement in the signal of DSNB compared to the surrounding dispersed AgNPs, was achieved. A similar high-signal amplification of analyte molecules in the solution-phase SERS measurements on the presented platform was reproducibly obtained.
The critical step affecting SERS signal amplification is forming an optical trapping-induced AgNP assembly. The SERS signal of the analyte molecules can be optimized by fine-tuning experimental parameters such as the trapping laser power, irradiation time, and AgNP concentration. As shown in Figure 8, using a higher trapping laser power can increase the efficiency of AgNP assembly formation. Reproducible AgNP assemblies were obtained by increasing the power of the trapping laser from 450 mW to 700 mW. However, a trapping laser power higher than 950 mW may induce overheating and bubble generation38. Thus, moderate trapping laser power is recommended to create a dynamic AgNP assembly. Analogously, a longer irradiation time is useful for promoting the formation of AgNP assemblies. Figure 8B shows that a clear spherical AgNP assembly was formed when the irradiation time increased from 5-20 s. However, the AgNP assembly was distorted after 60 s irradiation. In addition, the formation of the AgNP assembly was accelerated at a higher AgNP concentration, from 0.01 nM to 0.05 nM, while it was quickly overheated at 0.25 nM, as shown in Figure 8C. If there is no apparent AgNP assembly formation, increasing the trapping laser power and the irradiation time is recommended. Upon generation of a stable AgNP assembly, the trapping laser must be turned down to avoid potential thermal damage.
The SERS activity of the optical trapping-induced AgNP assembly was attributed to an increase in the local AgNP concentration in the trapping laser irradiation region, which is the dark spot in Figure 6B. In the fluidic AgNP solution, the optical trap can continuously attract AgNPs to accumulate and form plasmonic hotspots in a confined space in the interparticle junctions. This yields an enhanced electric field which enhances the SERS effect. It was further verified by the stronger SERS signal obtained at a higher AgNP concentration (1.00 nM) compared to the weaker SERS signal acquired at a lower AgNP concentration (0.05 nM) without the trapping laser, as shown in Figure 6E.
Furthermore, position control of the plasmonic AgNP assembly in solution, against Brownian motion, by optical trapping has significantly improved the efficiency and stability of SERS measurements. High-throughput sensing can be conducted when connected to the microfluidic system. Compared to the traditional salt-induced aggregation of nanoparticles to generate SERS-active substrates, our platform allows the dynamic formation of plasmonic AgNP assemblies, at the designed location and moment, with high flexibility26,28. Moreover, it works efficiently at nanomolar AgNP concentrations and enables the spatial-temporal manipulation of SERS-active hotspots for in situ spectroscopic measurements in solutions. This dynamic AgNP assembly gradually disassembled in a few minutes when the trapping laser was turned off. Without the trapping laser, the AgNP assembly almost disappeared in 20 min, as shown in Supplementary Figure 1. This can minimize the influence on the detection system and exhibits great potential for various bio-applications, especially the detection of biomolecules (DNA, RNA, and protein) under physiological and in vivo conditions. However, this dynamic AgNP assembly provides a smaller enhancement factor than salt-induced AgNP aggregates2, and hence, further modification and development are required.
In conclusion, the integration of optical trapping and SERS detection provides a convenient method to control plasmonic nanoparticles and achieve reproducible SERS signal enhancement to detect analyte molecules in solutions with high efficiency, stability, and biocompatibility.
Disclosures
The authors have nothing to disclose.
Acknowledgements
We acknowledge the funding support from the Science, Technology, and Innovation Commission of Shenzhen Municipality (No. JCYJ20180306174930894), Zhongshan Municipal Bureau of Science and Technology (2020AG003), and Research Grant Council of Hong Kong (Project 26303018). We also acknowledge Prof. Chi-Ming Che and his funding support from "Laboratory for Synthetic Chemistry and Chemical Biology" under the Health@InnoHK Program launched by Innovation and Technology Commission, The Government of Hong Kong Special Administrative Region of the People's Republic of China.
Materials
| Name | Company | Catalog Number | Comments |
| 1064 nm trapping laser | IPG Photonics, United States | 1064 nm CW Yb fiber laser, 10W | |
| 3,3'-Dithiobis[6-nitrobenzoic acid] bis(succinimide) ester | Biosynth Carbosynth | FD15467 | |
| 532 nm Raman excitation source | CNI, China | MLL-III-532 | |
| Bluelake software | LUMICKS, Netherlands | version 1.6.12 | optical tweezer control software |
| Frame tape | Thermo Fisher Scientific, Inc | AB-0576 | |
| Immersion oil | Cargille Laboratories, Inc | 16482 | |
| Liquid nitrogen-cooled charge-coupled device (CCD) camera | Teledyn Princeton Instrument, United States | 400B eXcelon | |
| Long-pass dichroic mirror | AHF, Germany | F48-801 | |
| Magnetic laser safety screen | ThorLabs | TPSM2 | |
| Optical tweezer microscope | LUMICKS, Netherlands | m-trap | |
| Silver nitrate | Sigma-Aldrich China, Inc. | S8157 | |
| Spectrometer | Teledyn Princeton Instrument, United States | IsoPlane SCT-320 | |
| Trisodium citrate | Sigma-Aldrich China, Inc. | S4641 | |
| WinSpec software | Teledyn Princeton Instrument, United States | version 2.6.24.0 | spectrum software |
References
- Stiles, P. L., Dieringer, J. A., Shah, N. C., Van Duyne, R. P. Surface-enhanced Raman spectroscopy. Annual Review of Analytical Chemistry. 1 (1), 601-626 (2008).
- Xu, L. J., et al. Label-free detection of native proteins by surface-enhanced Raman spectroscopy using iodide-modified nanoparticles. Analytical Chemistry. 86 (4), 2238-2245 (2014).
- Le Ru, E. C., Etchegoin, P. G. Single-molecule surface-enhanced raman spectroscopy. Annual Review of Physical Chemistry. 63, 65-87 (2012).
- Huang, J. A., et al. SERS discrimination of single DNA bases in single oligonucleotides by electro-plasmonic trapping. Nature Communications. 10 (1), 1-10 (2019).
- Chan, M. Y., Leng, W., Vikesland, P. J. Surface-enhanced Raman spectroscopy characterization of salt-induced aggregation of gold nanoparticles. ChemPhysChem. 19 (1), 24-28 (2018).
- Le Ru, E. C., Meyer, M., Etchegoin, P. G. Proof of single-molecule sensitivity in Surface Enhanced Raman Scattering (SERS) by means of a two-analyte technique. Journal of Physical Chemistry B. 110 (4), 1944-1948 (2006).
- Schultz, Z. Not too hot: the importance of optimizing laser power for surface-enhanced Raman spectroscopy (SERS) measurements. Spectroscopy. 36 (8), 18-20 (2021).
- Svedberg, F., Käll, M. On the importance of optical forces in surface-enhanced Raman scattering (SERS). Faraday Discussions. 132, 35-44 (2006).
- Svedberg, F., Li, Z., Xu, H., Käll, M. Creating hot nanoparticle pairs for surface-enhanced Raman spectroscopy through optical manipulation. Nano Letters. 6 (12), 2639-2641 (2006).
- Liu, Z., Hung, W. H., Aykol, M., Valley, D., Cronin, S. B. Optical manipulation of plasmonic nanoparticles, bubble formation and patterning of SERS aggregates. Nanotechnology. 21 (10), 105304 (2010).
- Spadaro, D., et al. Optical trapping of plasmonic mesocapsules: Enhanced optical forces and SERS. Journal of Physical Chemistry C. 121 (1), 691-700 (2017).
- Ottevaere, H., et al. Optical trapping of particles combined with confocal Raman spectroscopy in an optofluidic chip. Optical Design and Fabrication 2017. , (2017).
- Koya, A. N., et al. Novel plasmonic nanocavities for optical trapping-assisted biosensing applications. Advanced Optical Materials. 8 (7), 1901481 (2020).
- Yuan, Y., et al. Optical trapping-assisted SERS platform for chemical and biosensing applications: Design perspectives. Coordination Chemistry Reviews. 339, 138-152 (2017).
- Ashkin, A., Dziedzic, J. M., Yamane, T. Optical trapping and manipulation of single cells using infrared laser beams. Nature. 330 (6150), 769-771 (1987).
- Ashkin, A. Optical trapping and manipulation of neutral particles using lasers. Proceedings of the National Academy of Sciences. 94 (10), 4853-4860 (1997).
- Dang, H., et al. Reproducible and sensitive plasmonic sensing platforms based on Au-nanoparticle-internalized nanodimpled substrates. Advanced Functional Materials. 31 (49), 1-10 (2021).
- Lafuente, M., et al. Plasmonic MOF thin films with Raman internal standard for fast and ultrasensitive SERS detection of chemical warfare agents in ambient air. ACS Sensors. 6 (6), 2241-2251 (2021).
- Chen, H., et al. SERS imaging-based aptasensor for ultrasensitive and reproducible detection of influenza virus A. Biosensors and Bioelectronics. 167, 112496 (2020).
- Chen, L., et al. Label-free plasmonic assisted optical trapping of single DNA molecules. Optics Letters. 46 (6), 1482 (2021).
- Farid, S., et al. Rainbows at the end of subwavelength discontinuities: plasmonic light trapping for sensing applications. Advanced Optical Materials. 9 (24), 1-18 (2021).
- Lin, S., et al. Tetragonal superlattice of elongated rhombic dodecahedra for sensitive SERS determination of pesticide residues in fruit. ACS Applied Materials and Interfaces. 12 (50), 56350-56360 (2020).
- Tiwari, S., Khandelwal, U., Sharma, V., Kumar, G. V. P. Single molecule surface enhanced Raman scattering in a single gold nanoparticle-driven thermoplasmonic tweezer. Journal of Physical Chemistry Letters. 12 (49), 11910-11918 (2021).
- Fukushima, T., et al. Visualization of molecular trapping at plasmonic metal nanostructure by surface-enhanced Raman scattering imaging. Journal of Nanophotonics. 14 (2), 1 (2020).
- Yuan, Y., et al. Optical trapping-assisted SERS platform for chemical and biosensing applications: Design perspectives. Coordination Chemistry Reviews. 339, 138-152 (2017).
- Foti, A., et al. Optical aggregation of gold nanoparticles for SERS detection of proteins and toxins in liquid environment: towards ultrasensitive and selective detection. Materials. 11 (3), 440 (2018).
- Dinish, U. S., et al. Single molecule with dual function on nanogold: Biofunctionalized construct for in vivo photoacoustic imaging and SERS biosensing. Advanced Functional Materials. 25 (15), 2316-2325 (2015).
- Tong, L., Righini, M., Gonzalez, M. U., Quidant, R., Käll, M. Optical aggregation of metal nanoparticles in a microfluidic channel for surface-enhanced Raman scattering analysis. Lab on a Chip. 9 (2), 193-195 (2009).
- Messina, E., et al. Plasmon-enhanced optical trapping of gold nanoaggregates with selected optical properties. ACS Nano. 5 (2), 905-913 (2011).
- Hwang, H., et al. In situ dynamic measurements of the enhanced SERS signal using an optoelectrofluidic SERS platform. Lab on a Chip. 11 (15), 2518-2525 (2011).
- Fazio, B., et al. SERS detection of biomolecules at physiological pH via aggregation of gold nanorods mediated by optical forces and plasmonic heating. Scientific Reports. 6 (1), 26952 (2016).
- Schlücker, S. Surface-enhanced raman spectroscopy: Concepts and chemical applications. Angewandte Chemie - International Edition. 53 (19), 4756-4795 (2014).
- Verma, P., Maheshwari, S. K. Preparation of sliver and selenium nanoparticles and its characterization by dynamic light scattering and scanning electron microscopy. Journal of microscopy and ultrastructure. 6 (4), 182-187 (2018).
- Paramelle, D., et al. A rapid method to estimate the concentration of citrate capped silver nanoparticles from UV-visible light spectra. Analyst. 139 (19), 4855-4861 (2014).
- Zhang, Y., et al. Facile SERS-active chip (PS@Ag/SiO2/Ag) for the determination of HCC biomarker. Sensors and Actuators B: Chemical. 272, 34-42 (2018).
- Cheng, M., et al. SERS immunosensor of array units surrounded by particles: A platform for auxiliary diagnosis of hepatocellular carcinoma. Nanomaterials. 10 (10), 1-11 (2020).
- Grubisha, D. S., Lipert, R. J., Park, H. -. Y., Driskell, J., Porter, M. D. Femtomolar detection of prostate-specific antigen: an immunoassay based on surface-enhanced raman scattering and immunogold labels. Analytical Chemistry. 75 (21), 5936-5943 (2003).
- Wang, S., Fu, L., Zhang, Y., Wang, J., Zhang, Z. Quantitative evaluation and optimization of photothermal bubble generation around overheated nanoparticles excited by pulsed lasers. Journal of Physical Chemistry C. 122 (42), 24421-24435 (2018).
Reprints and Permissions
Request permission to reuse the text or figures of this JoVE article
Request PermissionExplore More Articles
This article has been published
Video Coming Soon
Copyright © 2025 MyJoVE Corporation. All rights reserved