Sign In

Bacterial Growth Curve Analysis and its Environmental Applications

Overview

Source: Laboratories of Dr. Ian Pepper and Dr. Charles Gerba - The University of Arizona
Demonstrating Author: Luisa Ikner

Bacteria are among the most abundant life forms on Earth. They are found in every ecosystem and are vital for everyday life. For example, bacteria affect what people eat, drink, and breathe, and there are actually more bacterial cells within a person’s body than mammalian cells. Because of the importance of bacteria, it is preferable to study particular species of bacteria in the laboratory. To do this, bacteria are grown under controlled conditions in pure culture, meaning that only one type of bacterium is under consideration. Bacteria grow quickly in pure culture, and cell numbers increase dramatically in a short period of time. By measuring the rate of cell population increase over time, a “growth curve” to be developed. This is important when aiming to utilize or inoculate known numbers of the bacterial isolate, for example to enhance plant growth, increase biodegradation of toxic organics, or produce antibiotics or other natural products at an industrial scale.

Principles

Bacterial reproduction occurs via binary fission, in which one bacterial cell divides and becomes two cells (Figure 1). The time needed for cell division is known as the mean generation time, or doubling time, which is the time needed for the number of cells to double.

Figure 1
Figure 1. Exponential cell division. Each cell division results in a doubling of the cell number. At low cell numbers, the increase is not very large; however after a few generations, cell numbers increase explosively. After n divisions, there are 2n cells.

To understand and define the growth of particular microorganisms, they are placed in a flask, where the nutrient supply and environmental conditions are controlled. If the liquid medium supplies all the nutrients required for growth and environmental parameters conducive to growth, the increase in numbers can be measured as a function of time to obtain a growth curve. Several distinct growth phases can be observed within a growth curve (Figure 2). These include the lag phase, the exponential or log phase, the stationary phase, and the death phase, each of which are associated with specific physiological changes (Table 1).

Phase Characteristics
Lag Phase Slow growth or lack of growth due to physiological adaptation of cells to culture conditions or dilution of exoenzymes due to initial low cell densities.
Exponential or Log Phase Optimal growth rates, during which cell numbers double at discrete time intervals known as the mean generation time.
Stationary Phase Growth (cell division) and death of cells counterbalance each other resulting in no net increase in cell numbers. The reduced growth rate is usually due to a lack of nutrients and/or a buildup of toxic waste constituents.
Death Phase Death rate exceeds growth rate resulting in a net loss of viable cells.

Table 1. The four phases of bacterial growth.

Figure 2
Figure 2. A typical growth curve for a bacterial population. Compare the shape of the curves based on colony-forming units (CFUs) versus optical density, particularly in the death phase. The difference is due to the fact that dead cells still result in turbidity, but cannot form viable colonies in culture.

Overall, it is often critical to determine bacterial growth kinetics for a given bacterial isolate, in order to know the number of bacterial cells present in the liquid medium. There are different ways to measure growth in a liquid medium, including turbidity measurements using a colorimetric spectrophotometer, and serial dilution plating. Turbidity measurements rely on the fact that the more cells present in the liquid medium, the more turbid the liquid becomes. Serial dilution plating involves assaying the number of cells in the liquid medium that can form viable colonies on solid culture, a measurement known as the culture’s “colony-forming units”. Note, however, that such plating assays can only be used for bacteria that are, in fact, culturable.

Procedure

1. Collection of Bacterial Culture Aliquots

  1. One day before collection of growth time points, inoculate 20 mL of trypticase soy broth (TSB) medium in a 50-mL flask with E. coli.
  2. Incubate overnight at 27 °C. This relatively long incubation period results in a stationary phase population of wild type E. coli of approximately 109 CFU/mL.
  3. On the following day, use 100 µL of the prepared culture to inoculate 250 mL of TSB (in a 500-mL flask). Mix thoroughly.  Remove a 5-mL aliquot and refrigerate immediately at 4 °C. This is T = 0 or T0 time point, and should contain approximately 4 x 10⁵ CFU/mL.
  4. Place the flask of the remaining E. coli (245 mL) in a 37 °C shaking incubator. Remove 5-mL aliquots of culture every hour, up to 8 h. Store each aliquot at 4 °C. Designate these aliquots T1 through T8.

2. Serial Dilution

  1. Remove aliquots of E. coli from the refrigerator and place on ice for transporting. Keep all cultures on ice until use.
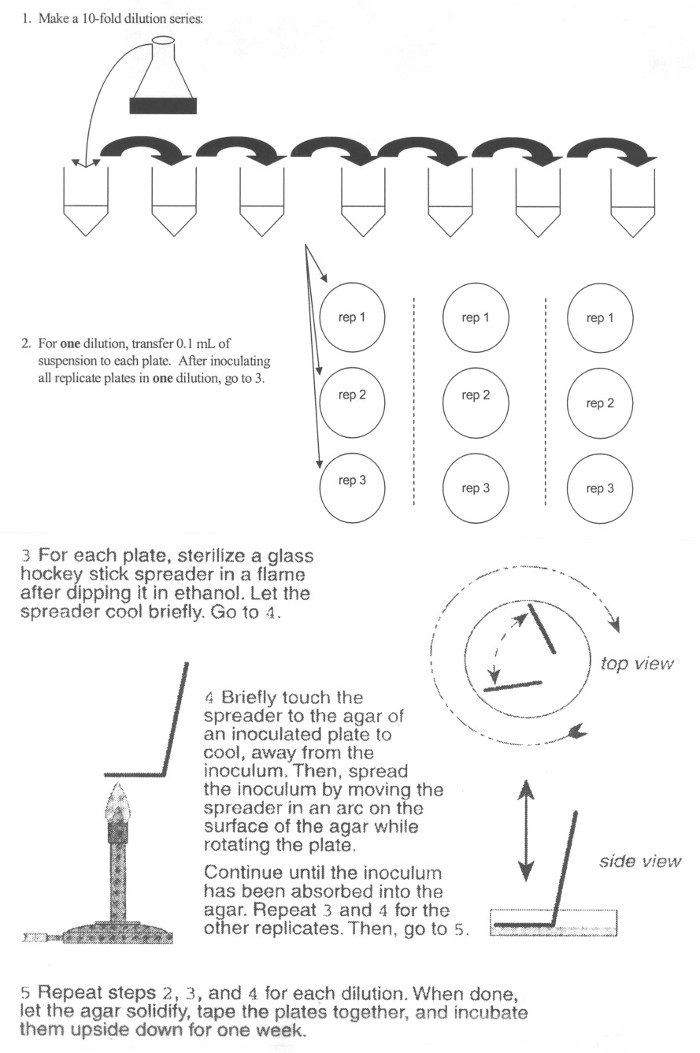
  2. Set up a series of dilution tubes to obtain various dilutions of each E. coli culture (Figure 3). Microfuge tubes are convenient for this function. Each dilution tube should have 900 µL of dilution fluid (sterile saline). A dilution series is needed for each E. coli culture (T0 through T8); label each tube according to Table 2.
    Figure 3
    Figure 3. Schematic showing the procedure for plating E. coli.
  3. Begin dilutions by adding 100 µL of E. coli from the tube labeled T0 (the initial E. coli culture) to tube A, which is the 10-1 dilution of T0. Vortex the tube for 5 s.
  4. Subsequently, add 100 µL of Tube A to the next tube of saline, Tube B, which is the 10-2 dilution of T0. Continue the needed dilution series for each time point aliquot. Remember to vortex each tube prior to transfer. It is also important to use a new pipette tip for each transfer.
E. coli culture Dilutions needed and Tube #
A B C D E F G
T0 10-1 10-2
T1 10-1 10-2
T2 10-1 10-2 10-3
T3 10-1 10-2 10-3 10-4
T4 10-1 10-2 10-3 10-4 10-5
T5 10-1 10-2 10-3 10-4 10-5 10-6
T6 10-1 10-2 10-3 10-4 10-5 10-6 10-7
T7 10-1 10-2 10-3 10-4 10-5 10-6
T8 10-1 10-2 10-3 10-4 10-5 10-6

Table 2. Dilution series required for each E. coli culture.

3. Plating

  1. Three dilutions for each E. coli culture time point aliquot will be plated, according to Table 3. Label plates with the time point (T1 through T8), the dilution factor, and volume to be added. Use triplicate plates for each dilution.
  2. Add 100 µL of each dilution to the plate by pipetting the amount to the center of the agar plate (Figure 3). Immediately spread the aliquot by utilizing a flame sterilized “L” shaped glass rod. If the aliquot is not spread immediately, it sorbs in situ on the plate, resulting in bacterial overgrowth at the spot of initial inoculation.
  3. Repeat the plating for each dilution series for time points T1 through T8. Remember to sterilize the rod between plates and especially between different dilutions.
  4. Once plates have dried for a few minutes, invert and place in 37 °C incubator overnight. Inverting the plates preclude condensation from falling onto the agar plate. Following overnight incubation, plates should be stored in refrigerator.
E.coli culture Dilutions to be plated
T0 10-1 10-2 10-3
T1 10-1 10-2 10-3
T2 10-2 10-3 10-4
T3 10-3 10-4 10-5
T4 10-4 10-5 10-6
T5 10-5 10-6 10-7
T6 10-6 10-7 10-8
T7* 10-5 10-6 10-7
T8* 10-4 10-5 10-6

*Lower dilutions take into account lower populations due to death phase.

Table 3. Plating protocol for E. coli cultures.

4. Counting Colonies and Calculating Mean Generation Time

  1. Examine plates for uniformity of colonies and lack of contamination.
  2. For each time point (T0 through T8), pick one dilution that contains between 30 and 300 colonies, and count triplicate plates.
  3. Using the dilution factor, back-calculate the number of cells per mL of original culture at time points T0 through T8. For example, if the number of colonies resulting from a 10-4 dilution is 30, 28, and 32:
    Mean number of colonies = 30 colonies
    These arose from 0.1 mL of a 10-4 dilution
    Number of colonies per mL = 30 x 104 = 3 x 10⁶
  4. Plot log10 CFU/mL versus time (in hours).
  5. From the graph, identify the exponential phase of growth. Using 2 time points within the exponential growth phase and the corresponding cell numbers at each time, calculate the mean generation time.

Results

Following a serial dilution plating experiment, the following data was obtained. At the beginning of exponential growth designated here as time t = 0, the initial concentration of bacterial cells is 1,000 CFU/mL. At time t = 6 h, the concentration of cells is 16,000 CFU/mL.

Now, X = 2n x X0

Where: X0 = initial concentration of cells = 1,000 CFU/mL
X = concentration of cells after time t = 16,000 CFU/mL
n = number of generations
16,000 = 2n x 1,000
2n = 16
log10 2n = log10 16
n x 0.301 = 1.204
n = 1.204 = 4
       0.301

Four generations elapsed in 6 h, so

Mean Generation Time = 6/4 = 1.5 h.

Figure 4
Figure 4. A root nodule that contains nitrogen-fixing bacteria.

Application and Summary

Knowledge of bacterial growth kinetics and bacterial numbers in a culture medium is important from both a research and commercial point of view. In research, it is often critical to know the number of bacteria in a sample, so the experiment can be replicated, if need be, with the exact same numbers. For example, during experiments in which bacterial inoculants are added to a plot of soil, a minimum of 104 CFU needs to be added per gram of soil to get the desired effect, such as enhanced biodegradation of toxic organic soil contaminants. Another example is the case of commercially produced rhizobial inoculants, where known numbers of rhizobia (bacteria that enter into symbiotic relationships with the roots of plants) are impregnated into a peat-based carbon medium (Figure 4). The medium is then used to inoculate legume seeds to enhance biological nitrogen fixation (i.e., the conversion of molecular nitrogen into organic forms that can be used by organisms as nutrients).

Growth kinetics is also useful for assessing whether particular strains of bacteria are adapted to metabolize certain substrates, such as industrial waste or oil pollution. Bacteria that are genetically engineered to clean up oil spills, for example, can be grown in the presence of complex hydrocarbons to ensure that their growth would not be repressed by the toxic effects of oil. Similarly, the slope and shape of growth curves produced from bacteria grown with mixtures of industrial waste products can inform scientists whether the bacteria can metabolize the particular substance, and how many potential energy sources for the bacteria can be found in the waste mixture. 

Tags

Bacterial Growth Curve AnalysisEnvironmental ApplicationsMeasuring Growth RateMicrobiological TechniqueBasic ResearchAgricultural ApplicationsIndustrial ApplicationsBacteriaAbundant Life FormsHuman BodyGenetically Tractable Bacterial SpeciesResearch ModelsIndustrial Scale ProductionLab CultureGrowth KineticsPhysiological FunctionsMetabolic FunctionsCell NumberDownstream ApplicationsGrowth Curve ProtocolEnvironmental Science Applications

Skip to...

0:00

Overview

1:15

Principles of Bacterial Growth Curve Analysis

3:46

Collection of Bacterial Culture Aliquots

5:09

Serial Dilution Plating to Quantify Bacteria

7:19

Counting Colonies and Calculating Mean Generation Time

9:31

Applications

11:50

Summary

Videos from this collection:

article

Now Playing

Bacterial Growth Curve Analysis and its Environmental Applications

Environmental Microbiology

295.7K Views

article

Determination of Moisture Content in Soil

Environmental Microbiology

359.2K Views

article

Aseptic Technique in Environmental Science

Environmental Microbiology

126.3K Views

article

Gram Staining of Bacteria from Environmental Sources

Environmental Microbiology

100.1K Views

article

Visualizing Soil Microorganisms via the Contact Slide Assay and Microscopy

Environmental Microbiology

42.2K Views

article

Filamentous Fungi

Environmental Microbiology

57.2K Views

article

Community DNA Extraction from Bacterial Colonies

Environmental Microbiology

28.8K Views

article

Detecting Environmental Microorganisms with the Polymerase Chain Reaction and Gel Electrophoresis

Environmental Microbiology

44.5K Views

article

RNA Analysis of Environmental Samples Using RT-PCR

Environmental Microbiology

40.3K Views

article

Quantifying Environmental Microorganisms and Viruses Using qPCR

Environmental Microbiology

47.8K Views

article

Water Quality Analysis via Indicator Organisms

Environmental Microbiology

29.5K Views

article

Isolation of Fecal Bacteria from Water Samples by Filtration

Environmental Microbiology

39.3K Views

article

Detection of Bacteriophages in Environmental Samples

Environmental Microbiology

40.7K Views

article

Culturing and Enumerating Bacteria from Soil Samples

Environmental Microbiology

184.1K Views

article

Algae Enumeration via Culturable Methodology

Environmental Microbiology

13.8K Views

JoVE Logo

Privacy

Terms of Use

Policies

Research

Education

ABOUT JoVE

Copyright © 2025 MyJoVE Corporation. All rights reserved