
The Attentional Blink
Overview
Source: Laboratory of Jonathan Flombaum—Johns Hopkins University
In order for recognition of a certain stimulus to take place, visual attention needs to be directed towards said stimulus. To the earliest parts of the visual system, objects are not objects, they are collections of visual features-lines, corners, changes in texture, color, and light. Attention is the resource that is necessary for later processing in order to recognize what a given bundle of features adds up to. This makes attention a central focus of research. One especially important set of questions concerns how people sustain attention, that is, the extent to which they can continuously maintain a focus of attention from moment-to-moment. It is now known that sustained attention takes great effort. When attention needs to be focused very rapidly on something that is moving or changing very quickly, the effort involved causes a momentary lapse in attention once it is disengaged. This kind of lapse in attention is called an attentional blink. It is like the brain blinks for a moment, shutting down attention for a rest. Stimuli that appear during an attentional blink will not be perceived.
In 1992, a group of researchers devised a paradigm to study the attentional blink, and the paradigm has come to be known by the same name.1 It demonstrates some of the challenges to maintaining focused attention. This video demonstrates how to implement the attentional blink paradigm in order to study sustained visual attention.
Procedure
1. Equipment
- The experiment requires a computer and experiment implementation software such as E-Prime, or a programming environment such as MATLAB or PsychoPy.
2. Stimulus and experiment design
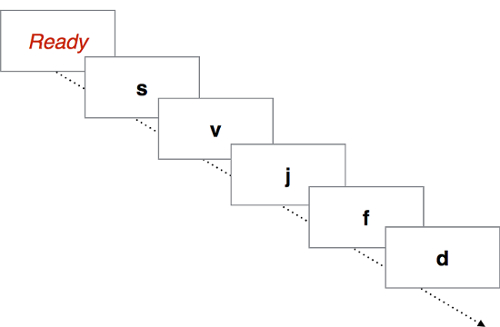
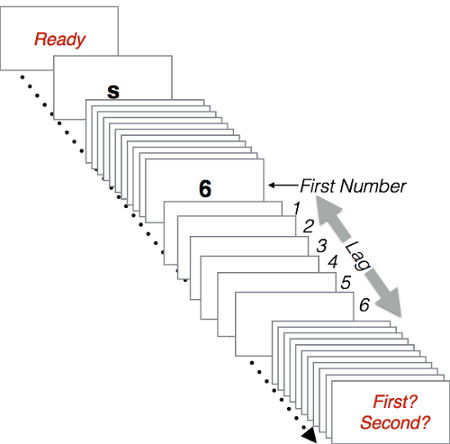
- This experiment relies on a general experimental procedure called Rapid Serial Visual Presentation, RSVP for short.
- The basics of RSVP involve experimental trials in which a series of images is shown rapidly, one after the other. Images usually remain in a dis
Results
Graph average response accuracy for the first number, along with response accuracy for the second number as a function of lag position. Figure 5 shows an example.
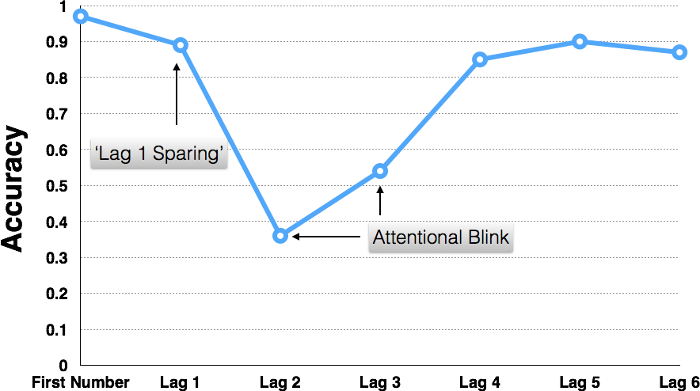
Figure 5: Results of an attentional blink experiment. As shown, participants are generally able to report the first number in a sequence with ver
Application and Summary
Like many other laboratory tasks for studying attention, the attentional blink has become a common tool in studies of brain damage, as well as in studies that use neuroimaging techniques to investigate the brain areas involved in controlling and coordinating attention.
The attentional blink paradigm has also been used to investigate the kinds of things that may capture attention automatically, and even how anxiety and other mental health problems may cause diverted attention. These studies use
References
- Raymond, J. E., Shapiro, K. L., & Arnell, K. M. (1992). Temporary suppression of visual processing in an RSVP task: An attentional blink?. Journal of Experimental Psychology: Human Perception and Performance, 18(3), 849
Tags
Skip to...
Videos from this collection:

Now Playing
The Attentional Blink
Sensation and Perception
15.8K Views

Color Afterimages
Sensation and Perception
11.1K Views

Finding Your Blind Spot and Perceptual Filling-in
Sensation and Perception
17.3K Views

Perspectives on Sensation and Perception
Sensation and Perception
11.8K Views

Motion-induced Blindness
Sensation and Perception
6.9K Views

The Rubber Hand Illusion
Sensation and Perception
18.3K Views

The Ames Room
Sensation and Perception
17.4K Views

Inattentional Blindness
Sensation and Perception
13.2K Views

Spatial Cueing
Sensation and Perception
14.9K Views

Crowding
Sensation and Perception
5.7K Views

The Inverted-face Effect
Sensation and Perception
15.5K Views

The McGurk Effect
Sensation and Perception
16.0K Views

Just-noticeable Differences
Sensation and Perception
15.3K Views

The Staircase Procedure for Finding a Perceptual Threshold
Sensation and Perception
24.3K Views

Object Substitution Masking
Sensation and Perception
6.4K Views
Copyright © 2025 MyJoVE Corporation. All rights reserved