
Analisi del ciclo cellulare: valutazione della proliferazione delle cellule T CD8 e CD4 in seguito a stimolazione tramite colorazione CFSE e citometria a flusso
Panoramica
Fonte: Perchet Thibaut1,2,3, Meunier Sylvain1,2,3, Sophie Novault4, Rachel Golub1,2,3
1 Unità di Linfopoiesi, Dipartimento di Immunologia, Istituto Pasteur, Parigi, Francia
2 INSERM U1223, Parigi, Francia
3 Université Paris Diderot, Sorbonne Paris Cité, Cellule Pasteur, Parigi, Francia
4 Platfrom, Citometria a flusso e biomarcatori UtechS, Center for Translational Science, Pasteur Institute, Parigi, Francia
Il ciclo cellulare è un processo universale di vita. Durante il ciclo cellulare, una cellula subisce diverse modifiche per dividersi in due cellule figlie. Questo meccanismo si verifica per tutta la vita di un organismo in risposta ai suoi bisogni. Le divisioni cellulari e lo sviluppo embrionale producono un organismo completo da uno zigote unicellulare. Durante l'età adulta, il ciclo cellulare è centrale in molti processi biologici critici, come le riparazioni dei tessuti.
I meccanismi di divisione cellulare sono eventi strettamente controllati in cui la cellula subisce modifiche graduali prima della divisione finale. Le cellule che non sono ancora nel ciclo sono descritte come nella fase Gap 0 (G0). Durante questa fase la cellula è considerata quiescente. Quando la cellula inizia a pedalare, vengono riconosciute quattro fasi distinte: Gap 1 (G1),Sintesi (S), Gap 2 (G2) e Mitosi (M). La fase G1 è un punto di controllo per le risorse necessarie alla cellula per la sintesi del DNA. Quindi, si verifica la fase S e inizia la replicazione del DNA, seguita dall'interfase G2, un altro checkpoint che controlla tutti gli elementi necessari per la divisione della cellula. Infine, la cellula entra nella mitosi e si divide in due cellule figlie.
La divisione cellulare è un parametro altamente informativo in molti sistemi biologici diversi. Nel campo dell'immunologia, l'analisi della proliferazione leucocitaria può indicare il meccanismo della risposta immunitaria. Altri domini di indagine si basano anche sull'analisi del ciclo cellulare. Ad esempio, l'analisi del ciclo cellulare durante lo sviluppo del tumore ha migliorato la nostra comprensione del cancro.
Molti coloranti fluorescenti sono ora disponibili per il monitoraggio della proliferazione cellulare. Questi coloranti differiscono nelle loro proprietà chimiche e spettrali. Esistono due diverse classi di coloranti: i coloranti proteici si combinano permanentemente con le proteine formando un legame covalente e i coloranti di membrana si intercalano stabilmente all'interno delle membrane cellulari attraverso forti associazioni idrofobiche. Studi in vitro e in vivo sulla proliferazione delle cellule immunitarie mediante citometria a flusso sono tra le applicazioni più comuni di entrambe le classi di coloranti a tracciamento cellulare (1, 2).
CFSE (Carboxyfluorescein succinimidyl ester) è un colorante fluorescente che segna le cellule in divisione. Inizialmente, tutte le cellule ricevono la stessa quantità di colorante; le cellule che si dividono uniformemente dividono il colorante che hanno ricevuto tra le loro due cellule figlie. Di conseguenza, il ciclo cellulare può essere seguito dalla progressiva diminuzione dell'intensità del colorante nelle cellule. La colorazione CFSE è seguita dalla citometria a flusso multiparametrica convenzionale, una tecnologia ad alto rendimento basata sulla fluorescenza che consente la caratterizzazione fenotipica e funzionale delle cellule in base al loro grado di colorazione CFSE (3).
Nel seguente esperimento, valutiamo la proliferazione delle cellule T CD4+ e CD8+ in vitro, dopo stimolazione CD3, utilizzando la colorazione CFSE e la citometria a flusso.
Procedura
1. Preparazione
- Prima di iniziare, indossare guanti da laboratorio e gli indumenti protettivi appropriati.
- Sterilizzare tutti gli strumenti di dissezione, prima con un detergente e poi con etanolo al 70% e poi asciugarli accuratamente.
- Preparare 50 ml di soluzione salina bilanciata di Hank (HBSS) contenente il 2% di siero fetale per vitelli (FCS).
2. Dissezione
- Utilizzando un sistema di rilascio di anidride carbonica, eutanasizzare il topo per ipossia. Fissare il topo eutanasizzato su una piastra di dissezione in posizione supina ed eseguire una laparotomia longitudinale usando forbici e pinza.
- Usando la pinza, spostare l'intestino e lo stomaco sul lato destro dell'addome per esporre lo stomaco e la milza. La milza è attaccata allo stomaco.
- Usando la pinza staccare accuratamente la milza dallo stomaco e metterla nella capsula di Petri contenente 5 ml di HBSS 2% FCS.
3. Isolamento delle cellule immunitarie
- Posizionare la milza su un colino cellulare da 40 μm sulla stessa capsula di Petri. Schiacciare la milza con uno stantuffo per dissociarla.
- Trasferire la milza dissociata e il fluido in un tubo centrifugo da 15 ml.
- Centrifugare il tubo a 370 x g per 7 min a 10°C ed eliminare il surnatante evitando il pellet.
- Ricaspendare il pellet in 2 ml di acetato di potassio per lisire gli eritrociti. Attendere 2 minuti e quindi portare il volume fino a 15 ml utilizzando HBSS 2% FCS.
- Centrifugare nuovamente il tubo a 370 x g per 7 min a 10°C. Scartare il surnatante e ricaspenare il pellet in 5 ml di HBSS 2% FCS.
- Contare le cellule utilizzando un test di colorazione blu tripano e regolare la concentrazione cellulare finale a 107 cellule / mL utilizzando un volume appropriato di HBSS 2% FCS.
4. Colorazione CFSE e stimolazione delle cellule T
- Distribuire 107 cellule/tubo isolati della milza in 4 tubi (tubi da 15 mL, etichettati da 1 a 4)
- Aggiungere 3 mL HBSS 2%FCS a ciascun tubo.
- Aggiungere 1 μL di CSFE in ogni tubo (concentrazione finale- 5 μM).
- Incubare i tubi a 37°C in un incubatore a CO2 al 5% per 10 min.
- Nei tubi 3 e 4, aggiungere 12 mL di anticorpo HBSS 2% FCS + anti-CD3 ad una concentrazione finale di 2,5 μg/mL. I tubi 3 e 4 sono stimolati utilizzando anticorpi anti-CD3, per osservare l'effetto sul ciclo cellulare.
- Nei tubi 1 e 2 aggiungere 12 mL di HBSS 2% FCS. Le cellule nei tubi 1 e 2 non saranno stimolate.
- Centrifugare tutti i tubi a 370 x g per 7 min a 10°C. Scartare i supernatanti.
- Spese di sospensione del pellet in 2 ml di HBSS 2%FCS.
- Trasferire le soluzioni risultanti in pozzetti separati su una piastra a 6 pozzetti.
- Incubare le cellule a 37°C, 5% CO2 per 3 giorni.
5. Colorazione cellulare
- Il giorno 3, aggiungere 2 ml HBSS 2% FCS in ben 1 e 3.
- Pipettare vigorosamente e trasferire i campioni in tubi FACS da 5 ml.
- Continuare l'incubazione delle cellule rimanenti dai pozzi 2-4 a 37°C, 5% CO2. Saranno analizzati il giorno 5 per studiare gli effetti a lungo termine della stimolazione sul ciclo cellulare.
- Centrifugare i tubi a 370 x g per 7 min a 10°C. Scartare i supernatanti.
- Aggiungere 100 μL di miscela di anticorpi (vedere Tabella 1) a ciascun tubo.
| Anticorpo | Fluorocromo | Diluizione |
| CD3 | Blu Pacifico | 1/100 |
| CD4 | BV786 · | 1/1600 |
| CD8 | PE | 1/400 |
| Thy1,2 | BV605 · | 1/400 |
Tabella 1: Composizione della miscela di anticorpi. Quattro cocktail di anticorpi che utilizzano coniugati fluorescenti anticorpali concentrati e HBSS.
- Incubare i tubi per 20 minuti sul ghiaccio al buio.
- Aggiungere 1 mL di HBSS 2%FCS e centrifugare i tubi a 370 x g per 7 min a 10°C.
- Scartare il surnatante e risuspenare il pellet in 200 μL di HBSS 2% FCS.
- Trasferire i pellet riaspendati in nuovi tubi FACS etichettati.
- Valutare la proliferazione delle cellule T utilizzando FACS.
- Il giorno 5, ripetere il processo di colorazione cellulare con le cellule dai restanti due pozzi della piastra a 6 pozzi.
6. Analisi dei dati
- Aprire il software "FlowJo" e trascinare i file nella finestra "Tutti di esempio".
- Fare doppio clic sul file per le celle non stimolate raccolte il giorno 3 per visualizzare un dot plot con dispersione in avanti sull'asse Y e dispersione laterale sull'asse X.
- Clicca su"Polygon"e crea una strategia di gating per selezionare le cellule linfoidi, Thy1.2+ CD3+ cellule e distinguere le cellule CD4+ e CD8+ (vedi Figura 1).
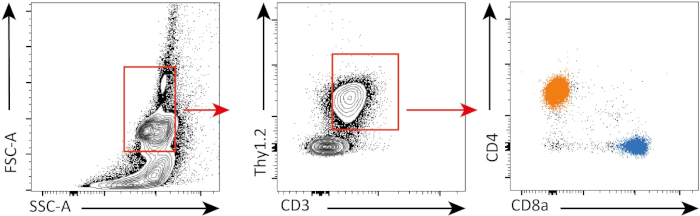
Figura 1: Strategia di Gating. Le cellule vengono prima recintate in base alla loro morfologia (a sinistra: FSC-A, SSC-A). Le cellule T vengono quindi gated (al centro: CD3, Thy1.2) e ulteriormente divise su cellule CD4+ T (arancione) e cd8+ T (blu) (a destra: CD4, CD8). Fare clic qui per visualizzare una versione più grande di questa figura.
- Ripetere i passaggi con altri file.
- Per determinare le frequenze delle celle in divisione e non in divisione, visualizzare prima le popolazioni cellulari facendo clic su "Editor di layout".
- Trascinare le celle T CD4 e CD8 T da ciascuna delle quattro provette nella finestra "Tutti i campioni"
- Appariranno grafici che rappresentano ogni popolazione.
- Usa l'istogramma per visualizzare i risultati e seleziona "CFSE" come parametro per il confronto dei diversi tubi e delle diverse popolazioni.
- Le cellule non in divisione mantengono livelli più elevati di CFSE, mentre le cellule proliferanti dividono il contenuto di CFSE in cellule in divisione
- Create un cancello su celle non divisorie e applicatelo in tutti i tubi.
- Create un cancello sulle celle divisorie e applicatelo in tutti i tubi.
- Per esaminare la frequenza di divisione delle celle CD3+, fare clic su "Editor tabelle".
- Trascinare le popolazioni di interesse - dividendo le cellule T CD8 e dividendo le cellule T CD4 - in "Tabella".
- Nel menu"Statistiche",seleziona"Frequenza delle cellule T",quindi fai clic su"Crea tabella"per visualizzare la frequenza in una nuova tabella.
- Clicca su"Crea tabella". Per visualizzare i valori di frequenza, visualizzateli in una nuova tabella.
Risultati
In questo esperimento, abbiamo seguito la proliferazione delle cellule T spleniche CD4+ e CD8+ in coltura in vitro. Dopo 3 giorni, non abbiamo visto una forte proliferazione in entrambe le cellule T CD4+ e CD8+ con o senza stimolazione. Questo può essere visto nel pannello superiore della Figura 2 dove i picchi di CSFE non stanno diminuendo. Tuttavia, dopo 5 giorni, abbiamo iniziato a vedere la proliferazione in entrambe le popolazioni, il che è evidente dalla diminuzione dei picchi CSFE (pannelli inferiori, Figura 2). La colorazione CFSE dimostra chiaramente che entrambe le cellule T CD4+ e CD8+ si dividevano di più dopo la stimolazione. Inoltre, le cellule T CD8+ sembravano essere leggermente più proliferative delle cellule CD4+ T dopo 5 giorni di stimolazione.
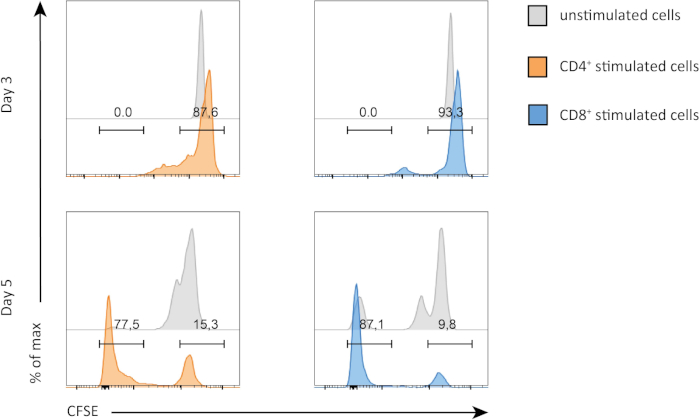
Figura 2: Proliferazione delle cellule T CD4 rispetto a CD8. Proliferazione delle cellule T al giorno 3 (pannello superiore) e al giorno 5 (pannello inferiore). Il ciclo cellulare viene confrontato tra le cellule T CD4 e CD8 con o senza stimolazione in due giorni diversi. Le cellule T CD4 e CD8 proliferano di più quando stimolate. Le cellule T stimolate CD8 proliferano più delle cellule T stimolate CD4 al giorno 5. Fare clic qui per visualizzare una versione più grande di questa figura.
Applicazione e Riepilogo
I saggi di proliferazione sono spesso utilizzati in diversi campi come l'immunologia per determinare il grado di attivazione delle cellule. Viene anche eseguito nella diagnostica oncologica per determinare l'aggressività del tumore nei pazienti. La colorazione CFSE è una tecnica utile per seguire la proliferazione delle popolazioni di cellule immunitarie nel tempo. Altri metodi consentono la caratterizzazione del ciclo cellulare. BrdU, un equivalente di CFSE è incorporato solo nelle cellule in divisione. Il recente modello murino Fucci consente anche il rilevamento delle fasi del ciclo cellulare, senza ulteriori macchie.
Vai a...
Video da questa raccolta:

Now Playing
Analisi del ciclo cellulare: valutazione della proliferazione delle cellule T CD8 e CD4 in seguito a stimolazione tramite colorazione CFSE e citometria a flusso
Immunology
24.3K Visualizzazioni

Citometria a flusso e selezione cellulare attivata dalla fluorescenza (FACS): isolamento dei linfociti B della milza
Immunology
93.2K Visualizzazioni

Magnetic Activated Cell Sorting (MACS): isolamento dei linfociti T timici
Immunology
23.1K Visualizzazioni

Saggi ELISA: indiretti, sandwich e competitivi
Immunology
239.3K Visualizzazioni

EliSPOT Assay: Rilevamento di splenociti secernenti IFN-γ
Immunology
28.8K Visualizzazioni

Immunoistochimica e immunocitochimica: imaging dei tessuti tramite microscopia ottica
Immunology
79.1K Visualizzazioni

Generazione di anticorpi: produzione di anticorpi monoclonali attraverso l'utilizzo di ibridomi
Immunology
43.6K Visualizzazioni

Microscopia a immunofluorescenza: colorazione a immunofluorescenza di sezioni di tessuto incorporato in paraffina
Immunology
54.0K Visualizzazioni

Microscopia a fluorescenza confocale: una tecnica per determinare la localizzazione delle proteine nei fibroblasti di topo
Immunology
43.4K Visualizzazioni

Tecniche basate sull'immuno-precipitazione: purificazione di proteine endogene con l'impiego di microsfere di agarosio
Immunology
87.8K Visualizzazioni

Trasferimento di cellule adottive: introduzione degli splenociti di topo donatore a un topo ospite e valutazione del successo tramite FACS
Immunology
22.6K Visualizzazioni

Saggio per la morte cellulare: saggio di rilascio di cromo della capacità citotossica
Immunology
151.5K Visualizzazioni
Personale delle biblioteche
Copyright © 2025 MyJoVE Corporation. Tutti i diritti riservati