Aby wyświetlić tę treść, wymagana jest subskrypcja JoVE. Zaloguj się lub rozpocznij bezpłatny okres próbny.
Method Article
Assessing Hepatic Metabolic Changes During Progressive Colonization of Germ-free Mouse by 1H NMR Spectroscopy
W tym Artykule
Podsumowanie
A progressive colonization procedure is described to further assess its impact on the host hepatic metabolism. Colonization is monitored non invasively by evaluating the urinary excretion of microbial co-metabolites by NMR-based metabolic profiling while hepatic metabolism is assessed by High Resolution Magic Angle Spinning (HR MAS) NMR profiling of intact biopsy.
Streszczenie
It is well known that gut bacteria contribute significantly to the host homeostasis, providing a range of benefits such as immune protection and vitamin synthesis. They also supply the host with a considerable amount of nutrients, making this ecosystem an essential metabolic organ. In the context of increasing evidence of the link between the gut flora and the metabolic syndrome, understanding the metabolic interaction between the host and its gut microbiota is becoming an important challenge of modern biology.1-4
Colonization (also referred to as normalization process) designates the establishment of micro-organisms in a former germ-free animal. While it is a natural process occurring at birth, it is also used in adult germ-free animals to control the gut floral ecosystem and further determine its impact on the host metabolism. A common procedure to control the colonization process is to use the gavage method with a single or a mixture of micro-organisms. This method results in a very quick colonization and presents the disadvantage of being extremely stressful5. It is therefore useful to minimize the stress and to obtain a slower colonization process to observe gradually the impact of bacterial establishment on the host metabolism.
In this manuscript, we describe a procedure to assess the modification of hepatic metabolism during a gradual colonization process using a non-destructive metabolic profiling technique. We propose to monitor gut microbial colonization by assessing the gut microbial metabolic activity reflected by the urinary excretion of microbial co-metabolites by 1H NMR-based metabolic profiling. This allows an appreciation of the stability of gut microbial activity beyond the stable establishment of the gut microbial ecosystem usually assessed by monitoring fecal bacteria by DGGE (denaturing gradient gel electrophoresis).6 The colonization takes place in a conventional open environment and is initiated by a dirty litter soiled by conventional animals, which will serve as controls. Rodents being coprophagous animals, this ensures a homogenous colonization as previously described.7
Hepatic metabolic profiling is measured directly from an intact liver biopsy using 1H High Resolution Magic Angle Spinning NMR spectroscopy. This semi-quantitative technique offers a quick way to assess, without damaging the cell structure, the major metabolites such as triglycerides, glucose and glycogen in order to further estimate the complex interaction between the colonization process and the hepatic metabolism7-10. This method can also be applied to any tissue biopsy11,12.
Protokół
1. Colonization of germ-free animals and sample collection
- Remove germ-free animals from isolators and house them in a conventional husbandry room in cages equipped with filter in front of the conventional animals which will serve as controls (Figure 1).
- Mix half of the litter (3 days old) taken from the control conventional cage with the litter of the germ-free animals. Always keep 1/3 of the dirty conventional litter each time it is necessary to renew it in order to maintain a level of bacteria (keep it at least for 3 days).
- Collect urine in a 1.5 mL microtube by handling the mouse over the tube and help micturition by gently massage the bowel. Snap-freeze immediately in liquid nitrogen. Store at least at -40°C until NMR analysis. A minimum volume of 20 μL is required for acquisition with a 5 mm NMR probe, but it is recommended to use 30 μL to improve quality of metabolic profiling.
- Animals should be euthanized without use of any anesthetic in order to avoid confounding NMR resonances due to hepatic metabolism of anesthetic compounds (for example, use cervical dislocation followed by confirmation of death by exsanguination)
2. Recommendation for collection of liver biopsy
- Do not use any product containing alcohol to avoid contamination. Wash tools using water only or saline solution.
- Do not perforate gall bladder. In case of bile leak, wash tissue immediately with water or saline solution.
- Collect liver biopsies (about 15-50 mg) from the left lobe as shown in Figure 2. For reproducible biopsies, collect consistently in the center of the left lobe avoiding the peripheral areas where tissue is thinner.
- Snap freeze biopsies in liquid nitrogen immediately and store them at -80°C until NMR analysis.
3. 1H NMR acquisition of urine microvolume
- Prepare 0.2M sodium phosphate buffer solution in D2O (99.8 %), pH 7.4 containing 1 mM 3-(trimethylsilyl)propionic acid-d4 (TSP).
- Mix 30 μL of urine with 30 μL of sodium phosphate buffer.
- Transfer 50 μL of mixed solution into 1.7 mm NMR capillary tube (Figure 3 (2)) using a 50 μL glass syringe equipped with a metal needle (OD 0.5 mm). Be careful to avoid bubbles.
- Fit the capillary adaptor (Figure 3 (3)) on top of the capillary containing urine sample and place it into a 2.5 mm NMR microtube for 5 mm NMR probe (Figure 3 (1)). Use this combination of tubes as a regular 5 mm NMR tube for spectral acquisition.
- Use the extraction rod (Figure 3 (4)) to remove capillary from 2.5 mm NMR tube by screwing the capillary adapter gently to pull it out.
4. 1H HR MAS NMR of liver tissue biopsy: sample preparation
- MAS rotor components and tools are described in Figure 4.
- Insert biopsy (about 15-50 mg) into zirconium rotor (Figure 4 (1)) and fill the rest of the volume with pure D2O for NMR lock. Be careful to not make any bubbles because this would alter the quality of subsequent shimming and quality of data acquisition.
- Insert 50 μL Teflon spacer (Figure 4 (2)) using the cylindrical screw (Figure 4 (5)). Unscrew it and calibrate it using the depth gauge on the short side (Figure 4 (8)). At this step, it is important to pay a specific attention to the sample because part of it can leak through the spacer hole. If this is the case, then part of the biopsy is destroyed and sample weight is no longer reliable. It is thus necessary to start again from the beginning the preparation of the sample.
- Place the thead pin (Figure 4 (3)) and screw it gently with the screwdriver (Figure 4 (6)). Dry out any residual water with a piece of tissue.
- Place the cap (Figure 4 (4)) at the top of the rotor and insert it in the rotor packer (Figure 4 (6)). Press firmly until the cap is in place. There should not be any space left between the rotor and its cap.
- Mark half of the bottom of the rotor using a black marker pen to allow optical spin rate detection.
- Place the rotor inside the NMR spectrometer and start spinning at 5 kHz. Acquire 1H NMR spectrum using CPMG pulse sequence13 according to manufacturer's guidelines.
- Use α anomeric glucose resonance at 5.22 ppm (doublet) to calibrate NMR spectra.
- To unpack the rotor, proceed by removing the cap using the cap remover (Figure 4 (9)). Unscrew thead pin and remove Teflon spacer using the cylindrical screw. Wash thoroughly using water and detergent.
5. Representative Results
Gut microbial activity can be monitored using urinary metabolic profiling. A large number of urinary microbial co-metabolites identifiable by 1H NMR have been described in the literature7,14-17. These microbial co-metabolites are particularly useful to monitor the colonization process as they provide a quick and noninvasive way to estimate when the newly established ecosystem is stable. Figure 5A clearly illustrates the appearance of gut microbial co-metabolites over the colonization process. This figure shows a urinary metabolic profile obtained by following the procedure described in Step 2 for an animal colonized 20 days using procedure described in Step 1. This animal did not excrete any indoxyl sulfate and very little amounts of phenylacetylglycine (PAG) and p-cresol sulfate at the germ-free state (day 0-blue). As colonization progresses, these 3 markers of protein metabolism by the gut microbiota increase considerably to reach an equilibrium at day 20 (red). This is particularly easy to monitor for a group of animals as illustrated on Figure 5B using the PAG resonance. This diagram was obtained by integrating the area under the resonances highlighted in gray in Figure 5A (δ 7.40-7.43), corresponding to a specific resonance (triplet) of PAG for a group of 7 animals.
1H High Resolution Magic Angle Spinning (HR MAS) NMR spectroscopy is a non destructive technique that allows quick and reproducible acquisitions of metabolic profiles of any kind of biopsy18. In this protocol, we used this powerful technique to obtain a hepatic metabolic profile of 2 mice before (blue) and after (red) colonization (Figure 6). This figure illustrates well the information that can be derived from a MAS NMR-based metabolic profile. Numerous amino acids as well as metabolites derived from energetic metabolism such as glucose, glycogen, lactate, triglycerides, (D)-3-hydroxybutyrate and nicotinurate can be visualized. These profiles also contain information relevant to oxidative stress (i.e. ascorbic acid, glutathione), nucleotide metabolism (i.e. inosine, uridine) and methylamine metabolism (i.e. choline, Trimethylamine-N-oxide). In this example, it is very clear that the germ-free mouse displays almost no glycogen and very low amounts of glucose and triglycerides as was previously published7.
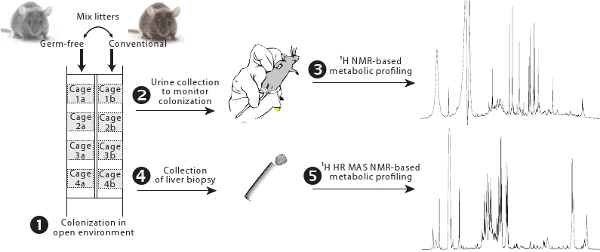
Figure 1. Overview of the colonization protocol. Germ-free and conventional animals are housed in cages equipped with filters side by side and their litters are exchanged to allow progressive colonization from the conventional gut microbiota (1). Gut microbial activity is monitored using 1H NMR-based metabolic profiling (2-3). Hepatic metabolism is assessed by 1H HR MAS NMR-based metabolic profiling (4-5).
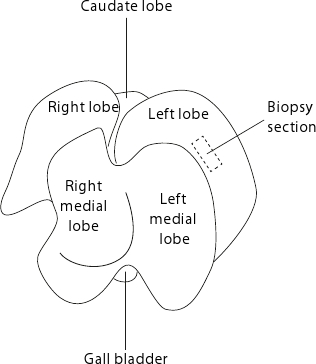
Figure 2. Mouse liver anatomy. The liver is displayed such as the flat side of the organ faces the table. For reproducible biopsies, it is advised to always collect samples from the center of the left lobe as indicated by the dashed rectangle.

Figure 3. 1.7 mm NMR capillary kit to work with microvolumes. Key: 1: 2.5 mm NMR microtube, 2: 1.7 mm NMR capillary tube, 3: Capillary adapter, 4: Extraction rod.
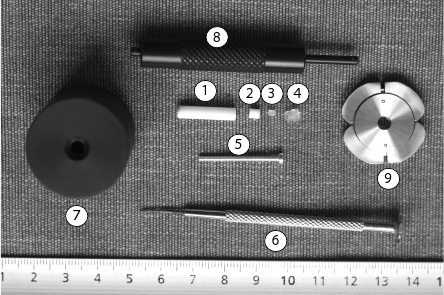
Figure 4. MAS rotor equipment. Key: 1: MAS rotor, 2: 50 μL Teflon spacer, 3: Thead pin, 4: cap, 5: cylindrical screw, 6: screwdriver, 7: rotor packer, 8: depth gauge.
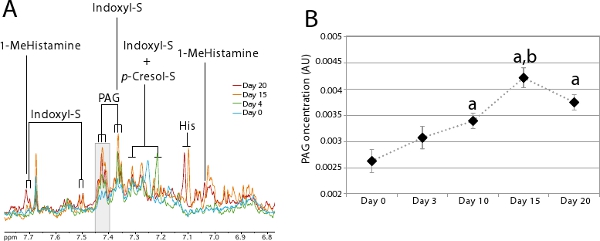
Figure 5. Evolution of urinary metabolic profiles during colonization.
- Zoom on the aromatic region of the spectra between 6.8-7.8 ppm where microbial co-metabolites can be visualized. 1H NMR spectra were derived from a single individual at day 0 (blue), 4 (green), 15 (orange) and 20 (red) post-colonization. The grey zone corresponds to the area that was integrated to make the diagram in B. Key: 1-MeHistamine: 1-methylhistamine; Indoxyl-S: Indoxyl sulfate; His: Histidine; p-Cresol-S: p-Cresol sulfate; PAG: Phenylacetylglycine.
- Average PAG concentration during colonization (n=7). Student’s t-test was used to compare the difference in PAG concentration at various time-points: a: p<0.05 compared to day 0; b: p<0.01 compared to day 10.
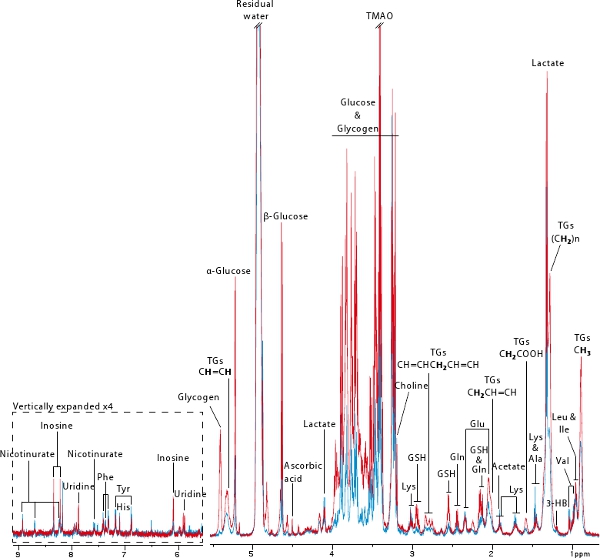
Figure 6.Typical 600 MHz 1H HR MAS NMR spectra of liver biopsies derived from germ-free (blue) and ex-germ-free (red) mice. Bold protons are responsible for the triglyceride resonance.
Key: 3-HB: 3-hydroxybutyrate, GSH: reduced glutathione, TGs: Triglycerides, TMAO: Trimethylamine-N-oxide.
Dyskusje
In this protocol, we described a progressive colonization procedure in an open environment to further investigate the impact of gut microbiota on hepatic metabolism assessed by 1H HR MAS NMR profiling of intact biopsy. Various methods of colonization have been described in the literature. The most common methods to colonize animals with a defined microbiota are oral gavage or contaminated drinking water19,20. Fecal inoculation can also be used as previously described21. The colonization m...
Ujawnienia
We have nothing to disclose.
Podziękowania
All NMR spectra used as illustrative examples are derived from a previously published study7 which was financially supported by Nestlé .
Materiały
| Name | Company | Catalog Number | Comments |
| Table of specific reagents and equipment: | |||
| 2.5 mm microtube | New Era | NE-H5/2.5-V-Br | |
| 1.7 mm capillary tube | Sigma-Aldrich | NORS175001 | |
| Capillary adapter | New Era | NE-325-5/1.7 | |
| Extraction rod | New Era | NE-341-5 | |
| HR-MAS rotor BL4 with 50 μL spherical Teflon spacer kit | Bruker Corporation | HZ07213 | |
| Tool kit for 50 μL inserts | Bruker Corporation | B2950 | |
| Advance III 600 MHz NMR | Bruker Corporation | ||
| 1H HR MAS NMR solid probe | Bruker Corporation | ||
| Deuterium oxide 99.9 % | Sigma-Aldrich | 530867-1L | |
| 3-(trimethylsilyl)propionic acid-d4 (TSP) | Sigma-Aldrich | 269913 | |
Odniesienia
- Cani, P. D., Delzenne, N. M. Gut microflora as a target for energy and metabolic. Curr. Opin. Clin. Nutr. Metab. Care. 10, 729-734 (2007).
- Ley, R. E., Turnbaugh, P. J., Klein, S., Gordon, J. I. Microbial ecology: human gut microbes associated with obesity. Nature. 444, 1022-1023 (2006).
- Raoult, D. Obesity pandemics and the modification of digestive bacterial flora. Eur. J. Clin. Microbiol. Infect. Dis. 27, 631-634 (2008).
- Turnbaugh, P. J., Backhed, F., Fulton, L., Gordon, J. I. Diet-induced obesity is linked to marked but reversible alterations in the mouse distal gut microbiome. Cell. Host. Microbe. 3, 213-223 (2008).
- Balcombe, J. P., Barnard, N. D., Sandusky, C. Laboratory routines cause animal stress. Contemp. Top. Lab. Anim. Sci. 43, 42-51 (2004).
- Muyzer, G., Smalla, K. Application of denaturing gradient gel electrophoresis (DGGE) and temperature gradient gel electrophoresis (TGGE) in microbial ecology. Antonie van Leeuwenhoek. 73, 127-141 (1998).
- Claus, S. P. Colonization-induced host-gut microbial metabolic interaction. MBio. 2, (2011).
- Waters, N. J. High-resolution magic angle spinning 1H NMR spectroscopy of intact liver and kidney: optimization of sample preparation procedures and biochemical stability of tissue during spectral acquisition. Anal. Biochem. 282, 16-23 (2000).
- Bollard, M. E. High-resolution 1H and 1H-13C magic angle spinning NMR spectroscopy of rat liver. Magnetic resonance in medicine. 44, 201-207 (2000).
- Lindon, J. C., Holmes, E., Nicholson, J. Pattern recognition methods and applications in biomedical magnetic resonance. Progress in Nuclear Magnetic Resonance Spectroscopy. 39, 1-40 (2001).
- Tate, A. R. Distinction between normal and renal cell carcinoma kidney cortical biopsy samples using pattern recognition of (1)H magic angle spinning (MAS) NMR spectra. NMR. Biomed. 13, 64-71 (2000).
- Wang, Y. Topographical variation in metabolic signatures of human gastrointestinal biopsies revealed by high-resolution magic-angle spinning 1H NMR spectroscopy. Journal of Proteome Research. 6, 3944-3951 (2007).
- Meiboom, S., Gill, D. Modified spin-echo method for measuring nuclear relaxation times. The review of scientific instruments. 29, 688-691 (1958).
- Nicholson, J. K., Holmes, E., Wilson, I. D. Gut microorganisms, mammalian metabolism and personalized health care. Nat. Rev. Microbiol. 3, 431-438 (2005).
- Martin, F. P. Effects of probiotic Lactobacillus paracasei treatment on the host gut tissue metabolic profiles probed via magic-angle-spinning NMR spectroscopy. Journal of Proteome Research. 6, 1471-1481 (2007).
- Swann, J. R. Variation in Antibiotic-Induced Microbial Recolonization Impacts on the Host Metabolic Phenotypes of Rats. J. Proteome. Res. , (2011).
- Jacobs, D. M., Gaudier, E., van Duynhoven, J., Vaughan, E. E. Non-digestible food ingredients, colonic microbiota and the impact on gut health and immunity: a role for metabolomics. Curr. Drug. Metab. 10, 41-54 (2009).
- Beckonert, O. High-resolution magic-angle-spinning NMR spectroscopy for metabolic profiling of intact tissues. Nat. Protoc. 5, 1019-1032 (2010).
- Hooper, L. V., Sansonetti, P., Zychlinsky, A. . Methods in microbiology. 31, 559-589 (2002).
- Rahija, R. J., Fox, J. G. Ch. 7. The mouse in biomedical research. , 217-234 (2007).
- Goodwin, B. L., Ruthven, C. R., Sandler, M. Gut flora and the origin of some urinary aromatic phenolic compounds. Biochemical Pharmacology. 47, 2294-2297 (1994).
- Koopman, J. P. 'Normalization' of germfree mice after direct and indirect contact with mice having a 'normal' intestinal microflora. Lab Anim. 20, 286-290 (1986).
- Nishikata, N., Shikata, N., Kimura, Y., Noguchi, Y. Dietary lipid-dependent regulation of de novo lipogenesis and lipid partitioning by ketogenic essential amino acids in mice. Nutrition and Diabetes. 1, 1-12 (2011).
- Spagou, K. A GC-MS metabolic profiling study of plasma samples from mice on low- and high-fat diets. J. Chromatogr. B. Analyt. Technol. Biomed. Life. Sci. 879, 1467-1475 (2011).
- Sanchez-Patan, F., Monagas, M., Moreno-Arribas, M. V., Bartolome, B. Determination of microbial phenolic acids in human faeces by UPLC-ESI-TQ MS. J. Agric. Food. Chem. 59, 2241-2247 (2011).
- Roux, A., Lison, D., Junot, C., Heilier, J. F. Applications of liquid chromatography coupled to mass spectrometry-based metabolomics in clinical chemistry and toxicology: A review. Clin. Biochem. 44, 119-135 (2011).
- Ryan, D., Robards, K., Prenzler, P. D., Kendall, M. Recent and potential developments in the analysis of urine: a review. Anal. Chim. Acta. 684, 8-20 (2011).
- Nagayama, K., Wuthrich, K., Bachmann, P., Ernst, R. R. Two-dimensional J-resolved 1H n.m.r. spectroscopy for studies of biological macromolecules. Biochem. Biophys. Res. Commun. 78, 99-105 (1977).
- Aue, W. P., Bartholdi, E., Ernst, R. R. Two-dimensional spectroscopy. Application to nuclear magnetic resonance. J. Chem. Phys. 64, 2229-2246 (1975).
- Bodenhausen, G., Ruben, D. J. Natural abundance 15N NMR by enhanced heteronuclear spectroscopy. Chemical. Physics. Letters. 69, 185-189 (1980).
- Fan, T. W. -. M. Metabolite profiling by one- and two-dimensional NMR analysis of complex mixtures. Progress in nuclear magnetic resonance spectroscopy. 28, 161-219 (1996).
- Fan, T., Lane, A. Structure-based profiling of metabolites and isotopomers by NMR. Progress in Nuclear Magnetic Resonance Spectroscopy. 52, 48-48 (2008).
- Fonville, J. M. The evolution of partial least squares models and related chemometric approaches in metabonomics and metabolic phenotyping. Journal of Chemometrics. 24, 636-649 (2010).
- Merrifield, C. A. A metabolic system-wide characterisation of the pig: a model for human physiology. Mol. Biosyst. , (2011).
- Tugnoli, V. Molecular characterization of human gastric mucosa by HR-MAS magnetic resonance spectroscopy. International Journal of Molecular Medicine. 14, 1065-1071 (2004).
- Sitter, B. Comparison of HR MAS MR spectroscopic profiles of breast cancer tissue with clinical parameters. NMR Biomed. 19, 30-40 (2006).
- Beckonert, O. Metabolic profiling, metabolomic and metabonomic procedures for NMR spectroscopy of urine, plasma, serum and tissue extracts. Nat. Protoc. 2, 2692-2703 (2007).
Przedruki i uprawnienia
Zapytaj o uprawnienia na użycie tekstu lub obrazów z tego artykułu JoVE
Zapytaj o uprawnieniaThis article has been published
Video Coming Soon
Copyright © 2025 MyJoVE Corporation. Wszelkie prawa zastrzeżone