
Aby wyświetlić tę treść, wymagana jest subskrypcja JoVE. Zaloguj się lub rozpocznij bezpłatny okres próbny.
Method Article
Construction of Models for Nondestructive Prediction of Ingredient Contents in Blueberries by Near-infrared Spectroscopy Based on HPLC Measurements
W tym Artykule
Podsumowanie
We present here a protocol to construct and validate models for nondestructive prediction of total sugar, total organic acid, and total anthocyanin content in individual blueberries by near-infrared spectroscopy.
Streszczenie
Nondestructive prediction of ingredient contents of farm products is useful to ship and sell the products with guaranteed qualities. Here, near-infrared spectroscopy is used to predict nondestructively total sugar, total organic acid, and total anthocyanin content in each blueberry. The technique is expected to enable the selection of only delicious blueberries from all harvested ones. The near-infrared absorption spectra of blueberries are measured with the diffuse reflectance mode at the positions not on the calyx. The ingredient contents of a blueberry determined by high-performance liquid chromatography are used to construct models to predict the ingredient contents from observed spectra. Partial least squares regression is used for the construction of the models. It is necessary to properly select the pretreatments for the observed spectra and the wavelength regions of the spectra used for analyses. Validations are necessary for the constructed models to confirm that the ingredient contents are predicted with practical accuracies. Here we present a protocol to construct and validate the models for nondestructive prediction of ingredient contents in blueberries by near-infrared spectroscopy.
Wprowadzenie
Near-infrared (NIR) spectroscopy is widely applied as a nondestructive technique to analyze contents of fruits and vegetables of various kinds.1,2 Nondestructive analyses by NIR spectroscopy enable the shipping of only delicious fruits and vegetables with guaranteed qualities. NIR spectroscopy has already been applied to orange, apple, melon, cherry, kiwi fruit, mango, papaya, peach and so on to know their Brix that corresponds to the total sugar content, acidity, TSC (total solids contents), and so on. Recently, we have reported the application of NIR spectroscopy to the quality evaluation of blueberries.3 We measured not only the total sugar content and the total organic acid content corresponding to acidity, but also the total anthocyanin content. Anthocyanin is a bioactive component which is believed to improve human health. It is convenient for consumers if they can buy delicious blueberries with an assurance of their sugar content, acidity, and anthocyanin content.
In NIR absorption spectra of fruits and vegetables, only broad absorption bands are observed. They are mainly the bands due to fiber and moisture. Although many weak bands due to various ingredients of the non-destructed target are observed simultaneously, the observed bands cannot be assigned to specific vibrational modes of specific components of the target in most cases. Therefore, the traditional technique to determine the content of a specific component using the Lambert-Beer's law is not effective for NIR spectra. Instead, calibration models to predict the contents of the target components from the observed spectra are constructed using chemometrics by examining the correlation between the observed spectra and the ingredient contents corresponding to the spectra.4,5 Here, a protocol to construct and validate the models for prediction of total sugar content, total organic acid content corresponding to acidity, and total anthocyanin content of blueberries from NIR spectra is presented.
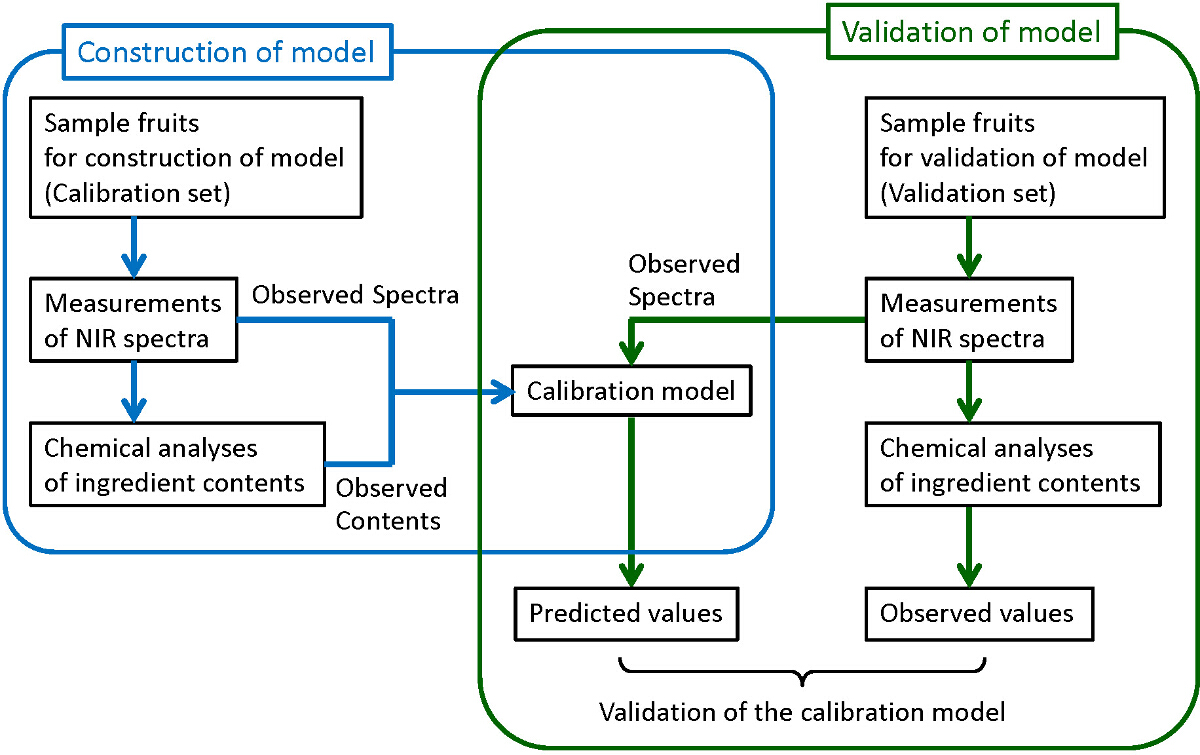
Figure 1 shows the general flow chart to construct reliable and robust calibration models. Samples of sufficient number are collected. Some of them are used for the construction of models while the others are used for the validation of the constructed models. For each of collected samples, an NIR spectrum is measured, and then the target components are analyzed quantitatively with traditional destructive chemical analysis methods. Here, high-performance liquid chromatography (HPLC) is used for the chemical analyses of sugars, organic acids, and anthocyanins. Partial least squares (PLS) regression is used for the construction of calibration models where the correlation between the observed spectra and the ingredient contents determined by chemical analyses is examined. In order to construct robust models with the best prediction ability, the pretreatments of observed spectra and the wavelength regions used for the prediction are also examined. Finally, the constructed models are validated to confirm their sufficient prediction ability. In the validation, the contents predicted from the observed spectrum by the constructed model (predicted values) are compared with the contents determined by the chemical analyses (observed values). If the sufficient correlation cannot be found between the predicted and observed values, the calibration model should be re-constructed until the sufficient correlation is obtained. Although it is preferable to use different groups of samples for the construction and validation of a model as shown in this figure (external validation), samples in a same group are used both for the construction and the validation (cross validation) when the number of samples is not large enough.

Figure 1. Flow chart for the construction and validation of the calibration model. The procedures surrounded by blue and green lines correspond, respectively, to the construction of a calibration model and its validation. Please click here to view a larger version of this figure.
Protokół
1. Collection of Samples
- Decide which cultivars will be included in the target of the calibration model.
- Collect sufficient number and various types of sample blueberries of the target cultivars.
- Collect preferably 100 blueberries for the construction of the calibration model, and at least 10 for the validation of the constructed model. In order to construct robust models, collect samples of various types, i.e. with various colors, sizes, and at various ripening conditions.
- Weigh each blueberry. Note: The weights measured are used later for the calculation of content percent of ingredients of each blueberry.
2. Measurements of Spectra
- Warm-up the spectrophotometer sufficiently (more than 1 hr) before the measurements to get reliable spectra.
- Set the spectrophotometer. Ensure that the conditions are constant all through the measurements. An example of typical conditions for measurements is given below.
- Set the range of measurements to 12,500-3,600 cm-1.
- Set the spectral resolution to 16 cm-1.
- Set the accumulation to 32 times.
- Select diffuse reflectance as the mode of measurement.
- Put the standard reflector on the window of the spectrophotometer for diffuse reflectance measurements. By using the "background single channel" command, measure the background spectrum which is automatically used for the calculation of relative reflectance spectra from the spectra of sample blueberries measured later.
- Put a blueberry sample in the center of the window of the spectrophotometer for diffuse reflectance measurements. By using the "sample single channel" command, measure spectra of each blueberry preferably at several points of the fruit.
Note: Kubelka-Munk transformation6,7 will also be performed automatically for the observed spectra of sample blueberries if the condition of spectral acquisition is set to do so. Kubelka-Munk transformation alters the spectra measured in the diffuse reflectance mode to the spectra equivalent to those measured in the transmission mode and is needed for the analyses of spectra with high accuracy. Spectra in the absorbance scale are used for analyses. - Calculate the average spectrum of the spectra of each sample using a data processing program such as MS Excel if the spectra of a blueberry sample are measured at several points. Use the averaged spectrum for analyses.
3. Pretreatment for HPLC Measurements of Sugars and Organic Acids8
Note: Extract sugars and organic acids of each blueberry, which are soluble in water, with ultrapure water as follows. The whole of each blueberry is used for analyses.
- Keep the blueberries in a freezer below -30 °C ready for chemical analyses if they are not analyzed just after the spectral measurements.
- Cut a blueberry into several pieces so it can be easily homogenized in the following steps. Cut the blueberry without defrosting when it is frozen.
- Put the pieces into a 50 ml beaker.
- Add ca. 10 ml of ultrapure water (distilled water whose electrical conductivity is less than 0.1 μS/cm) to the beaker.
- Heat the cut blueberry in ultrapure water in a microwave oven for 20 sec to deactivate the enzymes that might decompose sugars during the analyses.
- Add ca. 10 ml of ultrapure water to the beaker.
- Homogenize the mixture for 5 min at 12,000 rpm with a homogenizer equipped with a standard shaft and generator.
- Centrifuge the homogenized mixture for 10 min at 3,000 rpm (2,000 × g).
- Collect filtrate by vacuum filtration of the centrifuged sample using a 5B paper filter.
- Repeat the steps 3.6-3.9 twice on the filtration residue to collect all sugars and organic acids, and combine all filtrates.
- Measure the pH of the filtrate and adjust it to 7 with dilute hydrochloric acid (0.1 and 0.01 mol L-1) and dilute aqueous solutions of sodium hydroxide (0.1 and 0.01 mol L-1).
- Dilute the filtrate to 50 ml with ultrapure water.
- Divide the sample into two; one for the analysis of sugars and the other for the analysis of organic acids.
- Pass the first sample solution through columns (two C18, CM and QMA) connected in series to exclude pigments, cations, and anions. Throw away the first 1 ml of the sample solution from the columns. Then use the sample solution from the columns for the analysis of sugars by HPLC.
- Pass the second sample solution through columns (two C18 and CM) connected in series to exclude pigments and cations. Throw away the first 1 ml of the sample solution from the columns. Then use the sample solution from the columns for the analysis of organic acids by HPLC.
- Centrifuge each solution from steps 3.14 and 3.15 at 6,600 rpm (5,800 × g), for 10 min in a microtube equipped with a 0.45 µm filter with a mini-centrifuge before the analysis by HPLC.
4. HPLC Measurements of Sugars
Note: In this study, sum content of sucrose, glucose and fructose of each blueberry is considered as the total sugar content. Therefore, the working curve for each of three sugars is obtained first, and then sum content of the sugars in each blueberry is obtained. The standard contents are reported as 0.3-0.4 wt% (sucrose), 3.8-4.8 wt% (glucose), and 4.2-5.3 wt% (fructose).9
- Measure about 200 mg of sucrose accurately, and dissolve it in 50 ml ultrapure water to prepare a standard solution. Dilute 5 ml of the solution to 50 ml with ultrapure water to prepare the second standard solutions. Prepare similarly the third standard solution from the second standard solution.
- Prepare the standard solutions of glucose and fructose, similarly.
- Arrange the HPLC system as follows:
- Use a gel permeation column in the column oven at 40 °C.
- Use degassed ultrapure water with the flow rate of 0.1 ml/min as the eluate.
- Use a refractive index detector.
- Measure the HPLC spectrograms of standard solutions by injecting a 20 µl aliquot for each measurement. Note: Here, PAC Solution is used as the software for the measurement.
- Get the area intensity of the band of sugar on the chromatogram of each standard solution by clicking 're-analysis' with the right button of the mouse.
- Plot the area intensities against the corresponding concentrations to get the working curve for each sugar by the linear regression, where the equation representing the relation between the area intensity and the concentration is obtained for each sugar.
- Measure the HPLC spectrograms of sample solutions by injecting a 20 µl aliquot for each measurement.
- Get the area intensities of the bands of sugars on the chromatogram of each sample solution as previously described in step 4.5.
- Obtain the concentrations of the sugars in the solutions using the equations corresponding to the working curves obtained in step 4.6.
- Obtain the amount of each sugar in each blueberry from the concentrations of the sample solution obtained in the previous step and the total volume of the sample solution (50 ml, see step 3.12).
- Obtain the total sugar amounts of each fruit by summing up the contents of three sugars.
- Obtain the content percent of the total sugar of each blueberry by using the weight measured in step 1.3.
5. HPLC Measurements of Organic Acids
Note: In this study, sum content of citric acid, quinic acid, malic acid, and succinic acid are considered as the total organic acid content. Therefore, working curve for each of four organic acids is obtained first, and then the organic acid content in each blueberry is measured. The standard contents are reported as 0.42-0.62 wt% (citric acid), 0-0.15 wt% (quinic acid), 0.08-0.23 wt% (malic acid), and 0.06-0.25 wt% (succinic acid).9
- Measure about 5 mg of citric acid accurately, and dissolve it into 50 ml ultrapure water to prepare a standard solution. Dilute 5 ml of the solution to 50 ml with ultrapure water to prepare the second standard solutions. Prepare similarly the third standard solution from the second standard solution.
- Prepare the standard solutions of quinic acid, malic acid, and succinic acid, similarly.
- Arrange the HPLC system as follows:
- Use two anion-exchange columns connected in series in the column oven at 40 °C.
- Use degassed 0.1% aqueous solution of phosphoric acid with the flow rate of 0.02 ml/min as the eluate.
- Use an ultraviolet-visible detector set at 210 nm.
- Measure the HPLC spectrograms of standard solutions by injecting a 20 µl aliquot of standard solution for each measurement.
- Get the area intensity of the band of organic acid on the chromatogram of each standard solution by clicking 're-analysis' with the right button of the mouse.
- Plot the area intensities against the corresponding concentrations to get the working curve for each organic acid by the linear regression, where the equation representing the relation between the area intensity and the concentration is obtained for each organic acid.
- Measure the HPLC spectrograms of sample solutions by injecting a 20 µl aliquot of the sample for each measurement.
- Get the area intensities of the bands of organic acids on the chromatogram of each sample solution as described previously in step 5.5.
- Obtain the concentrations of the organic acids in the solutions using the equations corresponding to the working curves obtained in step 5.6.
- Obtain the amount of each organic acid in each blueberry from the concentrations of the sample solution obtained in the previous step and the total volume of the sample solution (50 ml, see step 3.12).
- Obtain the amount of total organic acid in each blueberry by summing up the contents of the four organic acids.
- Obtain the content percent of total organic acid of each blueberry by using the weight measured in step 1.3.
6. Pretreatment for HPLC Measurements of Anthocyanins
- Keep the blueberries in a freezer below -80 °C ready for chemical analyses if they are not analyzed just after the spectral measurements.
- Dry each frozen fruit with a vacuum lyophilizer for 12 hr.
- Extract anthocyanin from the dried blueberry in 1% methanol solution of trifluoroacetic acid [weight of blueberry (g)/volume of the solution (ml) = 1/10] by leaving the mixture in a refrigerator at 4 °C for 12 hr.
- Centrifuge the extract for 15 min in a 2 ml microtube using an ultracentrifuge at -8 °C and 15,000 rpm (21,900 × g).
- Filter the extract through a 0.45 µm filter to get the sample for HPLC measurements.
7. HPLC Measurements of Anthocyanins
Note: About 13 kind anthocyanins are included in blueberries. Since it is difficult to get working curves for all anthocyanins, a working curve for only cyanidin-3-O-glucoside chloride, one of the most popular anthocyanins in blueberries, is obtained. The working curve is applied for approximate quantifications of other anthocyanins.
- Measure about 1.5 mg of cyanidin-3-O-glucoside chloride accurately, and dissolve it into 10 ml of 1% methanol solution of trifluoroacetic acid to prepare a standard solution. Dilute 5 ml of the solution to 10 ml with 1% methanol solution of trifluoroacetic acid to prepare the second standard solutions. Similarly, prepare the third and the fourth standard solutions sequentially.
- Arrange the HPLC system as follows:
- Use a C18 reverse phase column in a column oven at 40 °C.
- Apply the gradient method using eluates of 0.1% aqueous trifluoroacetic acid (elute A) and 0.5% trifluoroacetic acid in acetonitrile (elute B) with the flow rate of 0.1 ml/min, where the ratio of elute B increases from 8% to 15% during 0-50 min after the injection, and from 15% to 75% during 50-60 min after the injection.
- Use a photodiode array detector monitoring at 520 nm.
- Measure the HPLC spectrograms of standard solutions by injecting a 10 µl aliquot for each measurement. "LC Solution" is used as the software for the measurement.
- Get the area intensity of the band of cyanidin-3-O-glucoside chloride on the chromatogram of each standard solution by clicking 're-analysis' with the right button of the mouse.
- Plot the area intensities against the corresponding concentrations to get the working curve for cyanidin-3-O-glucoside chloride by the linear regression, where the equation representing the relation between area intensity and concentration is obtained for cyanidin-3-O-glucoside chloride.
- Measure the HPLC spectrograms of sample solutions by injecting a 10 µl aliquot for each measurement.
- Get the area intensity of the band of each anthocyanin on the chromatogram of each sample solution as previously described in step 7.4.
- Obtain the concentrations of the anthocyanins in the solutions using the equation corresponding to the working curve obtained in step 7.5.
- Obtain the amounts of each anthocyanin in each blueberry from the concentration obtained in the previous step and the total volume of the sample solution used in step 6.3.
- Obtain the total amount of anthocyanin in each blueberry by summing up the contents of the thirteen anthocyanins.
- Obtain the content percent of the total anthocyanin of each blueberry by using the weight measured in step 1.3.
8. Construction of Calibration Models for Prediction of Ingredient Contents
Note: PLS regression,4,5 which is a kind of multiple regression technique using latent variants, is used for the construction of calibration models for each ingredient from the observed spectra and the ingredient contents determined by chemical analyses. PLS regression is performed either with the commercial programs or with the home-made programs. See references5,10 for the detailed processes of the construction of models.
- Examine which pretreatments for observed spectra are most effective for accurate and robust prediction.
- Construct calibration models by applying one or two of the following pretreatments: MSC (Multiplicative Scatter Correction),1,2,5 SNV (Standard Normal Variate),1,2,5 MMN (Min-Max Normalization), COE (Constant Offset Elimination), and the first or the second derivative calculation by SG (Savitzky-Golay) method.1,2,5 Predict the ingredient contents of the validation set from their spectra with the constructed models.
Note: In MMN, a spectrum is normalized so that the minimum and maximum values become 0 and 1, respectively. In COE, the ordinate of a spectrum is shifted so that the minimum value becomes zero. - Calculate coefficient of determination, R2, and residual predictive deviation, RPD, between the observed and predicted values of the validation set to examine which pretreatments for observed spectra are most effective. Choose the combination of pretreatments giving greater R2 and RPD.
- Construct calibration models by applying one or two of the following pretreatments: MSC (Multiplicative Scatter Correction),1,2,5 SNV (Standard Normal Variate),1,2,5 MMN (Min-Max Normalization), COE (Constant Offset Elimination), and the first or the second derivative calculation by SG (Savitzky-Golay) method.1,2,5 Predict the ingredient contents of the validation set from their spectra with the constructed models.
- Examine which wavenumber regions are effective for the accurate and robust prediction by applying, for example, moving-windows PLS technique11 to search the effective regions.
Note: The procedure corresponds to removing the wavenumber regions where spectra contain no effective information for predictions or contain information that interferes with predictions.
9. Validation of the Constructed Calibration Models
Note: See references5,10 for the detailed processes of the validation of constructed models.
- Predict ingredient contents of the validation set from their spectra with the constructed calibration models with the best combination of pretreatments and for the wavenumber regions effective for the prediction.5,10
- Calculate R2 and RPD between the observed and predicted values of the validation set.5,10
- Examine whether the general criteria for the practical performance of calibration models,12,13R2 > 0.85 and RPD > 2.5, are satisfied. Consider the reconstruction of model if the criteria are not satisfied.
Wyniki
Figure 2 shows as an example a set of NIR absorption spectra of blueberries where spectra of 70 blueberries are shown simultaneously. Since the bands definitely assignable to sugars, organic acids, or anthocyanins are not observed in the NIR spectra, traditional Lambert-Beer's law is not applicable to quantify the ingredient contents. Therefore, the construction of models for the prediction of ingredient contents is necessary.
Dyskusje
Some additional comments on the protocol are described here. Firstly, in step 1.1, it is mentioned to decide the cultivars included in the target. Although it is possible to construct models covering blueberries from many cultivars or without specifying cultivars, the prediction accuracies with the models are sometimes much lower than those with the models for a single cultivar and for limited cultivars. It should also be noted that the calibration models should be constructed for blueberries from each production site to...
Ujawnienia
We have nothing to disclose.
Podziękowania
This work was partially supported by the project "A Scheme to Revitalize Agriculture and Fisheries in Disaster Area through Deploying Highly Advanced Technology" of Ministry of Agriculture, Forestry and Fisheries, Japan.
Materiały
| Name | Company | Catalog Number | Comments |
| FT-NIR spectrophotometer | Bruker Optics GmbH | MPA | |
| High-Performance Liquid Chromatography | Shimadzu Corporation | 228-45041-91, 228-45000-31, 228-45018-31 | For sugar analysis |
| 223-04500-31, 228-45010-31, 228-45095-31 | Refractive Index Detector | ||
| High-Performance Liquid Chromatography | Shimadzu Corporation | 228-45041-91, 228-45003-31, 228-45000-31 | For organic acid analysis |
| 228-45018-31, 228-45010-31, 223-04500-31 | Ultraviolet-Visible Detector | ||
| High-Performance Liquid Chromatography | Shimadzu Corporation | 228-45041-91, 228-45018-31, 228-45000-31 | For anthocyanin analysis |
| 228-45012-31, 228-45119-31, 228-45005-31 | Photodiode Array Detector | ||
| 228-45009-31 | |||
| pH meter | Mettler-Toledo | 30019028 | S220, Automatic temperature compensation |
| Ultra-pure water treatment equipment | ORGANO Corporation | ORG-ULXXXM1; PRA-0015-0V0 | PURELAB ultra; PURELITE |
| Biomedical Freezers | SANYO | 2-6780-01 | MDF-U338 |
| Ultra-Low Temperature Freezer | Panasonic healthcare Co.,Ltd. | KM-DU73Y1 | -80 °C |
| Vacuum lyophilizer | IWAKI GLASS Co.,Ltd | 119770 | DRC-3L; FRD-82M |
| Homoginizer | Microtec Co., Ltd. | Physcotron | |
| Ultracentrifuge | Hitachi Koki Co.,Ltd | S204567 | CF15RXII |
| Mini-centrifuge | LMS CO.,LTD. | KN3136572 | MCF-2360 |
| Centrifuge | Kokusan Co.,Ltd | 2-5534-01 | H-103N |
| Filter Paper | Advantec | 1521070 | 5B, Eqivalent to Whatman 40 |
| Sep-Pak C18 column | Waters Corporation Milford | WAT020515 | |
| Sep-Pak CM column | Waters Corporation Milford | WAT020550 | |
| Sep-Pak QMA column | Waters Corporation Milford | WAT020545 | |
| Centrifugal Filter Unit | Merck Millipore Corporation | R2SA18503 | PVDF, 0.45 μm |
| Microtube | As One Corporation | 1-1600-02 | PP, 2 ml |
| Syringe Filter | GE Healthcare CO.,LTD. | 6788-1304 | PP, 0.45 μm |
| Sucrose | Wako Pure Chemical Industries,Ltd | 194-00011 | Reagent-grade |
| Glucose | Wako Pure Chemical Industries,Ltd | 049-31165 | Reagent-grade |
| Fructose | Wako Pure Chemical Industries,Ltd | 123-02762 | Reagent-grade |
| Citric acid | Wako Pure Chemical Industries,Ltd | 036-05522 | Reagent-grade |
| Malic acid | Wako Pure Chemical Industries,Ltd | 355-17971 | Reagent-grade |
| Succinic acid | Wako Pure Chemical Industries,Ltd | 190-04332 | Reagent-grade |
| Quinic acid | Alfa Aesar, A Johnson Matthey Company | 10176328 | Reagent-grade |
| Phosphoric acid | Wako Pure Chemical Industries,Ltd | 162-20492 | HPLC-grade |
| Trifluoroacetic acid | Wako Pure Chemical Industries,Ltd | 208-02746 | Reagent-grade |
| Methanol | Wako Pure Chemical Industries,Ltd | 131-01826 | Reagent-grade |
| Acetonitrile | Wako Pure Chemical Industries,Ltd | 015-08633 | HPLC-grade |
| Grade cyanidin-3-O-glucoside chloride | Wako Pure Chemical Industries,Ltd | 306-37661 | HPLC-grade |
| Software for analyses | Bruker Optics GmbH | OPUS ver. 6.5 | |
| Softoware for preprocessing | Microsoft | Excel powered by Visual Basic for Applications | |
| Software for construction of models | Freemat 4.0 | http://freemat.sourceforge.net/ |
Odniesienia
- Ozaki, Y., McClure, W. F., Christy, A. A. . Near-infrared Spectroscopy in Food Science and Technology. , (2007).
- Sun, D. W. . Infrared Spectroscopy for Food Quality Analysis and Control. , (2009).
- Bai, W., Yoshimura, N., Takayanagi, M. Quantitative analysis of ingredients of blueberry fruits by near infrared spectroscopy. J. Near Infrared Spectrosc. 22, 357-365 (2014).
- Hasegawa, T., Tasumi, M. . Chemometrics in infrared spectroscopic analysis. In: Introduction to Experimental Infrared Spectroscopy. , 97-113 (2015).
- Varmuza, K., Filzmoser, P. . Introduction to Multivariate Statistical Analysis in Chemometrics. , (2009).
- Kubelka, P. New contributions to the optics of intensely light-scattering materials. Part I. J. Opt. Soc. Am. 38, 448-457 (1948).
- Juang, R. H., Storey, D. E. Quantitative determination of the extent of neutralization of carboxylic acid functionality in carbopol 974P NF by diffuse reflectance fourier transform infrared spectrometry using Kubelka-Munk function. Pharm Res. 15, 1714-1720 (1998).
- Ogiwara, I., Ohtsuka, Y., Yoneda, Y., Sakurai, K., Hakoda, N., Shimura, I. Extraction method by water followed by microwave heating for analyzing sugars in strawberry fruits. J. Jpn. Soc. Hort. Sci. 68, 949-953 (1999).
- Che, J., Suzuki, S., Ishikawa, S., Koike, H., Ogiwara, I. Fruit ripening and quality profile of 64 cultivars in three species of blueberries grown in Tokyo. Hort. Res. (Japan). 8, 257-265 (2009).
- Pomerantsev, A. L. . Chemometrics in Excel. , (2014).
- Jiang, H. J., Berry, R. J., Siesler, H. W., Ozaki, Y. Wavelength Interval Selection in Multicomponent spectral analysis by moving window partial least-squares regression with applications to mid-infrared and near-infrared spectroscopic data. Anal. Chem. 74, 3555-3565 (2002).
- Edney, M. J., Morgan, J. E., Williams, P. C., Campbell, L. D. Analysis of feed barley by near infrared reflectance spectroscopy. J. Near-Infrared Spectrosc. 2, 33-41 (1994).
- Mathison, G. W., et al. Prediction of composition and ruminal degradability characteristics of barley straw by near infrared reflectance spectroscopy. Can. J. Anim. Sci. 79, 519-523 (1999).
- Chiara, F., et al. Analysis of anthocyanins in commercial fruit juices by using nano-liquid chromatography electrospray-mass spectrometry and high performance liquid chromatography with UV-vis detector. J. Separation Sci. 34, 150-159 (2011).
- Li, Q., et al. Antioxidant anthocyanins screening through spectrum-effect relationships and DPPH-HPLC-DAD analysis on nine cultivars of introduced rabbiteye blueberry in China. Food Chemistry. 132, 759-765 (2013).
- Sinelli, N. Evaluation of quality and nutraceutical content of blueberries (Vaccinium corymbosum L.) by near and mid-infrared spectroscopy. Postharvest Biol. Technol. 50, 31-36 (2008).
- Giusti, M. M., Wrolsted, R. E., Wrolstad, R. E., Schwartz, S. J. Anthocyanins: characterization and measurement with UV-visible spectroscopy. Current Protocols in Food Analytical Chemistry. , 1-13 (2001).
Przedruki i uprawnienia
Zapytaj o uprawnienia na użycie tekstu lub obrazów z tego artykułu JoVE
Zapytaj o uprawnieniaThis article has been published
Video Coming Soon
Copyright © 2025 MyJoVE Corporation. Wszelkie prawa zastrzeżone