
Aby wyświetlić tę treść, wymagana jest subskrypcja JoVE. Zaloguj się lub rozpocznij bezpłatny okres próbny.
Method Article
Demonstration of the Sequence Alignment to Predict Across Species Susceptibility Tool for Rapid Assessment of Protein Conservation
W tym Artykule
Podsumowanie
Here, we present a protocol to utilize the latest version of the US Environmental Protection Agency Sequence Alignment to Predict Across Species Susceptibility (SeqAPASS) tool. This protocol demonstrates the application of the online tool to rapidly analyze protein conservation and provide customizable and easily interpretable predictions of chemical susceptibility across species.
Streszczenie
The US Environmental Protection Agency Sequence Alignment to Predict Across Species Susceptibility (SeqAPASS) tool is a fast, freely available, online screening application that allows researchers and regulators to extrapolate toxicity information across species. For biological targets in model systems such as human cells, mice, rats, and zebrafish, toxicity data are available for a variety of chemicals. Through the evaluation of protein target conservation, this tool can be used to extrapolate data generated from such model systems to thousands of other species lacking toxicity data, yielding predictions of relative intrinsic chemical susceptibility. The latest releases of the tool (versions 2.0-6.1) have incorporated new features that allow for the rapid synthesis, interpretation, and use of the data for publication plus presentation-quality graphics.
Among these features are customizable data visualizations and a comprehensive summary report designed to summarize SeqAPASS data for ease of interpretation. This paper describes the protocol to guide users through submitting jobs, navigating the various levels of protein sequence comparisons, and interpreting and displaying the resulting data. New features of SeqAPASS v2.0-6.0 are highlighted. Furthermore, two use-cases focused on transthyretin and opioid receptor protein conservation using this tool are described. Finally, SeqAPASS' strengths and limitations are discussed to define the domain of applicability for the tool and highlight different applications for cross-species extrapolation.
Wprowadzenie
Traditionally, the field of toxicology has relied heavily on the use of whole-animal testing to provide the data necessary for chemical safety evaluations. Such methods are typically costly and resource-intensive. However, due to the large number of chemicals currently used and the rapid pace at which new chemicals are being developed, globally there is a recognized need for more efficient methods of chemical screening1,2. This need and the resulting paradigm shift away from animal testing has led to the development of many new approach methods, including high-throughput screening assays, high-throughput transcriptomics, next-generation sequencing, and computational modeling, which are promising alternative testing strategies3,4.
Evaluating chemical safety across the diversity of species potentially impacted by chemical exposures has been an enduring challenge, not only with traditional toxicity testing but also with new approach methods. Advances in comparative and predictive toxicology have provided frameworks for understanding the relative sensitivity of different species, and technological advances in computational methods continue to increase the applicability of these methods. Several strategies have been discussed over the last decade that leverage existing gene and protein sequence databases, along with knowledge of specific chemical molecular targets, to support predictive approaches for cross-species extrapolation and enhance chemical safety evaluations beyond the typical model organisms5,6,7,8.
To advance the science into action, build upon these foundational studies in predictive toxicology, prioritize chemical testing efforts, and support decision-making, the US Environmental Protection Agency Sequence Alignment to Predict Across Species Susceptibility (SeqAPASS) tool was created. This tool is a public and freely available web-based application that uses public repositories of constantly expanding protein sequence information to predict chemical susceptibility across the diversity of species9. Based on the principle that a species' relative intrinsic susceptibility to a particular chemical can be determined by evaluating theconservation of the known protein targets of that chemical, this tool rapidly compares protein amino acid sequences from a species with known sensitivity to all species with existing protein sequence data. This evaluation is completed through three levels of analysis, including (1) primary amino acid sequence, (2) functional domain, and (3) critical amino acid residue comparisons, each requiring more in-depth knowledge of the chemical-protein interaction and providing greater taxonomic resolution in the susceptibility prediction. A major strength of SeqAPASS is that users can customize and refine their evaluation by adding additional lines of evidence toward target conservation based on how much information is available regarding the chemical-protein or protein-protein interaction of interest.
The first version was released in 2016, which allowed users to evaluate primary amino acid sequences and functional domains in a streamlined manner to predict chemical susceptibility and contained minimal data visualization capabilities (Table 1). Individual amino acid differences have been shown to be important determinants of cross-species differences in chemical-protein interactions, which can affect species' chemical susceptibility10,11,12. Therefore, subsequent versions were developed to consider the critical amino acids that are important for direct chemical interaction13. Responding to stakeholder and user feedback, this tool has undergone annual version releases with additional new features designed to meet the needs of both researchers and regulatory communities for addressing challenges in cross-species extrapolation (Table 1). The launch of SeqAPASS version 5.0 in 2020 brought forth user-centered features that incorporate data visualization and data synthesis options, external links, summary table and report options, and graphical features. Overall, the new attributes and capabilities of this version improved data synthesis, interoperability amongst external databases, and the ease of data interpretation for predictions of cross-species susceptibility.
Access restricted. Please log in or start a trial to view this content.
Protokół
1. Getting started
NOTE: The protocol presented here is focused on tool utility and key features. Detailed descriptions of methods, features, and components can be found on the website in a comprehensive User Guide (Table 1).
Table 1: Evolution of the SeqAPASS tool. A list of features and updates added to the SeqAPASS tool from its initial deployment. Abbreviations: SeqAPASS = Sequence Alignment to Predict Across Species Susceptibility; ECOTOX = ECOTOXicology knowledgebase. Please click here to download this Table.
- Go to https://seqapass.epa.gov/seqapass using Chrome. Select either Login to use an existing account or follow instructions to create a SeqAPASS account, which will allow users to run, store, access, and customize their completed jobs.
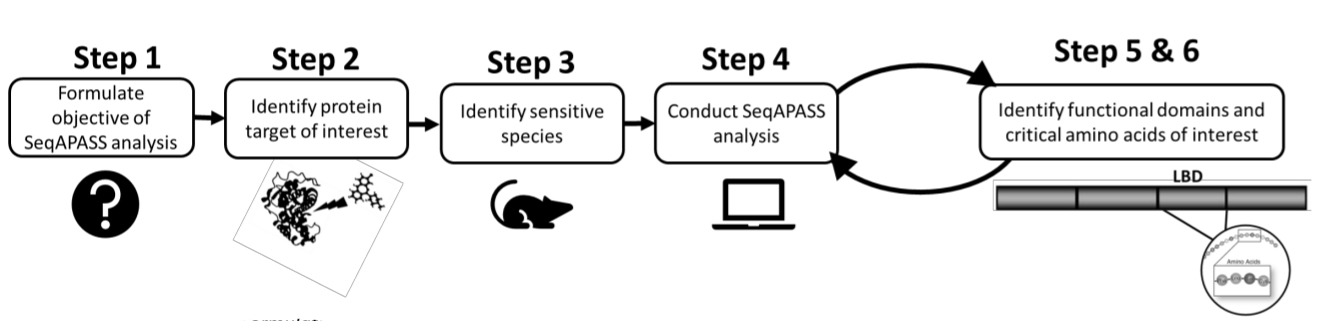
- Prior to conducting an analysis, first identify a protein of interest and a targeted or sensitive species by reviewing the existing literature or pre-existing data (Figure 1). As SeqAPASS contains links to external resources to help identify the query protein, click the drop down buttons under Identify a Protein Target to access relevant resources.

Figure 1: SeqAPASS problem formulation: schematic diagram of the preliminary information necessary for a successful analysis. Abbreviations: SeqAPASS = Sequence Alignment to Predict Across Species Susceptibility; LBD = ligand-binding domain. Please click here to view a larger version of this figure.

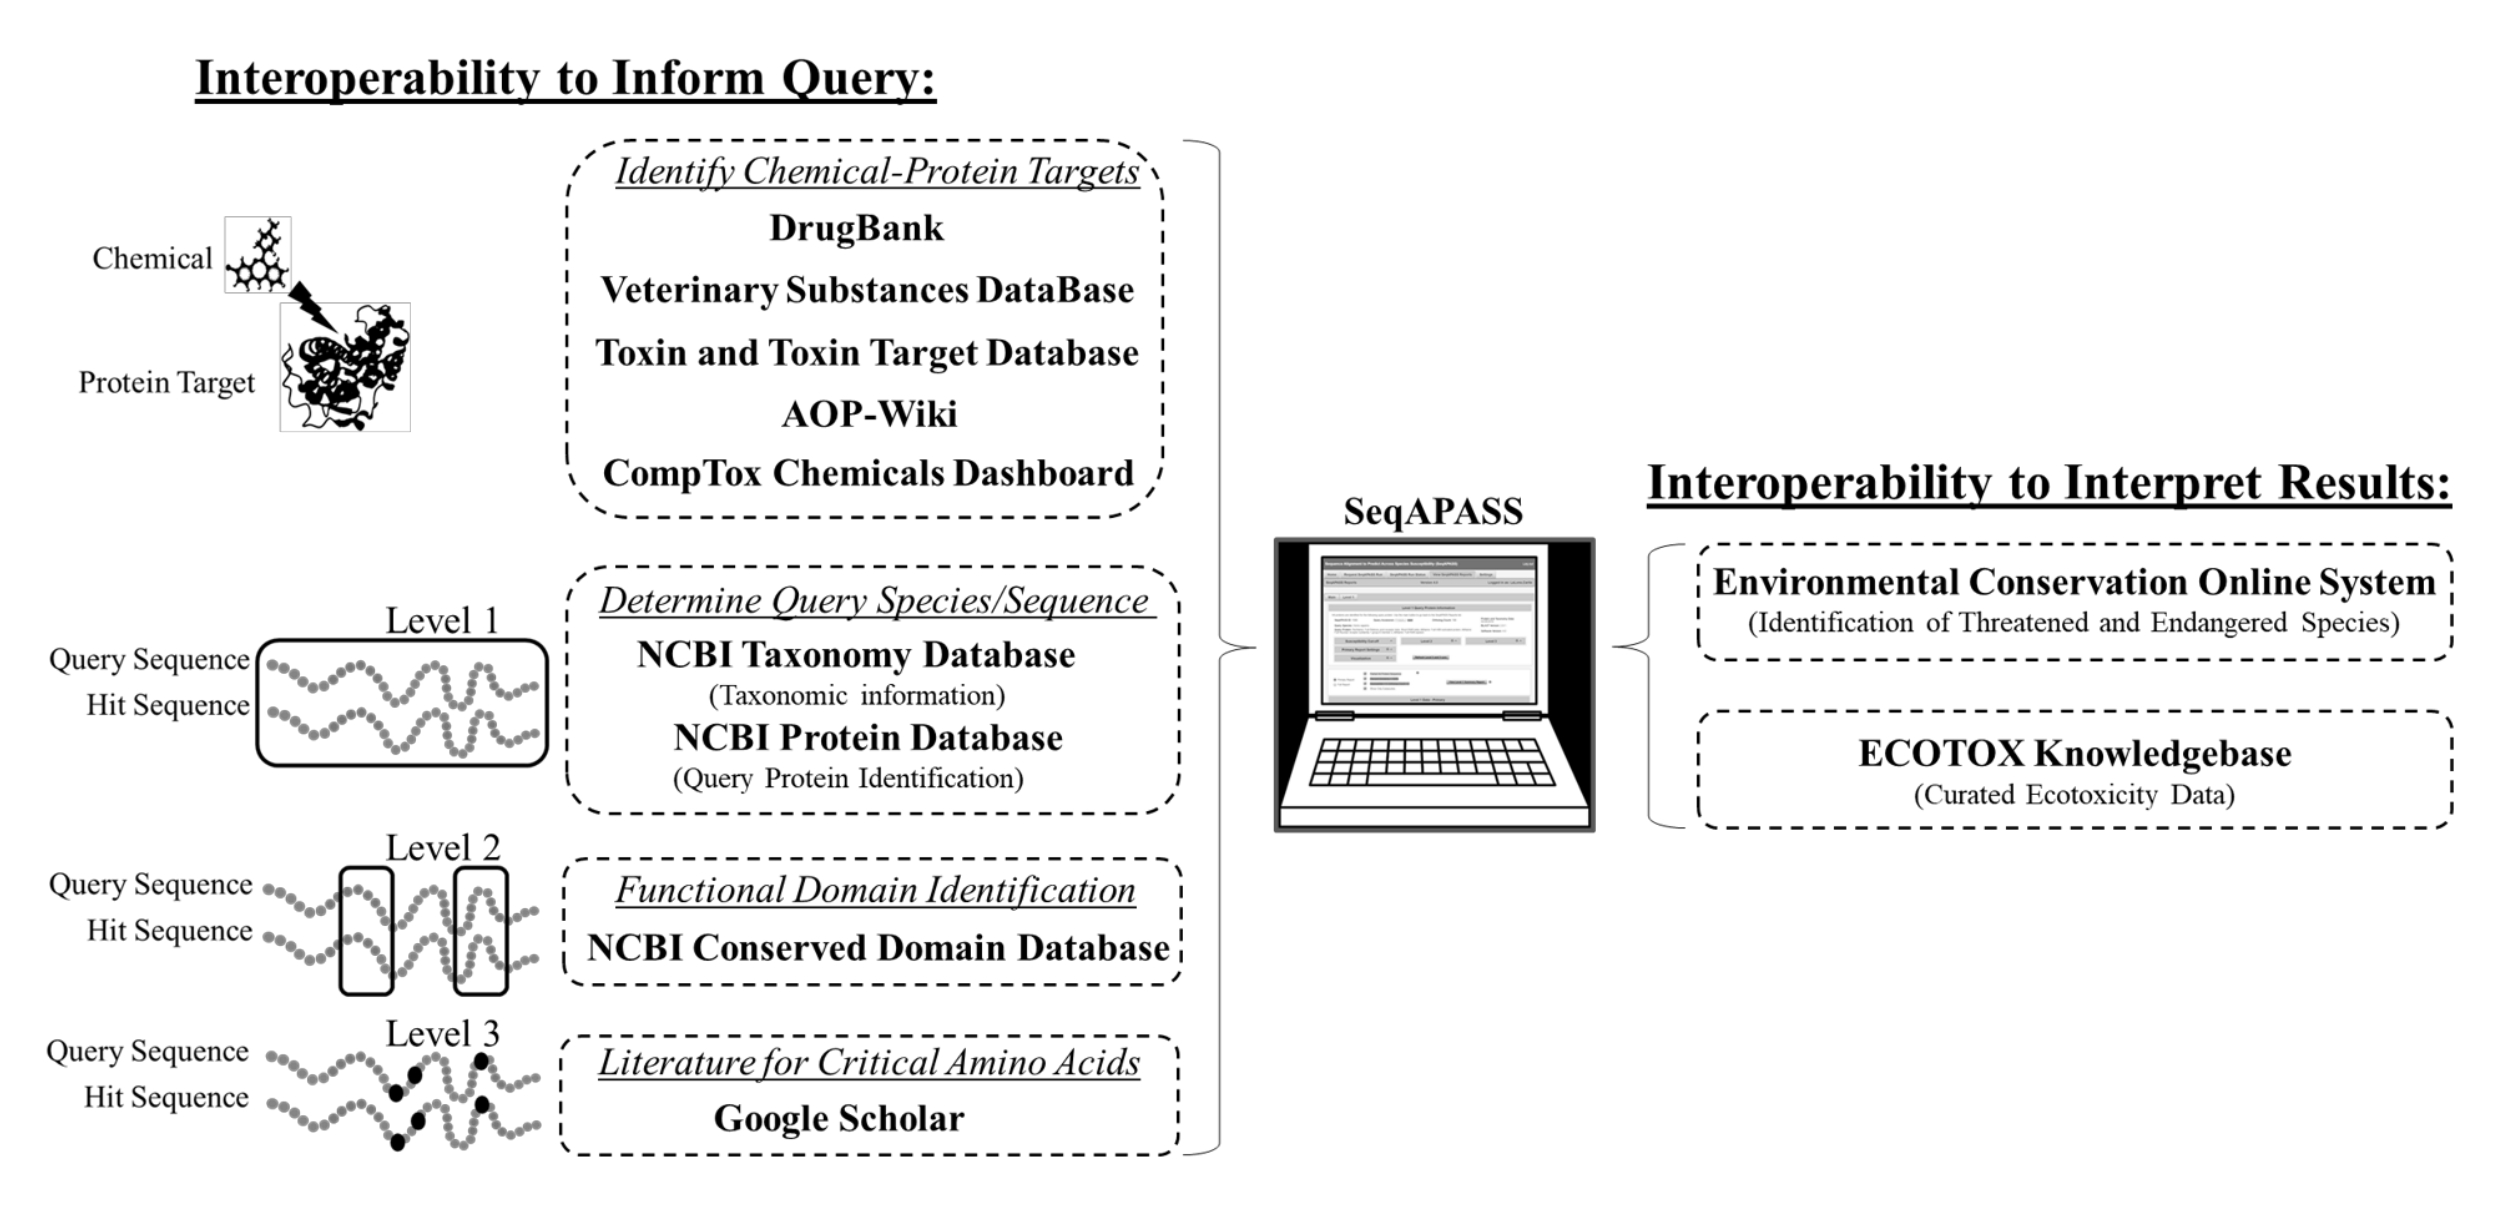
Figure 2: SeqAPASS interoperability across databases. Schematic diagram of external tools, databases, and resources integrated into SeqAPASS. Abbreviations: SeqAPASS = Sequence Alignment to Predict Across Species Susceptibility; AOP = adverse outcome pathway; NCBI = National Center for Biotechnology Information; ECOTOX = ECOTOXicology knowledgebase. Please click here to view a larger version of this figure.
Table 2: Links, resources, and tools integrated into the SeqAPASS tool. A list of the various data sources, links, and resources leveraged into the SeqAPASS tool. Abbreviation: SeqAPASS = Sequence Alignment to Predict Across Species Susceptibility. Please click here to download this Table.
2. Developing and running a SeqAPASS query: Level 1
NOTE: In a Level 1 analysis, the entire primary amino acid sequence of a query protein is compared to the primary amino acid sequences of all species with available sequence information. This tool uses algorithms to mine, collect, and compile publicly available data to rapidly align and compare amino acid sequences across species. The backend stores information from National Center for Biotechnology Information (NCBI) databases and strategically makes use of the standalone versions of the Protein Basic Local Alignment Search Tool (BLASTp)54 and the Constraint-based Multiple Alignment Tool (COBALT)55.
- Under Compare Primary Amino Acid Sequences, click either By Species or By Accession. Use the By Species selection to type or select from a list of species to choose the protein target of interest.
- Submit protein accessions (i.e., NCBI protein ID) directly by entering the accession(s) in the By Accession text box.
- Select Request Run to submit the query. Once submitted, wait for a notification to appear in the top-right corner of the browser window indicating a successful submission.
- Select the SeqAPASS Run Status tab at the top of the page to display a list of all SeqAPASS runs conducted under that user account and check the percent completion.
- Click Refresh Data while the appropriate radio button is selected to check the status of Level 2 and Level 3 runs.
- Select the View SeqAPASS Reports tab at the top of the page to access a list of all reports completed under that account.
- In the View SeqAPASS Reports tab, select the query protein of interest. Click Request Selected Report to open the Level 1 Query Protein Information page and view results, data customization options, visualizations, and summary reports.
- By default, select View Report to view data in the web browser. Alternatively, select Save Report to download raw data as a .zip file.
NOTE: The time required for a Level 1 analysis will vary (average of 23 min for version 5.1) depending on the global user demand at that point in time, the number of jobs submitted to the queue, and the amount of protein information that exists for a submitted job. If a protein target has been previously completed, data will be available in seconds upon submission.
3. Developing and running a SeqAPASS query: Level 2
NOTE: As the entire protein sequence is not directly involved in a chemical interaction, a Level 2 analysis compares only the amino acid sequence of the functional domain to make susceptibility predictions at lower taxonomic ranks (e.g., class, order, family).
- From the Level 1 Query Protein Information page, click the plus sign + next to the Level 2 header to populate the Level 2 Query menu.
- Identify the appropriate domain(s) in the protein of interest (query protein).
- If a domain has not been identified, click the integrated link to the NCBI Conserved Domains Database (CDD) (Table 1), which can aid in the identification of the appropriate domain selection.
NOTE: Typically, only specific hit domains are selected as queries in Level 2.
- If a domain has not been identified, click the integrated link to the NCBI Conserved Domains Database (CDD) (Table 1), which can aid in the identification of the appropriate domain selection.
- Click the Select Domain box to auto populate a list of functional domains for the query protein.
- Select the domain accession(s) from the dropdown list and initiate the Level 2 query by clicking the Request Domain Run button. Once submitted, wait for a notification to appear indicating a successful submission.
- Click Refresh Level 2 and 3 runs to populate Level 2 data, which will be available within seconds of submission.
- Under View Level 2 Data, select the completed domain accession(s) from the dropdown list and click the View Level 2 Data button to open the results in a new page.
4. Accessing and understanding the data: SeqAPASS Level 1 and Level 2
- Scroll to the bottom of the Query Protein Information page to view a report of the results - a Primary Report is provided with Level 1 and 2 analyses by default. Select the Full report radio button to view a more detailed report that provides all sequence hits and alignment metrics. Click on the appropriate accession/ID/name in both reports to access the transparent protein alignment and taxonomy information in the NCBI database.
- Scroll to the right side of the results table to view the ECOTOX column. Click links to the ECOTOXicology knowledgebase (ECOTOX) to rapidly gather corresponding toxicity data for species with susceptibility predictions.
NOTE: ECOTOX is a comprehensive, publicly available knowledgebase providing single chemical toxicity data for aquatic and terrestrial plants and wildlife. SeqAPASS v6.0 includes an ECOTOX widget to connect with relevant ECOTOX data more rapidly by chemical and species of interest. - Click Download Table to save the table as a spreadsheet file. Click the View Summary Report button to view and download a summary report table presenting data sorted by taxonomic group.
NOTE: Data summary tables are available for both Primary and Full Reports and provide an overview of predictions for a given target.
5. Manipulating data settings: SeqAPASS Level 1 and Level 2
NOTE: In both Level 1 and Level 2 analyses, it is assumed that the greater the protein similarity, the greater the likelihood that a chemical will interact with the protein in a similar manner to the query species/protein, making them susceptible to potential impacts of chemicals with this molecular target. Due to the similarity of these data, steps for understanding Level 1 and 2 data are outlined together in a single protocol.
- Refer to the submenus at the top of Query Protein Information to access and manipulate the report settings and use default settings for all report options for most analyses. If there is scientific justification for changing the default setting, follow these optional steps:
- (OPTIONAL) Click the plus sign + next to Susceptibility Cut-off to view and adjust the susceptibility cutoff settings in a new tab. Either select a new cutoff value from a dropdown list or enter a user-defined cutoff value.
- (OPTIONAL) Change the number in E-Value (the number of different alignments expected to occur by chance) field if something other than default is desired.
NOTE: Any protein with an E-value greater than the number in the box will be eliminated from the primary report. - (OPTIONAL) Use the Sort by Taxonomic Group option to choose the Level of taxonomic hierarchy to display in the Filtered Taxonomic Group column in the results table.
NOTE: Changing the taxonomic hierarchy will also alter the prediction of susceptibility based on the species from each filtered group that are found above the cutoff. - (OPTIONAL) Change the Common Domain (how many common domains a protein must share with the query protein to be included in results) field if something other than default is desired.
NOTE: As the default setting is 1, any sequence that does not share at least one common domain with the query protein will be excluded. - (OPTIONAL) Select No under Species Read Across to get back the susceptibility predictions of Y only if Percent Similarity is greater than or equal to the cutoff or if the hit is identified as an ortholog candidate.
NOTE: This setting defaults to Yes, meaning that a susceptibility prediction of Y will be reported for all ortholog candidates, all species listed above the susceptibility cutoff, and all species below the cutoff from the same taxonomic group with one or more species above the cutoff.
- Click the Download Current Report Settings button to download a file capturing the current settings applied.
NOTE: The specific evaluation Level (1, 2, or 3) selected will dictate the settings that are presented in the report.
6. Visualizing the data: SeqAPASS Level 1 and Level 2
- Click the plus sign + next to Visualization and click the Visualize Data button to open a separate tab displaying the user-defined information and the option to select an interactive graph of results.
- Click Boxplot to open the interactive boxplot and plot controls and allow the boxplot visualization to actively update to reflect changes to the data table and provide publication- and presentation-quality graphics.
NOTE: The default boxplot displays species groups on the x-axis and percent similarity on the y-axis. Boxplots display the susceptibility cutoff (dashed line), percent similarity across species compared to the query species, and mean and median values for each taxonomic group along with the 25th and 75th percentiles and interquartile range. Depending on the objective of the analysis and the user's needs, many boxplot features can be modified through the following optional steps.- (OPTIONAL) To customize the displayed taxonomic groups, refer to the Taxonomic Groups box under the Controls section. Remove groups by scrolling over the names and selecting x or by using the Taxonomic Groups dropdown menu.
- (OPTIONAL) To add a legend that will pinpoint a species of interest or specific predefined groups (e.g., endangered or threatened species), hover over a taxonomic group name on the x-axis to activate a pop-up box listing the top three species ordered by highest percent similarity. Hover over species in the legend to generate a pop-up box with the corresponding species information. Click on the box for a specific taxonomic group to generate a downloadable summary table listing species and predictions.
- Click Download Boxplot to choose a file type, customize the width/height resolution, and save the visualization.
7. Developing and running a SeqAPASS analysis: Level 3
NOTE: A Level 3 analysis assesses user-identified amino acid residues within the query protein and rapidly compares the conservation of these residues across species. Species in which these residues are conserved are assumed to be more likely to interact with a chemical in a similar manner to the template species/protein. As Level 3 focuses on individual amino acids, an analysis can only be performed when detailed knowledge of the amino acid residues critical to the chemical-protein or protein-protein interaction is available.
- Click the plus sign + next to the Level 3 header on the Level 1 Query Protein Information page to populate the Level 3 Query menu.
- Click the plus sign + next to the Reference Explorer to open the reference explorer tool, which generates a predefined Boolean string to query the available literature and aids users in identifying appropriate literature to support the identification of critical amino acids to be used in the Level 3 evaluation (Table 2 and Figure 2).
- (OPTIONAL) Once the query protein auto populates, use the Add Protein Name function to add additional proteins.
- Click the Generate Google Scholar Link to open a pop-up containing an autogenerated search string that includes relevant search terms.
- Click Search Google Scholar to query the literature database using the search string.
- Alternatively, click Copy to Clipboard and customize the search string by adding or removing terms using the functions in Reference Explorer.
8. Identify critical amino acid residues using identified literature
- Select the template sequence to which user-selected species will be aligned in the Level 3 Query menu.
NOTE: This template sequence is commonly chosen based on the literature for which the critical amino acids were identified and can be the same or a different species than those queried in Level 1 and Level 2.- (OPTIONAL) Use the Additional Comparisons box to compare any accessions/sequences that do not appear in the Primary/Full Report tables.
- Enter a user-defined name for the Level 3 run in the Enter Level 3 Run Name text box to identify the completed Level 3 run. Choose a unique name for each evaluation.
- Select the taxonomic group of interest in the Choose Taxonomic Group(s) field. Select a taxonomic group to auto filter the table by that taxonomic group.
- In the results table, manually click the checkbox beside any species to be aligned to the template sequence.
NOTE: To ensure appropriate alignment, one taxonomic group at a time should be compared to the template. Only select similarly annotated proteins for the species of interest. When selecting sequences for comparison, it is important to pay attention to certain sequences (e.g., hypothetical, LOW QUALITY, or partial). Unless there is transparent justification for inclusion, it is best to exclude these sequences as they may distort predictions due to incomplete or inappropriate sequence information. - Repeat steps to align all taxonomic groups of interest.
- Click Refresh Level 2 and 3 runs once all species have been aligned to populate the Select Level 3 Run Name menu with the completed Level 3 jobs and get the data from a Level 3 alignment immediately.
- Click Combine Level 3 Data to combine alignments from multiple taxonomic groups.
- Alternatively, to view a single report, select the user-defined name under Choose Query to View and click View Level 3 Data.
- Select the Level 3 template to be used as the basis for amino acid residue comparison within the Combine Level 3 Reports menu and click Next.
- In Level 3 jobs, select completed jobs for comparison and click Next. Use the Order Level 3 Jobs function to reorder the taxonomic groups if desired. Click View Level 3 Data to produce a Level 3 report page with the combined taxonomic groups aligned.
- Select previously identified amino acid positions for the template species by typing in the amino acid position(s), separated by commas, in the Enter Amino Acid Residue Positions box and then selecting Copy to Residue List. Directly select residues in the template sequence from the shuttle box.
- Click Update Report to refresh the page and display the Level 3 susceptibility predictions.
NOTE: Level 3 uses a simple set of rules derived from basic descriptors of side-chain functional properties (e.g., aliphatic, aromatic) and molecular dimensions (molecular weight differences >30 g/mol) to determine whether differences at key positions are likely to affect protein interactions13.
9. Visualizing Level 3 SeqAPASS data
NOTE: As in previous Levels, Primary and Full reports are available. In addition to data identical to the data in Level 1 and 2, the Primary Report displays amino acid positions, abbreviations, and a yes/no (Y/N) similar susceptibility as the template prediction. Similarly, the Full Report contains information on amino acid side chain classification and molecular weight.
- On the Level 3 report page, scroll to the bottom to view a report of the results. Click Download Table at the bottom of the report to save the table.
- Click View Level 3 Summary Report to view and download a summary report table presenting data sorted by taxonomic group. Click the plus sign + next to Visualization on the Level 3 Report page to open a separate browser tab displaying the user-defined information and the option to view results in the form of an interactive heat map.
- Click Heat Map on the Visualization Information page to open the interactive graphic and controls and allow the heat map visualization to actively update to reflect changes to the data table. Perform the following optional steps to customize the heat map.
- (OPTIONAL) Select Report Options to change between a Simple Report, which displays the amino acid position, one-letter abbreviation, and amino acid similarity, or a Full Report, which displays detailed information on each amino acid selected.
- (OPTIONAL) Select Report Options to change how species are displayed, either by Common Name or Scientific Name.
NOTE: Within the Simple Report, amino acids are categorized as a Total Match (dark blue), Partial Match (light blue, substitutions meeting only one criterion), or Not a Match (yellow, substitutions meeting neither criteria) to the template amino acid. The Full Report displays comparisons as either a Total Match (dark blue) or Not a Match (yellow). - (OPTIONAL) Select Optional Selections to highlight useful information such as Ortholog Candidates, Threatened Species, Endangered Species, or Common Model Organisms.
- (OPTIONAL) Select Heat Map Settings to select additional customization options, including adding or removing columns, legends, and text.
- Click Download Boxplot to choose a file type and save the visualization.
10. Interpretation of SeqAPASS Results: Lines of evidence for protein conservation
NOTE: For ease of interpretation, this tool includes a Decision Summary Report (DS Report) designed to integrate data across Levels. The DS Report contains the results (i.e., data tables and/or visualizations) that the user has selected and allows for the quick evaluation of susceptibility predictions across multiple Levels for multiple species simultaneously.
- Click Push Level # to DS Report from the results or data visualization pages and wait for the data to be "pushed" and the DS Report tab to become active.
NOTE: If results or any changes have not been pushed to the DS Report, Push Level # to DS Report will remain active until selected. If a setting has been changed, the text Click to push new changes will appear until the changes are pushed to the report. Visualizations can be pushed to the DS Report any time during the evaluation. - Select the DS Report tab at any time to access the DS page.
NOTE: For all species aligned in Level 1, the Final Decision Summary Report table contains the important data and susceptibility predictions for each analysis. If a species in the DS table was not included in the Level 3 report but was found in Level 1 and/or Level 2 jobs, the cell in the table will receive a not applicable (NA) designation for the Level 3 susceptibility prediction.
Access restricted. Please log in or start a trial to view this content.
Wyniki
To demonstrate the application of the SeqAPASS tool and highlight new features, two case studies are described representing instances in which protein conservation predicts that there are differences in chemical susceptibility across species (human transthyretin) and that there are no differences (µ opioid receptor [MOR]). The first of these examples addresses protein sequence/structural comparisons to predict the domain of applicability for adverse outcome pathways (AOPs, see Table 2 for definition...
Access restricted. Please log in or start a trial to view this content.
Dyskusje
There is widespread recognition that it is not feasible to empirically test enough species to capture the genomic, phenotypic, physiological, and behavioral diversity of living organisms that may be exposed to chemicals of toxicological interest. The goal of SeqAPASS is to maximize the use of existing and continuously expanding protein sequence and structural data to aid and inform the extrapolation of chemical toxicity data/knowledge from tested organisms to hundreds or thousands of other species through molecular-level...
Access restricted. Please log in or start a trial to view this content.
Ujawnienia
The authors have no conflicts of interest to disclose.
Podziękowania
The authors thank Dr. Daniel L. Villeneuve (U.S. EPA, Center for Computational Toxicology and Exposure) and Dr. Jon A. Doering (Department of Environmental Sciences, Louisiana State University) for providing comments on an earlier draft of the manuscript. This work was supported by the U.S. Environmental Protection Agency. The views expressed in this paper are those of the authors and do not necessarily reflect the views or policies of the U.S. Environmental Protection Agency, nor does the mention of trade names or commercial products indicate endorsement by the federal government.
Access restricted. Please log in or start a trial to view this content.
Materiały
| Name | Company | Catalog Number | Comments |
| Spreadsheet program | N/A | N/A | Any program that can be used to view and work with csv files (e.g. Microsoft Excel, OpenOffice Calc, Google Docs) can be used to access data export files. |
| Basic computing setup and internet access | N/A | N/A | SeqAPASS is a free, online tool that can be easily used via an internet connection. No software downloads are required. |
Odniesienia
- Krewski, D., et al. Toxicity testing in the 21st century: a vision and a strategy. Journal of Toxicology and Environmental Health, Part B. 13 (2-4), 51-138 (2010).
- Wang, Z., Walker, G. W., Muir, D. C. G., Nagatani-Yoshida, K. Toward a global understanding of chemical pollution: A first comprehensive analysis of national and regional chemical inventories. Environmental Science & Technology. 54 (5), 2575-2584 (2020).
- Brooks, B. W., et al. Toxicology advances for 21st century chemical pollution. One Earth. 2 (4), 312-316 (2020).
- Kostal, J., Voutchkova-Kostal, A. Going all in: A strategic investment in in silico toxicology. Chemical Research in Toxicology. 33 (4), 880-888 (2020).
- Cheng, W., Doering, J. A., LaLone, C., Ng, C. Integrative computational approaches to inform relative bioaccumulation potential of per- and polyfluoroalkyl substances (PFAS) across species. Toxicology Sciences. 180 (2), 212-223 (2021).
- Kostich, M. S., Lazorchak, J. M. Risks to aquatic organisms posed by human pharmaceutical use. Science of the Total Environment. 389 (2-3), 329-339 (2008).
- Gunnarsson, L., Jauhiainen, A., Kristiansson, E., Nerman, O., Larsson, D. G. Evolutionary conservation of human drug targets in organisms used for environmental risk assessments. Environmental Science & Technology. 42 (15), 5807-5813 (2008).
- LaLone, C. A., et al. Evidence for cross species extrapolation of mammalian-based high-throughput screening assay results. Environmental Science & Technology. 52 (23), 13960-13971 (2018).
- LaLone, C. A., et al. Editor's highlight: Sequence Alignment to Predict Across Species Susceptibility (SeqAPASS): A web-based tool for addressing the challenges of cross-species extrapolation of chemical toxicity. Toxicology Sciences. 153 (2), 228-245 (2016).
- Head, J. A., Hahn, M. E., Kennedy, S. W. Key amino acids in the aryl hydrocarbon receptor predict dioxin sensitivity in avian species. Environmental Science & Technology. 42 (19), 7535-7541 (2008).
- Bass, C., et al. Mutation of a nicotinic acetylcholine receptor β subunit is associated with resistance to neonicotinoid insecticides in the aphid Myzus persicae. BMC Neuroscience. 12, 51-51 (2011).
- Erdmanis, L., et al. Association of neonicotinoid insensitivity with a conserved residue in the loop d binding region of the tick nicotinic acetylcholine receptor. Biochemistry. 51 (23), 4627-4629 (2012).
- Doering, J. A., et al. et al. In silico site-directed mutagenesis informs species-specific predictions of chemical susceptibility derived from the Sequence Alignment to Predict Across Species Susceptibility (SeqAPASS) tool. Toxicology Sciences. 166 (1), 131-145 (2018).
- Noyes, P. D., et al. Evaluating chemicals for thyroid disruption: Opportunities and challenges with in vitro testing and adverse outcome pathway approaches. Environmental Health Perspectives. 127 (9), 95001(2019).
- Park, G. Y., Jamerlan, A., Shim, K. H., An, S. S. A. Diagnostic and treatment approaches involving transthyretin in amyloidogenic diseases. Int J Mol Sci. 20 (12), 2982(2019).
- Rabah, S. A., Gowan, I. L., Pagnin, M., Osman, N., Richardson, S. J. Thyroid hormone distributor proteins during development in vertebrates. Front Endocrinol (Lausane). 10, 506(2019).
- Richardson, S. J. Cell and molecular biology of transthyretin and thyroid hormones. International Review of Cytology. 258, 137-193 (2007).
- Yamauchi, K., Ishihara, A. Transthyretin and Endocrine Disruptors. Recent Advances in Transthyretin Evolution, Structure and Biological Functions. Richardson, S. J., Cody, V. , Springer. Berlin Heidelberg, Germany. 159-171 (2009).
- Iakovleva, I., et al. Tetrabromobisphenol A is an efficient stabilizer of the transthyretin tetramer. PLoS One. 11 (4), 0153529(2016).
- Ishihara, A., Sawatsubashi, S., Yamauchi, K. Endocrine disrupting chemicals: Interference of thyroid hormone binding to transthyretins and to thyroid hormone receptors. Molecular and Cellular Endocrinology. 199 (1), 105-117 (2003).
- Kar, S., Sepúlveda, M. S., Roy, K., Leszczynski, J. Endocrine-disrupting activity of per- and polyfluoroalkyl substances: Exploring combined approaches of ligand and structure based modeling. Chemosphere. 184, 514-523 (2017).
- Morais-de-Sa, E., Pereira, P. J., Saraiva, M. J., Damas, A. M. The crystal structure of transthyretin in complex with diethylstilbestrol: A promising template for the design of amyloid inhibitors. Journal of Biological Chemistry. 279 (51), 53483-53490 (2004).
- Morgado, I., Campinho, M. A., Costa, R., Jacinto, R., Power, D. M. Disruption of the thyroid system by diethylstilbestrol and ioxynil in the sea bream (Sparus aurata). Aquatic Toxicology. 92 (4), 271-280 (2009).
- Yamauchi, K., Prapunpoj, P., Richardson, S. J. Effect of diethylstilbestrol on thyroid hormone binding to amphibian transthyretins. General and Comparative Endocrinology. 119 (3), 329-339 (2000).
- Zhang, J., et al. Structure-based virtual screening protocol for in silico identification of potential thyroid disrupting chemicals targeting transthyretin. Environmental Science & Technology. 50 (21), 11984-11993 (2016).
- Ren, X. M., et al. Binding interactions of perfluoroalkyl substances with thyroid hormone transport proteins and potential toxicological implications. Toxicology. 366-367, 32-42 (2016).
- Wilson, N., Mbabazi, K., Seth, P., Smith, H., Davis, N. L. Drug and opioid-involved overdose deaths - United States, 2017-2018. Morbidity and Mortality Weekly Report. 69 (11), 290-297 (2020).
- EPA. National Pollutant Discharge Elimination System (NPDES). United States Environmental Protection Agency. , Available from: https://www.epa.gov/npdes/npdes-resources (2018).
- Duvallet, C., Hayes, B. D., Erickson, T. B., Chai, P. R., Matus, M. Mapping community opioid exposure through wastewater-based epidemiology as a means to engage pharmacies in harm reduction efforts. Preventing Chronic Disease. 17, 200053(2020).
- Gushgari, A. J., Venkatesan, A. K., Chen, J., Steele, J. C., Halden, R. U. Long-term tracking of opioid consumption in two United States cities using wastewater-based epidemiology approach. Water Research. 161, 171-180 (2019).
- Lau, B., Bretaud, S., Huang, Y., Lin, E., Guo, S. Dissociation of food and opiate preference by a genetic mutation in zebrafish. Genes Brain Behave. 5 (7), 497-505 (2006).
- Bossé, G. D., Peterson, R. T. Development of an opioid self-administration assay to study drug seeking in zebrafish. Behavioural Brain Research. 335, 158-166 (2017).
- Mottaz, H., et al. Dose-dependent effects of morphine on lipopolysaccharide (LPS)-induced inflammation, and involvement of multixenobiotic resistance (MXR) transporters in LPS efflux in teleost fish. Environmental Pollution. 221, 105-115 (2017).
- Manglik, A., et al. Crystal structure of the µ-opioid receptor bound to a morphinan antagonist. Nature. 485 (7398), 321-326 (2012).
- Comer, S. D., Cahill, C. M. Fentanyl: Receptor pharmacology, abuse potential, and implications for treatment. Neuroscience & Biobehavioral Reviews. 106, 49-57 (2019).
- Podlewska, S., Bugno, R., Kudla, L., Bojarski, A. J., Przewlocki, R. Molecular modeling of µ opioid receptor ligands with various functional properties: PZM21, SR-17018, morphine, and fentanyl-simulated interaction patterns confronted with experimental data. Molecules. 25 (20), 4636(2020).
- Huang, W., et al. Structural insights into µ-opioid receptor activation. Nature. 524 (7565), 315-321 (2015).
- Lipiński, P. F. J., et al. Fentanyl family at the mu-opioid receptor: Uniform assessment of binding and computational analysis. Molecules. 24 (4), 740(2019).
- Boland, L. A., Angles, J. M. Feline permethrin toxicity: Retrospective study of 42 cases. Journal of Feline Medicine and Surgery. 12 (2), 61-71 (2010).
- Stevenson, B. J., Pignatelli, P., Nikou, D., Paine, M. J. Pinpointing P450s associated with pyrethroid metabolism in the dengue vector, Aedes aegypti: developing new tools to combat insecticide resistance. PLoS Neglected Tropical Diseases. 6 (3), 1595(2012).
- Ankley, G. T., Gray, L. E. Cross-species conservation of endocrine pathways: A critical analysis of tier 1 fish and rat screening assays with 12 model chemicals. Environmental Toxicology and Chemistry. 32 (5), 1084-1087 (2013).
- Meteyer, C. U., Rideout, B. A., Gilbert, M., Shivaprasad, H. L., Oaks, J. L. Pathology and proposed pathophysiology of diclofenac poisoning in free-living and experimentally exposed oriental white-backed vultures (Gyps bengalensis). Journal of Wildlife Diseases. 41 (4), 707-716 (2005).
- EPA. ECOTOX User Guide: ECOTOXicology Knowledgebase System. EPA, United States Environmental Protection Agency. , Available from: https://cfpub.epa.gov/ecotox/index.cfm (2021).
- ECOS Environmental Conservation Online System. U.S. Fish & Wildlife Service. , Available from: https://ecos.fws.gov/ecp/ (2021).
Access restricted. Please log in or start a trial to view this content.
Przedruki i uprawnienia
Zapytaj o uprawnienia na użycie tekstu lub obrazów z tego artykułu JoVE
Zapytaj o uprawnieniaThis article has been published
Video Coming Soon
Copyright © 2025 MyJoVE Corporation. Wszelkie prawa zastrzeżone