
Aby wyświetlić tę treść, wymagana jest subskrypcja JoVE. Zaloguj się lub rozpocznij bezpłatny okres próbny.
Method Article
Multimodal Analytical Platform on a Multiplexed Surface Plasmon Resonance Imaging Chip for the Analysis of Extracellular Vesicle Subsets
W tym Artykule
Podsumowanie
This paper proposes a new generation of multiparametric analytical platforms with increased throughput for the characterization of extracellular vesicle subsets. The method is based on a combination of multiplexed biosensing methods with metrological and morphomechanical analyses by atomic force microscopy, coupled with Raman spectroscopy, to qualify vesicular targets trapped on a microarray biochip.
Streszczenie
Extracellular vesicles (EVs) are membrane-derived, tiny vesicles produced by all cells that range from 50 to several hundreds of nanometers in diameter and are used as a means of intercellular communication. They are emerging as promising diagnostic and therapeutic tools for a variety of diseases. There are two main biogenesis processes used by cells to produce EVs with differences in size, composition, and content. Due to their high complexity in size, composition, and cell origin, their characterization requires a combination of analytical techniques. This project involves the development of a new generation of multiparametric analytical platforms with increased throughput for the characterization of subpopulations of EVs. To achieve this goal, the work starts from the nanobioanalytical platform (NBA) established by the group, which allows an original investigation of EVs based on a combination of multiplexed biosensing methods with metrological and morphomechanical analyses by atomic force microscopy (AFM) of vesicular targets trapped on a microarray biochip. The objective was to complete this EV investigation with a phenotypic and molecular analysis by Raman spectroscopy. These developments enable the proposal of a multimodal and easy-to-use analytical solution for the discrimination of EV subsets in biological fluids with clinical potential
Wprowadzenie
The growing interest in EV research in diagnosis and in therapeutics1,2,3,4,5, combined with the challenges this field faces, has resulted in the development and implementation of a large variety of approaches and techniques for quantifying or characterizing these vesicles. The most widely used methods for EV identification are protein-specific immunoblotting and proteomics to confirm the origin of EVs, transmission electron microscopy (TEM) to confirm their structure, and nanoparticle tracking analysis (NTA) to quantify their number and size distribution in a sample volume.
None of these techniques on their own, however, give all the information required to characterize EV subsets. The inherent heterogeneity of EVs due to the diversity in their biochemical and physical properties impedes global analyses that are reliable and reproducible, especially for EVs contained in a mixture (crude sample). Detection and characterization methods are, therefore, needed for EVs, both individually and generally to complement other methods that are faster but not selective6.
High-resolution imaging by TEM (or cryoTEM) or AFM allows the determination of the morphology and metrology of EVs with a nanometric resolution7,8,9,10,11,12. However, the main limitation of the use of electron microscopy for biological objects, such as EVs, is the need for a vacuum to carry out the study which requires the fixation and dehydration of the sample. Such preparation makes it difficult to translate from the structures observed to the in-solution EV morphology. To avoid this dehydration of the sample, the technique of cryoTEM is the most suitable for EV characterization13. It is widely used for determining the ultrastructure of EVs. The immunolabeling of vesicles by biofunctionalized gold nanoparticles also makes it possible to identify specific subpopulations of EVs and distinguish them from other particles present in a complex biological sample. However, due to the low number of EVs analyzed by electronic microscopy, it is often difficult to perform a characterization that is representative of a complex and heterogeneous sample.
To reveal this size heterogeneity, the International Society for Extracellular Vesicles (ISEV) suggests analyzing a sufficient number of widefield images, accompanied by smaller images, to reveal individual EVs with high resolution14. AFM is an alternative to optical approaches and electronic diffraction techniques for the study of EVs. This technique uses a sharp tip held by a flexible cantilever that scans the sample deposited on one support, line by line, and adjusts the distance between the tip and the elements present through a feedback loop. This makes it possible to characterize the topography of the sample and collect morphomechanical information15,16,17,18. The EVs can be scanned by AFM either after being deposited on an atomically flat substrate or after having been captured on a specific substrate functionalized by antibodies, peptides, or aptamers to characterize the various subpopulations18,19. Due to its ability to quantify and simultaneously probe the structure, biomechanics, and membranous biomolecular content of EVs within complex biological samples without the need for pretreatment, labeling, or dehydration, AFM is now increasingly used to characterize EVs in a fine and multiparametric manner under physiological conditions of temperature and medium.
This paper proposes a methodology using a core gold biochip capable of being (bio)chemically functionalized in a multiplexed format. This substrate is the cornerstone of a powerful analytical platform combining the biodetection of EV subsets by surface plasmon resonance, and once the EVs are adsorbed/grafted or immunocaptured on the chip, AFM enables the metrological and morphomechanical characterization of the EVs. Coupled with the Raman signature of the EV subsets captured on the chip, this analytical platform enables the qualification of the EVs present in biological samples in a label-free manner and without any need for preanalytical steps. This paper shows that the combination of powerful techniques, assisted by a highly rigorous methodology in substrate preparation and data acquisition, makes the EV analysis deep, definitive, and robust.
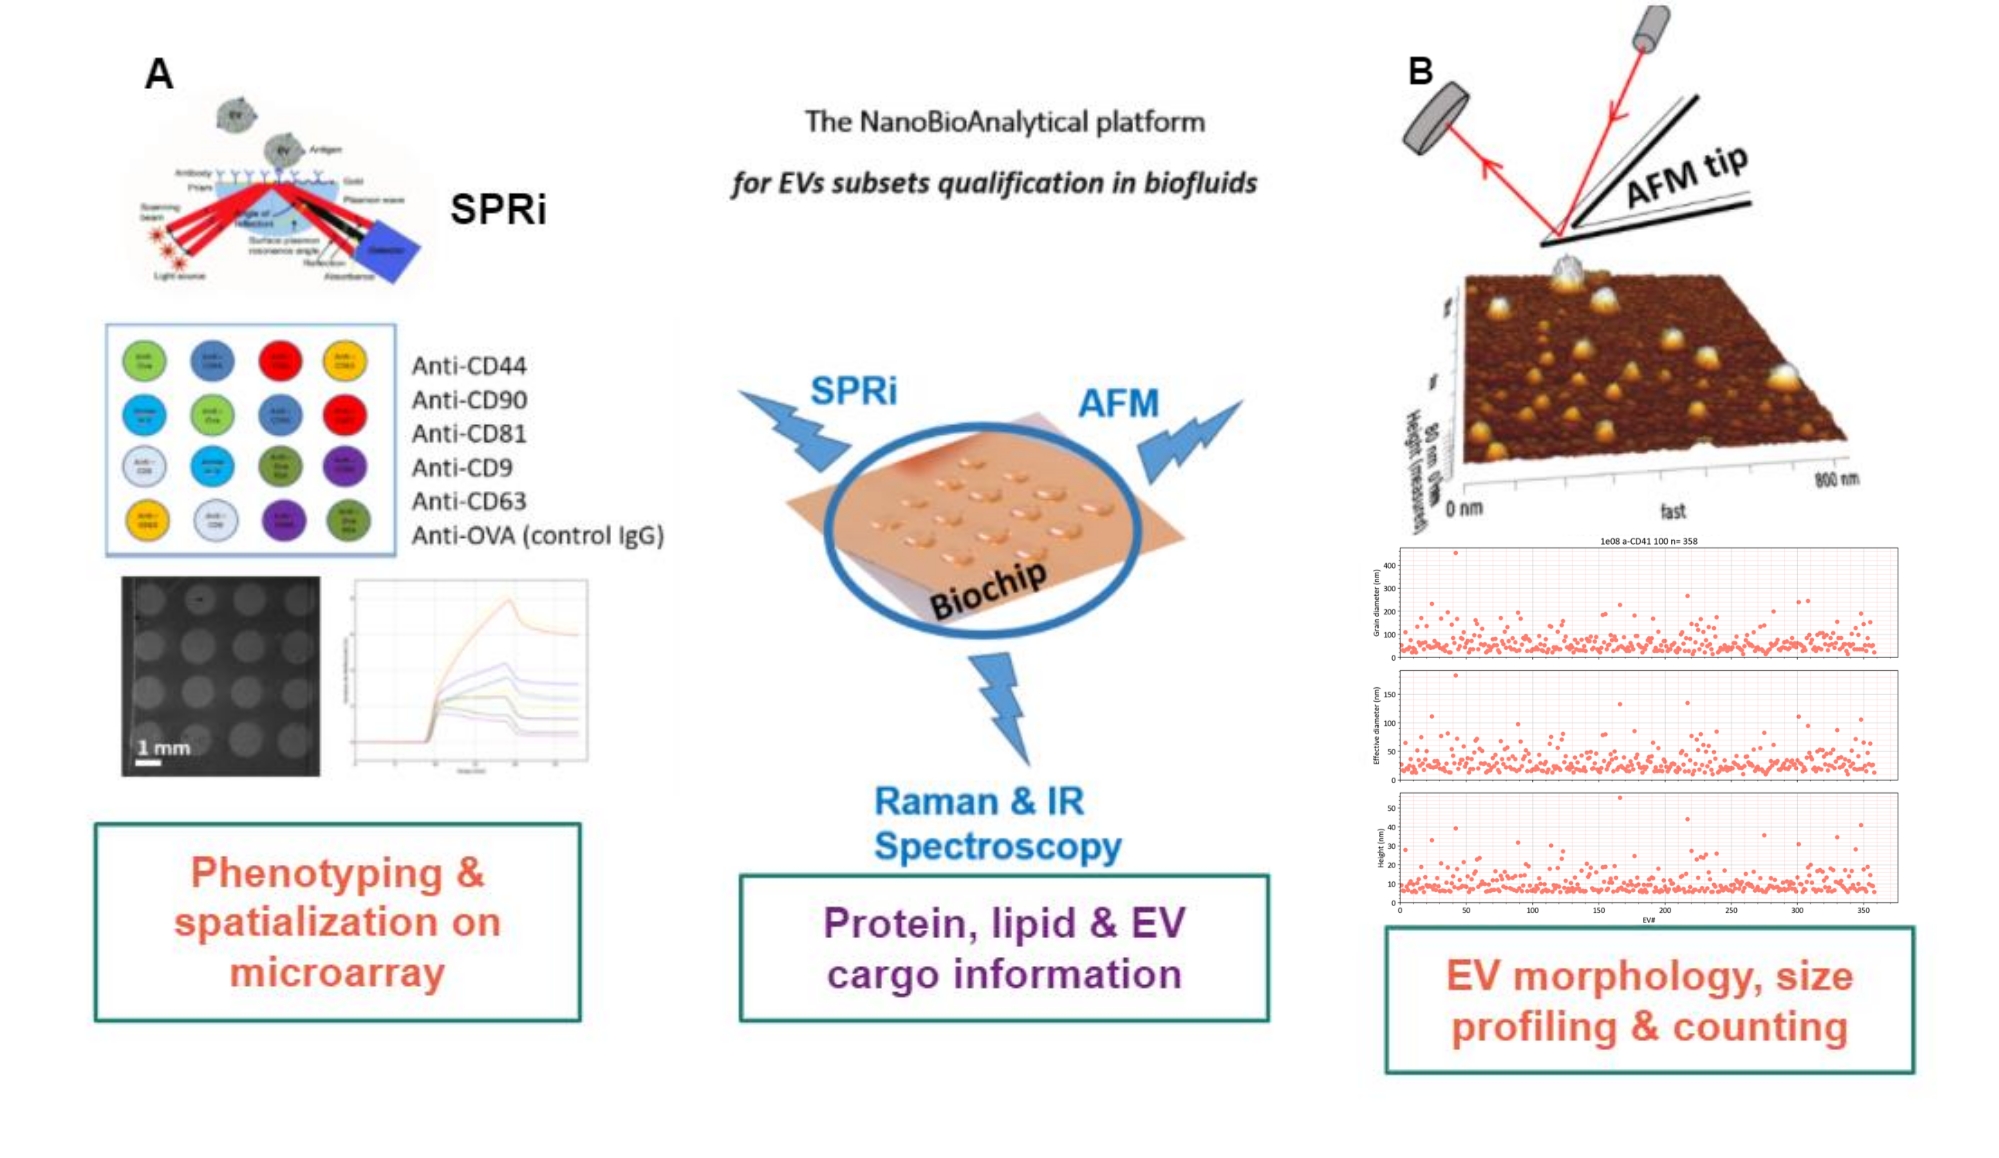
The principle of the proposed approach is to prepare a gold substrate, to adsorb/graft or capture the EV subtypes, and to scan them by AFM to estimate the size and morphology of each EV subset. Additionally, those adsorbed EVs are analyzed by Raman spectroscopy. This substrate can, indeed, present three types of interfaces of growing complexity: naked, chemically functionalized, or ligand microarrays. Before describing the different steps of the protocol, readers are referred to the schematic presentation of the nanobioanalytical platform (NBA) approach in Figure 1, combining surface plasmon resonance imaging (SPRi), AFM, and spectroscopy.

Figure 1: The NanoBioAnalytical platform. The approach combines (A) surface plasmon resonance imaging, (B) atomic force microscopy, and infrared/Raman (nano)spectroscopy, all engaged on the same substrate-a multiplexed gold chip. Abbreviations: NBA = NanoBioAnalytical platform; SPRi =surface plasmon resonance imaging; AFM = atomic force microscopy; EV = extracellular vesicle. Please click here to view a larger version of this figure.
The core gold biochip constitutes the heart of the platform since all the label-free characterization techniques are conducted on this biochip. According to the needs of the EV characterization (either global/total EVs or EV subsets) and the limitations/demands of the methods used, three types of gold biochip surfaces have been developed: either "naked," chemically functionalized "C11/C16," or ligand-biofunctionalized, called "ligand" gold surface.
The naked biochip, called "naked," enables the simple adsorption of EVs on gold. It is possible to select the buffer used and realize this adsorption either in a passive way (incubation and then rinsing steps) or to monitor it under flow (in SPRi). Moreover, this passive adsorption can be realized either on the whole chip (as a macroarray) or localized in microarrays using a micropipette spotter. The "under flow procedure" allows investigators to follow the kinetics and the level of EV adsorption. This approach on the naked gold substrate is adopted when the chemical layer interface may interfere with the analytical method (e.g., for Raman spectroscopy).
The chemically functionalized biochip, called "C11/C16," is used to create a dense and robust "carpet" of EVs covalently bound on the gold surface by forming primary amide bonds with the thiolates when the objective is to have a global view of the EV sample. Indeed, in this case, the gold is functionalized by a thiolate mixture of mercapto-1-undecanol (11-MUOH: "C11") and mercapto-1-hexadecanoic acid (16-MHA: "C16"), and a fraction of the thiolates are chemically activated to establish covalent binding with the targets. Again, this strategy can be realized either passively (incubation and then rinsing steps, either in "macroarray" or in multiple microarrays using a micropipette spotter) or under flow rates (in SPRi) to follow the kinetics and level of EV grafting on the gold surface.
The ligand-biofunctionalized biochip, called "ligands," is chemically activated to covalently graft different ligands (e.g., antibodies, receptors) to selectively capture (with affinity) different EV subsets that coexist in the biological sample.
Access restricted. Please log in or start a trial to view this content.
Protokół
1. Gold substrate preparation
NOTE: Three types of surfaces are produced on gold chips: 1) naked surface, 2) chemically functionalized, and 3) biofunctionalized (ligands grafted on C11C16 layer). They will be called "naked," "C11C16," and "ligands," respectively, from this point onward.
- Gold substrate preparation:
NOTE: For this protocol, the gold biochips were manufactured in-house in the clean room. The home-made biochips were composed of glass slides (SF11) with a coating of chromium (2 nm Cr) and gold (48 nm Au). The length of the biochip was 28 mm, the width was 12.5 mm, and the thickness was 0.5 mm20.- Use DC magnetron sputtering15 to coat the slides by physical vapor deposition (PVD).
- Chemical functionalization:
- Functionalize the naked chips by incubating them overnight in a 90%/10% by mole mixture of mercapto-1-undecanol (11-MUOH: C11) and mercapto-1-hexadecanoic acid (16-MHA: C16) at 1 mM in absolute ethanol, under agitation, and at room temperature.
NOTE: This step will form a stable, self-assembled monolayer (SAM), which is useful in the grafting of the ligands. - Clean the biochip (gently wash) with absolute ethanol and ultrapure water, dry it under nitrogen, and store it under clean-room conditions.
- Activation of the chemically functionalized biochip:
NOTE: From this step onward, the experiments must be performed in an analytical laboratory.- Clean the biochip with ultrapure water by gently washing it, and then dry the chip under gentle airflow. To activate the C16 carboxylic groups, incubate the biochip in a mixture of 200 mM ethyl (dimethylaminopropyl) carbodiimide/N-hydroxysuccinimide (EDC) and 50 mmol/L N-hydroxysuccinimide (Sulfo-NHS) for at least 30 min in the dark at room temperature. Then rinse with water before the grafting experiments.
- Functionalize the naked chips by incubating them overnight in a 90%/10% by mole mixture of mercapto-1-undecanol (11-MUOH: C11) and mercapto-1-hexadecanoic acid (16-MHA: C16) at 1 mM in absolute ethanol, under agitation, and at room temperature.
- Grafting of the ligands on the functionalized biochip:
NOTE: The immobilization of the ligands (or EVs for some experiments) on the chip can either be done passively outside the SPRi instrument (incubation of a drop on the activated chip) or dynamically-under flow into the SPRi instrument. This constitutes the EV- or ligand-modified chips. Figure 2 presents the gold biochip, the micropipette spotter, and the biochip after spotting with 16 ligand droplets of 300 nL each.- For ligand grafting, use molecules such as antibodies (e.g., immunoglobulins-antiCD41 [specific to EVs derived from native blood platelets, called N-PEVs], antiCD61, antiCD62P, antiCD9, and antiOVA [control antibody against ovalbumin]) and Annexin V. Dilute them at 200 µg/mL in an acidic solution (from pH 4.5 to 6 depending on the optimal pH for ligand activity or function).
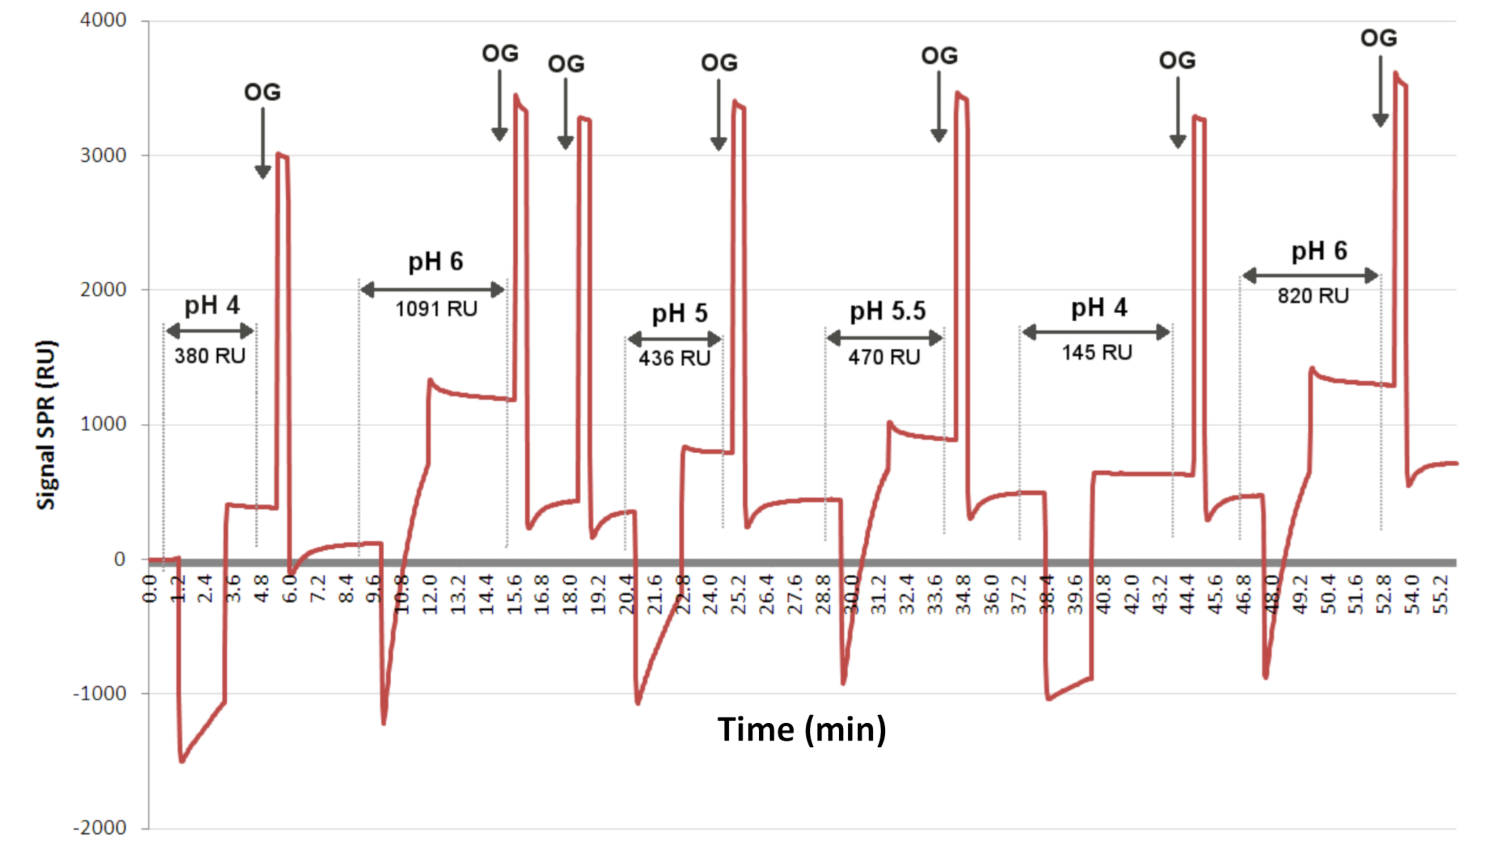
NOTE: The optimum pH for grafting antibodies was determined previously by preconcentration experiments performed on an SPR instrument for the determination of the optimal pH for ligand grafting (see Figure 3). As the grafting conditions change with the clones of antibodies that are used, it is recommended to determine these conditions before proceeding with the SPRi experiments. - For the grafting procedure, add 300 nL of EVs/ligand solution by using the spotter.
NOTE: A piece of paper submerged in water should be kept in both the left and right wells to avoid the evaporation of droplets. This step is important to maintain the EVs/ligands in their optimum conditions for stability and functionality. - After spotting, keep the biochip under a sonic bath (frequency: 37 kHz, power: 30%) for a 30 min incubation. Wash the biochip from the top with ultrapure water, and gently place it on a prism with the same refractivity index (RI) as the biochip. While adjusting the biochip on the top of the prism, add a droplet (~ 2.3 µL) of oil with the same RI as the prism to create a uniform, thin layer between the biochip and the prism.
NOTE: This step ensures a continuous medium of the same RI in the optical path. It is important to avoid incorporating any bubbles into the oil layer at this step, as this will change the optical properties in the path and hinder further analysis.
- For ligand grafting, use molecules such as antibodies (e.g., immunoglobulins-antiCD41 [specific to EVs derived from native blood platelets, called N-PEVs], antiCD61, antiCD62P, antiCD9, and antiOVA [control antibody against ovalbumin]) and Annexin V. Dilute them at 200 µg/mL in an acidic solution (from pH 4.5 to 6 depending on the optimal pH for ligand activity or function).

Figure 2: Biochip and manual spotter. Gold biochip (left), micropipette spotter (middle), and the biochip after spotting with ligand droplets of 300 nL each (right). Please click here to view a larger version of this figure.

Figure 3: Preconcentration tests to determine the optimal pH for ligand grafting. The sensorgram presents the level of interaction as a function of time for one ligand injected randomly (at different pH values) at the same concentration over 2 min on the surface. OG is the detergent, which allows the baseline to be recovered between each injection. Here, the sensorgram indicates that pH 6 allowed the most ligand grafting, with a SPRi signal of 1091 RU. Abbreviations: OG = octyl glucoside; RU = response unit. Please click here to view a larger version of this figure.
2. Surface plasmon resonance imaging
- Mount the biochip on the SPRi system. Keep the flow rate of the PBS buffer (running buffer) at 50 µL/min.
NOTE: If there are any bubbles, increase the flow rate up to 500-1,000 µL/min, and inject 40 mM octyl glucoside (OG) frequently to remove them as soon as possible. - Conditioning of the gold biochip in the SPRi instrument: Choice of the working angles
- Click on the dropdown menu on the left side of the software, and click on working directory to define the folder where the experimental data are to be saved. Afterward, click on Plasmon | Image acquisition.
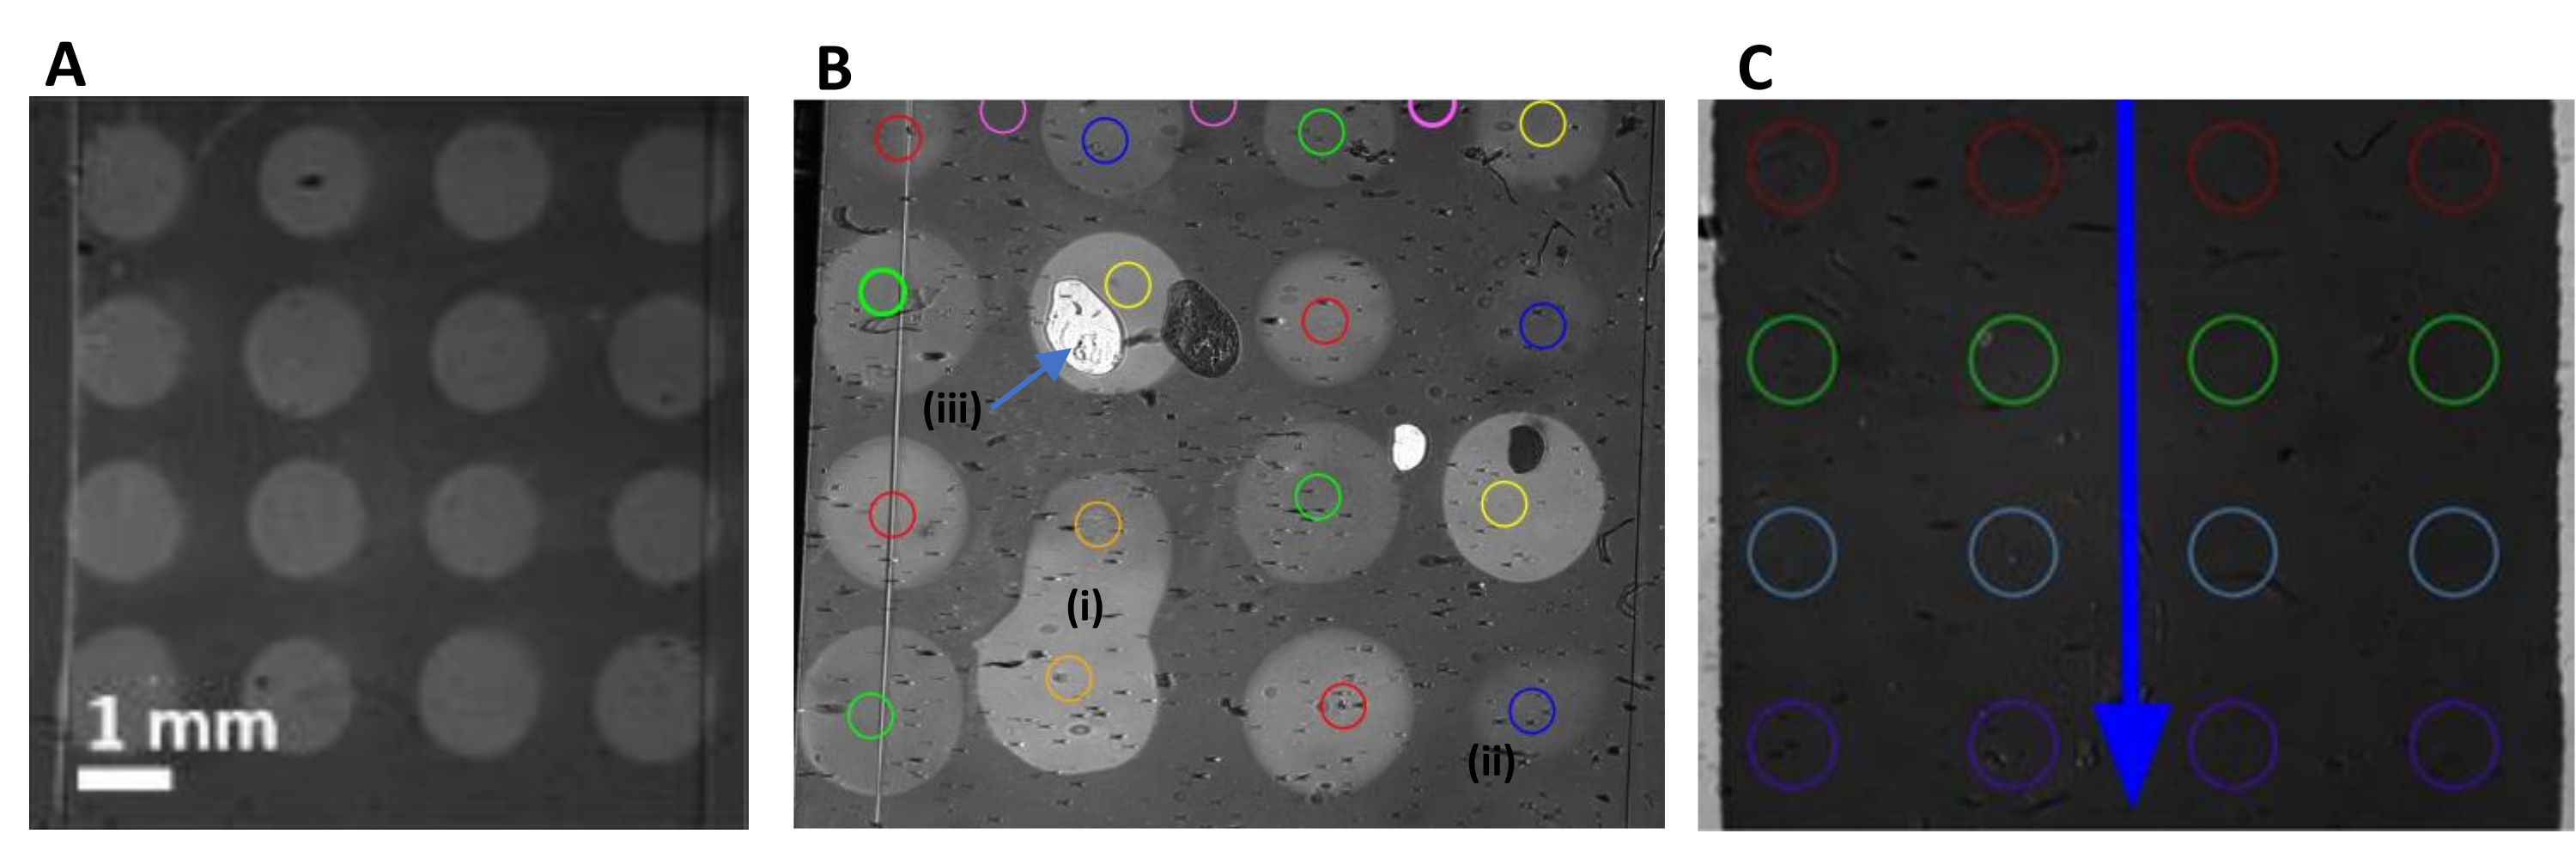
- Find the image (as shown in Figure 4A) where different spots are visible, and click to select this image. To define the region of interest (ROI), as represented in Figure 4, either click on automatic detection or manual definition inside the spots (Figure 4B) or on the chip to refer to a specific location even without spots (Figure 4C),.
- When multiplexed biochips are used, write the name of the ligand families, and then click on the corresponding spots.
NOTE: A ligand family corresponds to several spots functionalized with the same ligand. Usually, the chip presents at least duplicates and even often triplicates of each ligand. - Click on finish species definition and wait to be directed to the window containing the obtained plasmon curves.
- Choose a working angle. Drag the black line with the cursor to the optimum working angle, and click on Move mirror to working angle.
NOTE: The plasmon curve consists of the value of the reflectivity (%) versus the angle, and the software gives another curve with the value of the slope (%) versus the angle. To select a good working angle, choose the angle with the highest value of the slope.- In the case of a passivating step (because of albumin) performed inside the apparatus, select a working angle to get the optimum sensitivity toward the surface, thus establishing a quality control of the surface reactivity.
NOTE: This passivation step is important when the chip is prepared for affinity/capture biodetection to reduce non-specific interactions between the sample and biochip surface.
- In the case of a passivating step (because of albumin) performed inside the apparatus, select a working angle to get the optimum sensitivity toward the surface, thus establishing a quality control of the surface reactivity.
- Click on Kinetics to start the real-time kinetic monitoring. Once the software prompts the user to define the negative control, choose no negative control at this point (as this will allow for the observation of the kinetics on the negative control spots).
- Inject rat serum albumin (RSA, 200 µg/mL, prepared in acetate buffer, pH 4.5) at 50 µL/min for 4 min to passivate the surface around the spots and possibly to fill empty spaces inside the ligand spots.
NOTE: The RSA is injected to cover the biochip, which is not bound to any ligands. - Inject ethanolamine (1 M) at 20 µL/min for 10 min to deactivate the carboxylic groups still present and reactive on the surface.
- Wash the biochip by injecting 40 mM OG at 50 µL/min for 4 min.
NOTE: After the passivation step, the working angle is adjusted (as a new baseline determination before sample injection) to be at the highest sensitivity on the spots of interest.
- Inject rat serum albumin (RSA, 200 µg/mL, prepared in acetate buffer, pH 4.5) at 50 µL/min for 4 min to passivate the surface around the spots and possibly to fill empty spaces inside the ligand spots.
- Sample injection:
- Redefine the plasmon curves after passivation, and choose the working angle according to the ligand this time.
- In kinetic monitoring, reduce the flow rate to 20 µL/min, and wait for the baseline to be stable.
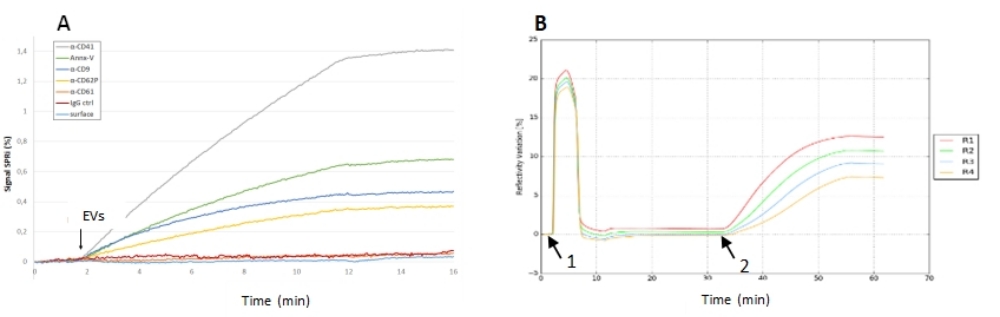
- Inject the sample at a concentration of choice (from 1 x 10⁸ EVs/mL to 1 x 10¹⁰ EVs/mL depending on the affinity between the EVs and the grafted ligands), and click on either manual injection or automatic injection. In the case of manual injection, after injecting 200 µL of the sample, click on stop the injection. As the duration of the injection is generally 10 min, start following the kinetics of the interaction, and measure the reflectivity variation by calculating the difference in the reflectivity between the start and the end of the injection observed during the kinetic monitoring (Figure 5).
NOTE: The different samples that were injected are described in the representative results section.
- After sample injection, follow either of these two approaches to finish the SPRi experiment:
- In the unfixed/in-liquid approach, take the biochip out of the SPRi apparatus, add a liquid drop onto it, and proceed for further AFM characterization of the surface in liquid.
- In the fixed approach, inject glutaraldehyde (0.5%) diluted in water at 20 µL/min for 10 min to fix the molecules captured on the biochip. Inject water to rinse the surface, take the biochip out, wash it very gently with distilled water, and air-dry it to be further analyzed under AFM.

Figure 4: SPRi CCD image of the biochip. (A,B) Multiplexed biochip after albumin passivation. (A) A chip with no default; (B) some defects that appeared on the chip: fusion of spots (i), weak grafting (ii), or dust or "contaminants" (iii). The ROIs, in color in the spots (one color per ligand family), were chosen to avoid those "contaminants". When spots merged, they were noted and either ignored or named as "mixture of ligands 1 and 2". (C) Naked gold chip without microarrays for the experiment examining the adsorption of EVs on gold. The blue arrow indicates the flow direction. This chip did not present spots, and the ROIs were chosen to register the reflectivity signal from line 1 (L1, red circles) to line 4 (L4, purple circles) during the sample injection. Scale bar = 1 mm for all three images. Abbreviations: SPRi = surface plasmon resonance imaging; CCD = charge-coupled device; ROIs = regions of interest; EVs = extracellular vesicles. Please click here to view a larger version of this figure.

Figure 5: SPRi experiments of EV injection onto a biochip. (A) Capture experiment on a multiplexed biochip showing the reflectivity signals of different ligands. Here, the signal-to-noise ratio for the different ligands was very good (and especially on the antiCD41 spots) since the response of the negative control was negligible. (B) Adsorption experiment of EVs on a naked biochip. Sensorgram presenting the conditioning of the chip with two flushes of buffer and OG cleaning (1), with the EV sample injection (2), and the reflectivity signal after EV interaction (3). On this biochip, there was no negative control, but the reflectivity signal (its kinetics, its stability after injection) was high, meaning that those EVs were able to adsorb and remain stable on the gold chip. Abbreviations: EV = extracellular vesicle; OG = octyl glucoside. Please click here to view a larger version of this figure.
3. Atomic force microscopy
- Use the contact mode to scan the biochip in air and the quantitative imaging mode to scan the biochip in liquid conditions.
- Align the biochip on the top of the mask on the glass slide (developed in the lab) to identify the position of the respective microspots on the biochip (Figure 6A).
NOTE: The mask contains the markings of the spots, which correspond to the positions of the spots of the ligands according to the spotter used. This mask consists of a glass slide on which two perpendicular wedges enable the placement of the chip. Moreover, the glass slide is marked with 16 felt dots corresponding to the spot localization on the chip, which allows, by transparence, for locating the spots and scanning the desired area. - Positioning of the tip:
- Use a CCD camera on top of the AFM to localize the cantilever on the correct spot that must be scanned. To follow this protocol, use triangular cantilevers of 200 µm length, 28 µm width, and a spring constant of 0.08 N/m.
- Align the laser on the top of the cantilever at a position that gives an optimum response in the feedback control mechanism.
- Scanning:
- Once engaged and in contact with the biochip surface, start the AFM acquisition in contact mode or in quantitative imaging mode from three to five large areas (typically 10 × 10 µm²) to small areas (1 x 1 µm²).
NOTE: A representation of the different areas that can be scanned is shown in Figure 6D. Ensure that the AFM characterization is representative of the whole mm² spot and that enough EVs are visualized at a good resolution for a robust analysis (a minimum of 300 EVs counted and analyzed for each condition), and perform the metrology and morphology measurements.
- Once engaged and in contact with the biochip surface, start the AFM acquisition in contact mode or in quantitative imaging mode from three to five large areas (typically 10 × 10 µm²) to small areas (1 x 1 µm²).
- AFM image treatment:
- Treat the AFM images with JPK data processing software by first selecting the height channel.
- Choose a polynomial fit to be subtracted from each line to obtain straightened scan lines.
- Select the height threshold on gold grains to eliminate the roughness of the surface. In the referenced software (see the Table of Materials), within the grain extraction module, mark the grains using a height threshold value at 8.5 nm. Once the grains have been filtered, the number of grains appears.
NOTE: Usually, the rough gold substrate (RMS of ~3 nm) and the presence of the chemical and ligand layers require the threshold to be set at 8.5 nm. - To extract several properties of the marked grains, such as height, volume, and diameter, open the image in the referenced software, and select data treatment | Grains | Mark by threshold.
- Choose filter grains in the function of properties. When a new window appears, choose the following parameters: Value = maximum z-max, Surface = projected surface A0. Then, choose the criteria A AND B.
- Open grain distribution; in the window that appears, choose value (maximum), volume (base: zero), and boundary (length). Observe the table (in .txt format) that appears, which presents three columns with the height, volume, and diameter values for all the grains detected at the set threshold per image.
- From the height, h, and diameter, D, calculate the radius of curvature, Rc, of each EV using equation (1)8, and then calculate the volume, V, using equation (2):
 (1)
(1)
 (2)
(2) - From V, calculate the effective diameter, d eff, of each EV (the diameter of a sphere with the same volume) using equation (3):
 (3)
(3) - Plot graphs showing the sizes (measured height, measured diameter, and calculated effective diameter) of the EVs, with each particle counted represented by a dot.
NOTE: Thus, at the end of the characterization, the NBA platform enables the correlation of the biodetection signal and then, the phenotyping, with the numbers and sizes of the EV subsets.

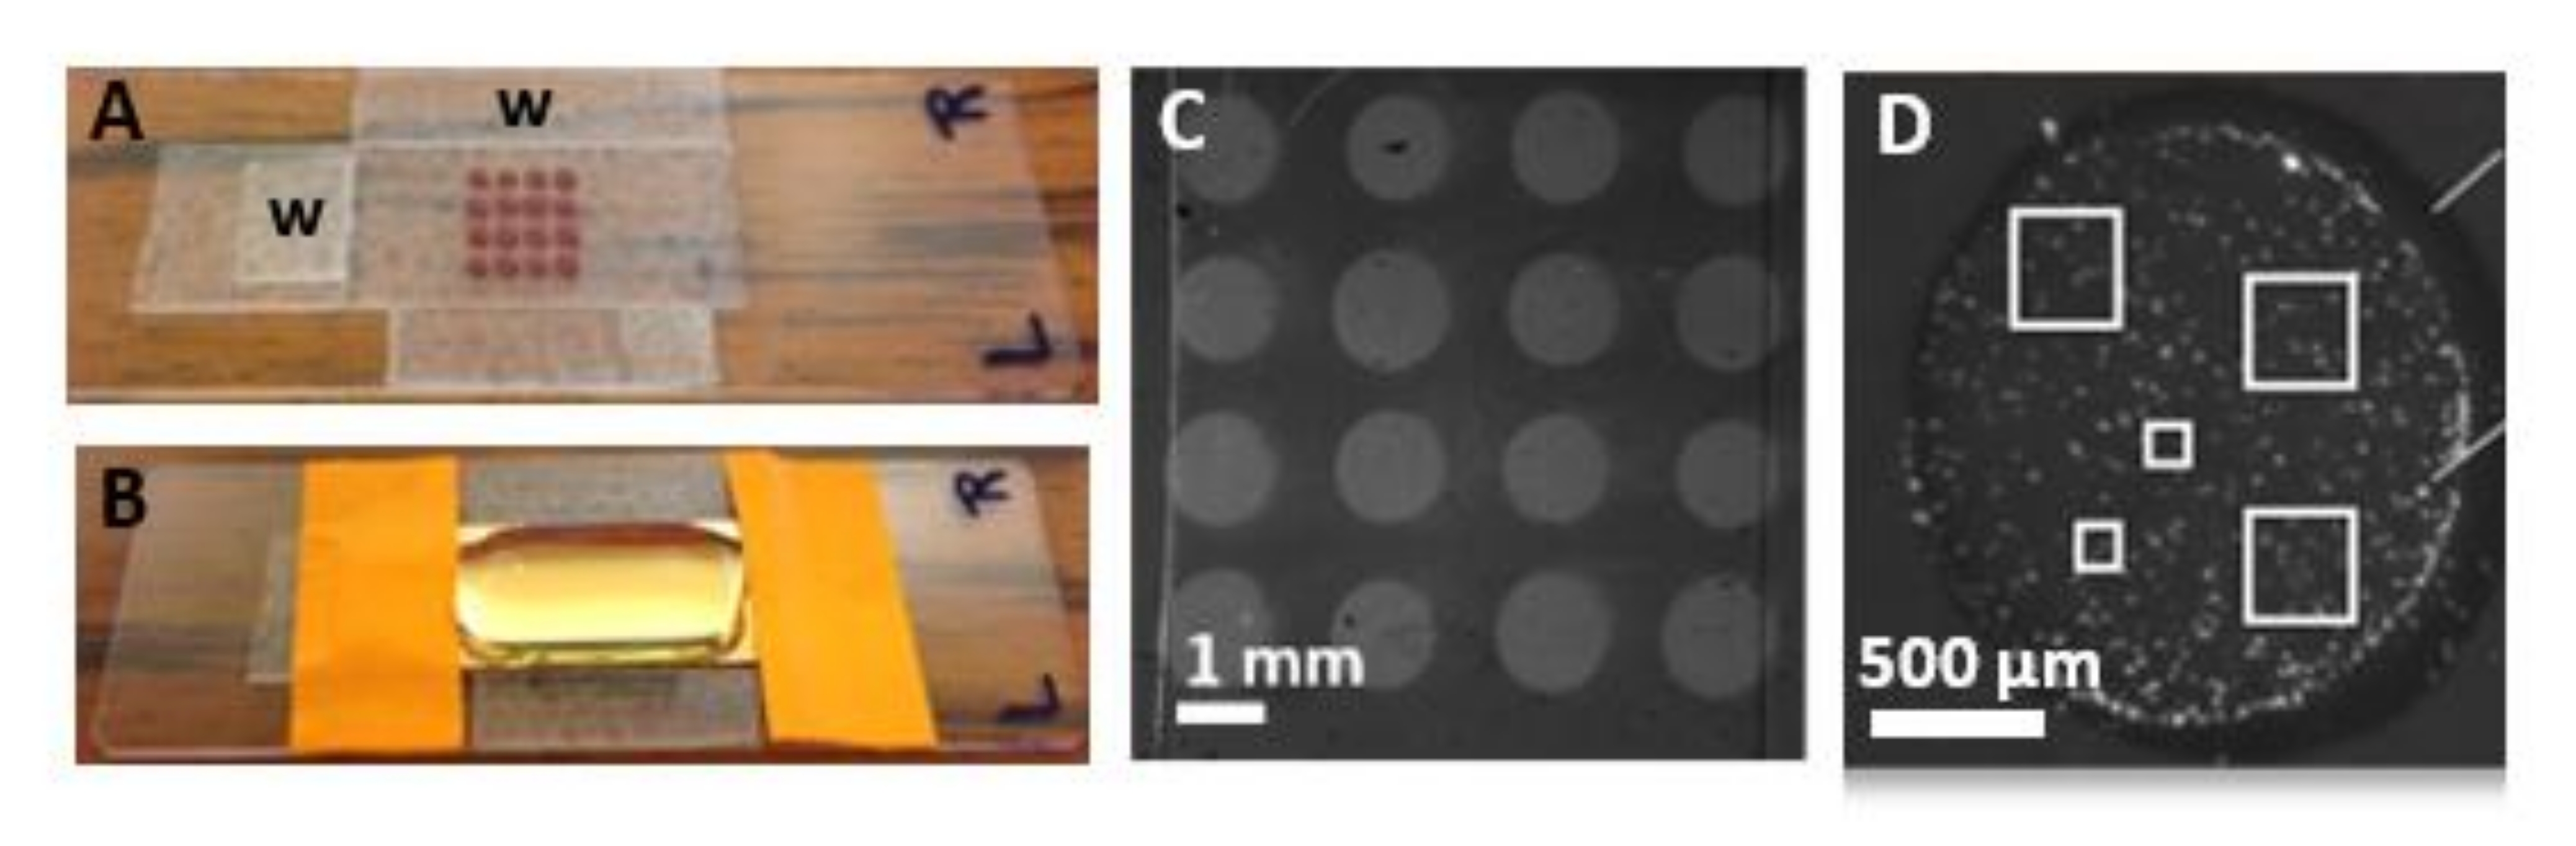
Figure 6: Biochip characterization by AFM. After the SPRi experiment, the chip was either fixed and dried or maintained in liquid for AFM characterization. (A) The machined glass slide (with two perpendicular positioning wedges, indicated with a "w" on the picture) presenting a mask fitting with the localization of the 16 biochip microarrays. By light exposure and transparency, once installed for the AFM characterization, the glass slide enables the AFM tip to be placed on the desired spot to characterize it. (B) The biochip installed on the "mask" slide and under a drop of buffer to scan in liquid conditions. (C) SPRi image of the 16 microarrays. (D) One microarray imaged by optical microscopy after the immunocapture of biofunctionalized calibration nanoparticles of 920 nm in diameter. The white squares indicate the sampling of the different areas scanned by AFM in each spot of interest to make the AFM characterization robust. Scale bars = (C) 1 mm, (D) 500 µm. Abbreviations: AFM = atomic force microscopy; SPRi = surface plasmon resonance imaging. Please click here to view a larger version of this figure.
4. Raman spectroscopy
NOTE: For Raman spectroscopy, replace the glass slide used as substrate with a slide of CaF2, which has a negligible Raman signature.
- Optical conditions for the acquisition:
- Set the following conditions for the Raman imaging microscope: microscope objective: 50x; laser wavelength: 532 nm; laser power: 10 mW; exposure time: 500 ms; number of accumulations: 140; spectral range: from 450 cm−1 to 3,200 cm−1.
NOTE: Using too much power and/or too long an acquisition time can lead to damage to the sample, evidenced by unstable spectra over time. Start with a low quantity of energy and increase this if the signal is too weak. Higher laser wavelengths can be used (633 nm, 785 nm) to reduce the fluorescence detrimental to Raman measurements. However, the intensity decreases with the fourth power of the wavelength, and the spectral sensitivity of the camera should be considered.
- Set the following conditions for the Raman imaging microscope: microscope objective: 50x; laser wavelength: 532 nm; laser power: 10 mW; exposure time: 500 ms; number of accumulations: 140; spectral range: from 450 cm−1 to 3,200 cm−1.
- Raman imaging:
- First, observe the live spectra with a reduced number of accumulations (10) to find the area with the best signal-to-noise ratio.
NOTE: A strong signal in the high-frequency region (2,800-3,000 cm−1) can ease the detection of EVs on the surface with low exposure times, as previously shown10. - Once the ROI is selected, choose the spatial resolution according to the time available for the acquisition.
NOTE: The spatial resolution is limited by the diffraction limit (~500 nm). - Start the Raman mapping acquisition.
- First, observe the live spectra with a reduced number of accumulations (10) to find the area with the best signal-to-noise ratio.
- Data preprocessing:
- Using a Python integrated development environment (IDE) (e.g., Spyder), open the file containing the spectra.
- Subtract the baseline of the spectra to correct for the interference from possible fluorescence. For example, use the "arpls" function from the package "irfpy"23. Test different values of the parameter "lam" to find the one that gives the best baseline correction (usually between 103 and 107).
- Normalize the spectra, for example, by dividing all the intensities of a spectrum by its intensity at 2,900 cm−1 or by subtracting the mean of the spectrum and then dividing it by its standard deviation ("standard normal variate" normalization).
NOTE: This step is necessary to compare the relative molecular composition of EVs.
Access restricted. Please log in or start a trial to view this content.
Wyniki
Determination of the optimum pH conditions for ligand grafting
The different ligands used to prepare the biochips are tested as a function of the pH and their availability to interact with the thiolate chemical layer (Figure 3). The ligands are diluted in acetate buffer at different pH values and injected on the biochip chemically functionalized with a C11C16 layer. The solutions are injected randomly on the surface, and a detergent (OG at 40 mM) is injected after each...
Access restricted. Please log in or start a trial to view this content.
Dyskusje
The recent methods for EV identification that are the most widely used are protein-specific immunoblotting to confirm the origin of EVs, TEM to confirm their structure, and NTA to quantify their number and size distribution in a sample volume3. Nevertheless, the high interest in EVs in (bio)medical research and the limitations of existing analytical tools have prompted the scientific community to develop new methods for EV characterization, discrimination, and quantification.
Access restricted. Please log in or start a trial to view this content.
Ujawnienia
The authors have no conflicts of interest to disclose.
Podziękowania
Kelly Aubertin and Fabien Picot from the IVETh core facility (Paris) are acknowledged for the Raman imaging experiments. Thierry Burnouf (Taipei Medical University, Taiwan) and Zuzana Krupova (From Helincourt, France) are acknowledged for providing the EV samples derived from blood platelet and bovine milk samples, respectively. The work was supported by the region Bourgogne Franche-Comté and the EUR EIPHI graduate school (NOVICE project, 2021-2024). Part of this work was done using the CLIPP platform and in RENATECH clean room facilities in FEMTO-ENGINEERING, for which we thank Rabah Zeggari.
Access restricted. Please log in or start a trial to view this content.
Materiały
| Name | Company | Catalog Number | Comments |
| CD41a antibody | Diaclone SAS (France) | 447528 | |
| CP920 | Microparticles GmbH, Germany | 448303 | |
| DXR3xi | Thermo Fisher Scientific | T1502 | |
| EDC | Sigma | A6272 | |
| Ethanolamine | Sigma | P5368-10PAK | |
| Evs derived from platelet concentrates | Collaboration : Pr T. Burnouf (TMU, Taipei) | S2889 | |
| Evs from bovine milk | Collaboration : Dr Z. Krupova (Excilone, Helincourt - France) | 3450 | |
| Glutaraldehyde | Sigma | 56845 | |
| Gwyddion | 853.223.020 | ||
| Magnetron sputtering | PLASSYS | SAB5300165 | |
| mercapto-1-hexadecanoic acid | Sigma | G5882 | |
| Mercapto-1-undecanol | Sigma | O8001 | |
| Mountains SPIP ones | Digital Surf | ||
| NanoWizard 3 Bioscience | Bruker-JPK | ||
| Octyl Glucoside (OG) | Sigma | ||
| Ovalbumine antibody | Sigma | ||
| Phosphate Buffer Saline (PBS) | Sigma | ||
| Rat Albumin Serum (RSA) | Sigma | ||
| Sodium acetate buffer | Sigma | ||
| SPR-Biacore 3000 | GE Healthcare/ Cytiva life sciences | ||
| SPRi Biochip | MIMENTO technology platform | The biochips were produced in-house in the clean room, Besancon | |
| SPRi Plex II | Horiba Scientific | ||
| Sulfo-NHS | Sigma |
Odniesienia
- Silva, A. K. A., et al. Development of extracellular vesicle-based medicinal products: A position paper of the group "Extracellular Vesicle translatiOn to clinicaL perspectiVEs - EVOLVE France". Advanced Drug Delivery Reviews. 179, 114001(2021).
- Xunian, Z., Kalluri, R. Biology and therapeutic potential of mesenchymal stem cell-derived exosomes. Cancer Science. 111 (9), 3100-3110 (2020).
- Hartjes, T. A., et al. Extracellular vesicle quantification and characterization: Common methods and emerging approaches. Bioengineering. 6 (1), 7(2019).
- Xing, Y., et al. Analysis of extracellular vesicles as emerging theranostic nanoplatforms. Coordination Chemistry Reviews. 424, 213506(2020).
- Wang, T., Xing, Y., Cheng, Z., Yu, F. Analysis of single extracellular vesicles for biomedical applications with especial emphasis on cancer investigations. Trends in Analytical Chemistry. 152, 116604(2022).
- Boireau, W., Elie-Caille, C. Extracellular vesicles: Definition, isolation and characterization. Medecine Sciences: M/S. 37 (12), 1092-1100 (2021).
- Brisson, A. R., et al. Extracellular vesicles from activated platelets: A semiquantitative cryo-electron microscopy and immuno-gold labeling study. Platelets. 28 (3), 263-271 (2017).
- Yuana, Y., et al. Atomic force microscopy: A novel approach to the detection of nanosized blood microparticles. Journal of Thrombosis and Haemostasis. 8 (2), 315-323 (2010).
- Sebaihi, N., de Boeck, B., Yuana, Y., Nieuwland, R., Pétry, J. Dimensional characterization of extracellular vesicles using atomic force microscopy. Measurement Science and Technology. 28 (3), 034006(2017).
- Beekman, P., et al. Immuno-capture of extracellular vesicles for individual multi-modal characterization using AFM, SEM and Raman spectroscopy. Lab on a Chip. 19 (15), 2526-2536 (2019).
- Malenica, M., et al. Perspectives of microscopy methods for morphology characterisation of extracellular vesicles from human biofluids. Biomedicines. 9 (6), 603(2021).
- Verweij, F. J., et al. The power of imaging to understand extracellular vesicle biology in vivo. Nature Methods. 18 (9), 1013-1026 (2021).
- Théry, C., et al. Minimal information for studies of extracellular vesicles 2018 (MISEV2018): A position statement of the International Society for Extracellular Vesicles and update of the MISEV2014 guidelines. Journal of Extracellular Vesicles. 7 (1), 1535750(2018).
- Obeid, S., et al. NanoBioAnalytical characterization of extracellular vesicles in 75-nm nanofiltered human plasma for transfusion: A tool to improve transfusion safety. Nanomedicine: Nanotechnology, Biology, and Medicine. 20, 101977(2019).
- Obeid, S., et al. Development of a NanoBioAnalytical platform for «on-chip» qualification and quantification of platelet-derived microparticles. Biosensors and Bioelectronics. 93, 250-259 (2017).
- Ridolfi, A., et al. AFM-based high-throughput nanomechanical screening of single extracellular vesicles. Analytical Chemistry. 92 (15), 10274-10282 (2020).
- Vorselen, D., et al. The fluid membrane determines mechanics of erythrocyte extracellular vesicles and is softened in hereditary spherocytosis. Nature Communications. 9 (1), 4960(2018).
- Hardij, J., et al. Characterisation of tissue factor bearing extracellular vesicles with AFM: Comparison of air-tapping-mode AFM and liquid Peak Force AFM. Journal of Extracellular Vesicles. 2, 21045(2013).
- Jorgensen, M., et al. Extracellular Vesicle (EV) Array: Microarray capturing of exosomes and other extracellular vesicles for multiplexed phenotyping. Journal of Extracellular Vesicles. 2, 20920(2013).
- Remy-Martin, F., et al. Surface plasmon resonance imaging in arrays coupled with mass spectrometry (SUPRA-MS): Proof of concept of on-chip characterization of a potential breast cancer marker in human plasma. Analytical and Bioanalytical Chemistry. 404 (2), 423-432 (2012).
- Czamara, K., et al. Raman spectroscopy of lipids: A review. Journal of Raman Spectroscopy. 46 (1), 4-20 (2015).
- Penders, J., et al. Single particle automated Raman trapping analysis of breast cancer cell-derived extracellular vesicles as cancer biomarkers. ACS Nano. 15 (11), 18192-18205 (2021).
- Baek, S. J., Park, A., Ahn, Y. J., Choo, J. Baseline correction using asymmetrically reweighted penalized least squares smoothing. Analyst. 140 (1), 250-257 (2015).
- Daaboul, G. G., et al. Digital detection of exosomes by interferometric imaging. Scientific Reports. 6, 37246(2016).
- Ertsgaard, C. T., et al. Integrated nanogap platform for sub-volt dielectrophoretic trapping and real-time Raman imaging of biological nanoparticles. Nano Letters. 18 (9), 5946-5953 (2018).
- Maas, S. L., et al. Possibilities and limitations of current technologies for quantification of biological extracellular vesicles and synthetic mimics. Journal of Controlled Release. 200, 87-96 (2015).
Access restricted. Please log in or start a trial to view this content.
Przedruki i uprawnienia
Zapytaj o uprawnienia na użycie tekstu lub obrazów z tego artykułu JoVE
Zapytaj o uprawnieniaPrzeglądaj więcej artyków
This article has been published
Video Coming Soon
Copyright © 2025 MyJoVE Corporation. Wszelkie prawa zastrzeżone