Aby wyświetlić tę treść, wymagana jest subskrypcja JoVE. Zaloguj się lub rozpocznij bezpłatny okres próbny.
Method Article
A Flow Cytometry-Based Cell Surface Protein Binding Assay for Assessing Selectivity and Specificity of an Anticancer Aptamer
W tym Artykule
Podsumowanie
A necessary step in anticancer aptamer development is to test its binding to the target. We demonstrate a flow cytometric-based assay to study this binding, emphasizing the importance of including a negative control aptamer and cancer cells that are positive or negative for that particular protein.
Streszczenie
A key challenge in developing an anticancer aptamer is to efficiently determine the selectivity and specificity of the developed aptamer to the target protein. Due to its several advantages over monoclonal antibodies, aptamer development has gained enormous popularity among cancer researchers. Systematic evolution of ligands by exponential enrichment (SELEX) is the most common method of developing aptamers specific for proteins of interest. Following SELEX, a quick and efficient binding assay accelerates the process of identification, confirming the selectivity and specificity of the aptamer.
This paper explains a step-by-step flow cytometric-based binding assay of an aptamer specific for epithelial cellular adhesion molecule (EpCAM). The transmembrane glycoprotein EpCAM is overexpressed in most carcinomas and plays roles in cancer initiation, progression, and metastasis. Therefore, it is a valuable candidate for targeted drug delivery to tumors. To evaluate the selectivity and specificity of the aptamer to the membrane-bound EpCAM, EpCAM-positive and -negative cells are required. Additionally, a non-binding EpCAM aptamer with a similar length and 2-dimensional (2D) structure to the EpCAM-binding aptamer is required. The binding assay includes different buffers (blocking buffer, wash buffer, incubation buffer, and FACS buffer) and incubation steps.
The aptamer is incubated with the cell lines. Following the incubation and washing steps, the cells will be evaluated using a sensitive flow cytometry assay. Analysis of the results shows the binding of the EpCAM-specific aptamer to EpCAM-positive cells and not the EpCAM-negative cells. In EpCAM-positive cells, this is depicted as a band shift in the binding of the EpCAM aptamer to the right compared to the non-binding aptamer control. In EpCAM-negative cells, the corresponding bands of EpCAM-binding and -non-binding aptamers overlap. This demonstrates the selectivity and specificity of the EpCAM aptamer. While this protocol is focused on the EpCAM aptamer, the protocol is applicable to other published aptamers.
Wprowadzenie
Cancer is still one of the leading causes of mortality worldwide1. Despite the significant improvement in cancer treatment in recent decades, anticancer drug development is still a highly debated topic. This is because chemotherapy, as the mainstay of cancer treatment, is accompanied by serious side effects that limit patient compliance with the treatment. Moreover, chemotherapy-induced cancer resistance to treatment has restricted its application as the sole choice of medical intervention. The application of monoclonal antibodies (mAbs) introduced an enhanced response to cancer treatments2. The rationale of using mAbs was to improve the efficacy of chemotherapeutics and minimize their adverse reactions. However, the administration of mAbs also became a challenge. This was not only because of the mAb-induced immunological reactions but also due to the animal-dependent and expensive production costs and difficult storage conditions3. Introduction of aptamers in the 1990s4 raised new hopes in cancer treatment, as the application of aptamers could address the challenges associated with mAbs.
Aptamers are short nucleic acid sequences that are specifically produced for a certain target. Systematic evolution of ligands by exponential enrichment (SELEX) is a common method in aptamer production. In SELEX, the protein of interest is incubated with a library of random nucleotide sequences, and through a series of iterative cycles, the aptamer specific for that protein is purified. Aptamers have similar target selectivity and specificity to mAbs, and therefore drug development in this field shows promising future applications. Aptamers specific for cancer biomarkers could be applied as single drugs and cancer diagnostic tools5,6,7. Due to their nano-sized structure, these aptamers could also act as drug carriers to deliver cytotoxic agents specifically to the tumor8. This would increase the efficacy of targeted drug delivery and decrease chemotherapy-associated, off-target adverse reactions. Moreover, these nanomedicines have a high tissue penetration, which makes them a desirable candidate for deep-tumor drug delivery and treatment. Aptamers can also be designed to target the transporters expressed on the blood-brain barrier (BBB) to improve drug delivery to brain tumors9. A good example of such an aptamer are bifunctional aptamers, targeting the transferrin receptor (TfR)10 to enhance drug delivery across the BBB, and delivering a cytotoxic drug payload to tumor cells11.
Despite all the advantages of aptamers, drug development in this field has not yet yielded a marketed, successful anticancer drug. One reason for this could be the lack of standard and reproducible methods that could be followed globally by researchers in the field. In this paper, a step-by-step protocol of an aptamer binding to a native protein expressed on the cell surface is demonstrated. This protocol is a prerequisite step in the preclinical assessment of anticancer aptamers. The assay is performed to show the selectivity and specificity of the purified aptamer collected from SELEX or a published aptamer sequence for confirmation of selectivity and specificity. This flow cytometric-based assay is a rapid, reliable, sensitive assay that accurately shows the selectivity and specificity of the aptamer, where the aptamer is being tested against proteins on the cell surface12,13,14. This method is demonstrated using the binding of an aptamer specific for EpCAM shown in this paper15. EpCAM, as a transmembrane glycoprotein, plays roles in tumor cell signaling, progression, migration, and metastasis16,17. To show the selectivity and specificity of this aptamer, EpCAM-positive and -negative cancer cells were used. The previously developed EpCAM specific aptamer, TEPP (5′-GC GCG GTAC CGC GC TA ACG GA GGTTGCG TCC GT-3′), and a negative control aptamer, TENN (5′-GC GCG TGCA CGC GC TA ACG GA TTCCTTT TCC GT-3), were used as EpCAM-binding and -non-binding aptamers, respectively10. The 3' end of both TEPP and TENN were labeled with a TYE665 fluorophore.
TEPP is a bifunctional aptamer that targets EpCAM from one end and TfR on the other. This has made TEPP a suitable candidate for drug delivery to EpCAM+ brain tumors. Using its TfR-specific end, TEPP traverses the blood-brain barrier, and using the EpCAM-specific end, finds the tumor and delivers its cargo (e.g., cytotoxic drugs) to the tumor. TENN has a similar length and 2D structure as TEPP, but it does not have affinity for the EpCAM or TfR, and hence is a suitable negative control aptamer. Using TEPP and TENN, testing the binding of an aptamer to the target protein using flow cytometry is shown in this paper. This protocol applies to the development of cell-specific aptamers. It is also applicable to further complementary and confirmation analyses of the aptamer sequences available in the literature. The protocol can also be used by those new to the aptamer field who are looking at using a previously published aptamer for their research and development (R&D) purposes. In this paper, two aptamer sequences available in the literature are studied.
Protokół
NOTE: Prior to starting the experiment, wear personal protective equipment, including a lab coat, gloves, and goggles. See the Table of Materials for details about materials, reagents, equipment, and software used in this protocol.
1. Buffers required for the assay
- Prepare the buffers required for this experiment-the SELEX buffer required for aptamer folding, Blocking Buffer (BB), Wash Buffer (WB), and Binding Buffer (BiB) (Table 1)-freshly on the day of the experiment and keep them on ice or at 4 °C.
NOTE: Each aptamer requires a unique folding condition. This includes the SELEX buffer and folding temperature conditions. Care should be taken to fully replicate the methods from the original paper describing the aptamer10. In this experiment, all buffers are prepared in Dulbecco's phosphate-buffered saline (DPBS). The buffer volume required in each experiment depends on the number of cell lines, number of replicates, and number of aptamer concentrations that are tested.
| Ingredients | Volume required | ||
| Item | Concentration | ||
| SELEX buffer | MgCl2 | 5 mM | 50 µL per sample + 10% pipetting error |
| Blocking Buffer | MgCl2 | 5 mM | 500 µL per cell line |
| BSA a | 1 mg/mL | ||
| tRNA b | 0.1 mg/mL | ||
| FBS c | 10% (v/v) | ||
| Wash Buffer | MgCl2 | 5 mM | 1 mL for the first wash + 100 µL per test sample + 10% pipetting error |
| Binding Buffer | MgCl2 | 5 mM | 50 µL per sample + 10% pipetting error |
| BSA | 2 mg/mL | ||
| tRNA | 0.2 mg/mL | ||
| FBS | 20% (v/v) | ||
Table 1: Buffers required for the binding assay. aBovine Serum Albumin, bTransfer Ribonucleic Acid, cFetal Bovine Serum.
2. Preparation of aptamers
NOTE: The aptamers used in the assay are tagged with a fluorescence reporter molecule, and therefore care should be taken to protect them from light.
- Prior to the experiment, prepare a 100 µM stock (stock A) of test and control aptamers using pyrogen- and RNase-free ultrapure water (Figure 1).
NOTE: For long-term preservation, stock A should be kept in a freezer at -20 °C. - Prepare stock B as the working concentration of aptamers by diluting stock A using SELEX buffer (Table 1). To follow this protocol, dilute stock A to a 1,000 nM stock to prepare stock B (Figure 1).
- To make the aptamer ready for the formation of the 3-dimensional (3D) structure, in a 250 µL tube, dilute stock B with SELEX buffer to prepare the required volume and concentration of the aptamer for folding.
NOTE: The folded aptamers will be exposed to an equal volume of cells. Therefore, the concentration of the aptamer that is set for folding should be 2x more concentrated than the desired final concentration. Use equation (1) to calculate the required volumes and concentrations. Remember to consider an extra 10% volume for the pipetting error.
Concentrationstock A × Volumestock A = Concentrationstock B × Volumestock B (1)

Figure 1: A diagram showing the steps in the preparation of aptamers. 1Stock 1 is stored at -20 °C for long-term preservation. 2Working concentrations are prepared in SELEX buffer and are not stored. Please click here to view a larger version of this figure.
3. Maintenance of cancer cells
NOTE: Prior to commencement of the study, make sure that the cells are at their early passage numbers, show their typical morphological features, and are mycoplasma free. To test the selectivity and specificity of the aptamer, cell lines that are high, moderate, and low/negative expressors of the protein of interest are ideally required.
- Seed the cells in a T75 culture flask, using appropriate culture conditions. Grow them in a 5% CO2 humidified incubator, at 37 °C.
NOTE: In this study, Dulbecco's Modified Eagle Medium (DMEM) supplemented with 10% fetal bovine serum (complete medium) was used. - When the cells reach ~80% confluency, passage them to a new flask containing fresh complete medium.
NOTE: Depending on the protein of interest and the cell line, 80% confluency could provide a suitable cell population for the binding assay. For the cell lines in this experiment, MDA-MB-231 and HEK 293T, 80% confluency is suitable. At this stage, proceed to section 4, the binding assay. Always check the expression of the protein of interest, using mAbs specific for that protein.
4. Binding assay
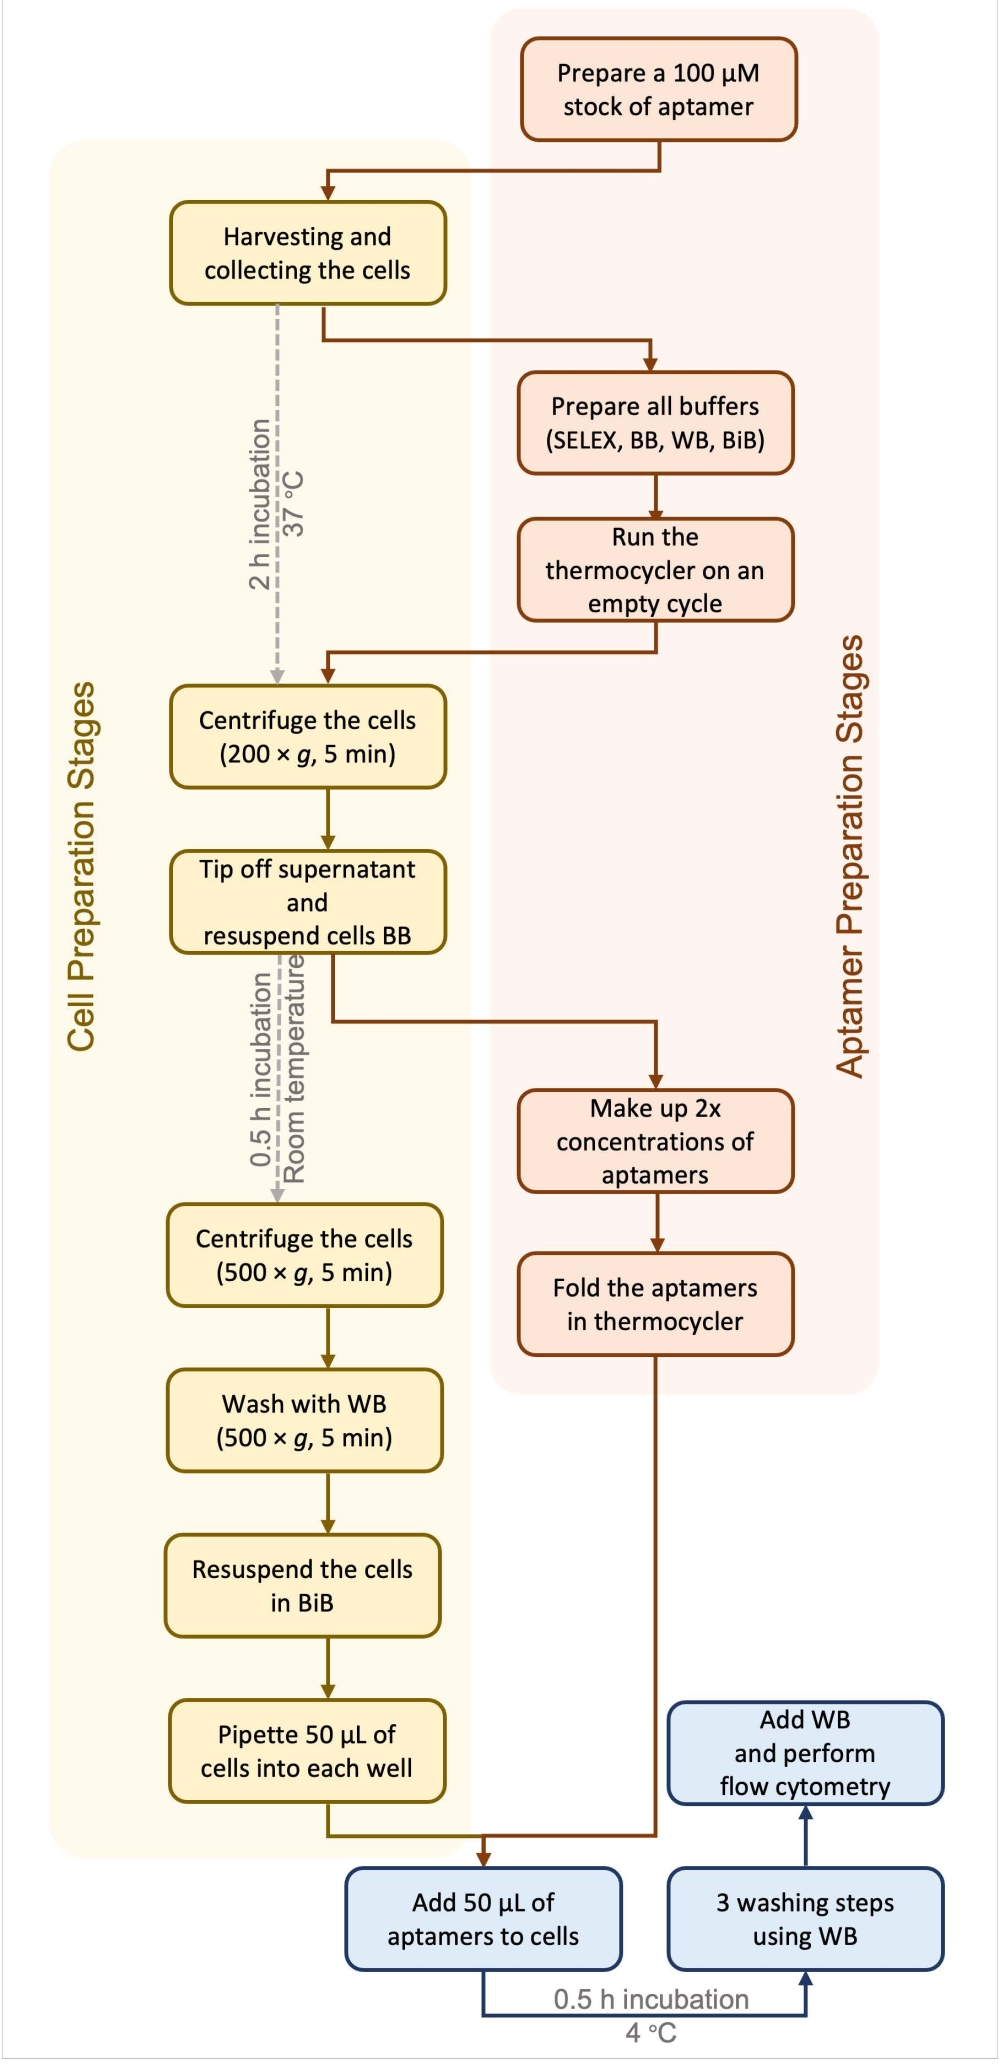
NOTE: Figure 2 summarizes the steps required in the binding assay in adherent cells.
- In a class II biosafety cabinet, collect the cells of each flask in tubes as follows:
- Collect and discard the media in the flask, add 2 mL of PBS, spread it over the cells, and then, collect and discard the PBS. Repeat this step twice more to remove all traces of media that may inactivate trypsin. Add 1 mL of 0.25% of trypsin/EDTA to each flask and incubate for 5-10 min at 37 oC. Visualize the detachment of cells under a microscope.
- Add 1 mL of complete medium to the cells, and pipette the cells up and down to make a single-cell suspension. Pipette the cells into an appropriate tube and centrifuge at 200 × g for 5 min.
NOTE: For non-adherent cells, collect the cells in a tube, centrifuge (200 × g, 5 min), and proceed to step 4.1.3. - Discard the supernatant and resuspend the cells in 1 mL of fresh medium. Count the cells using trypan blue staining, by diluting a certain volume of cell suspension with trypan blue. Distribute ~15 µL of the mixture between a hemocytometer and a cover glass. Count the cells as previously described18, using equation (2):
 (2)
(2)
NOTE: Use the minimum possible volume of cell suspension and take a note of the dilution factor. For example, mixing equal volumes of cell suspension and 0.04% trypan blue gives a dilution factor of 2. Ensure high viability (live cells/total cells × 100) of ~90% for most adherent cell lines before proceeding. Dead cells non-specifically take up aptamers and alter the results19. It is possible to use other cell counting techniques, such as using a cell counter. - Collect the required number of cells, making sure to have 10 × 104 cells per test sample. Consider an extra 10% volume for pipetting error.
NOTE: It is important to always keep the same cell count between experiments and replicates. - Incubate the cells at 37 °C for 2 h to allow for the stabilization of the protein of interest on the cell membrane following enzymatic detachment.
NOTE: This incubation period might differ according to the protein of interest.
- During this 2 h incubation:
- Set the temperature of the centrifuge to 4 °C. Leave tRNA and stocks of aptamer at room temperature or on ice to thaw. To protect the fluorescence reporter molecule, protect the aptamer tubes from light.
NOTE: The role of tRNA is to block the nucleic acid binding sites. - Prepare the SELEX buffer, BB, WB, and BiB (see section 1), keeping them all on ice or at 4 °C. Set the thermocycler machine on an empty cycle. Place a 96-well black plate and flow cytometry tubes on ice.
NOTE: Setting the thermocycler on an empty cycle prepares the cooling and heating system and helps generate more reproducible results.
- Set the temperature of the centrifuge to 4 °C. Leave tRNA and stocks of aptamer at room temperature or on ice to thaw. To protect the fluorescence reporter molecule, protect the aptamer tubes from light.
- Following the 2 h incubation, centrifuge the cells at 500 × g for 5 min. Discard the supernatant and resuspend the cells in 500 µL of BB. Incubate the cells at 4 °C for 30 min with intermittent mixing.
- During this 30 min incubation, perform aptamer folding as follows:
- Make up the 2x concentrations of aptamers (see section 2), and then mix and incubate the aptamers in the thermocycler machine, according to the required folding conditions. For this EpCAM aptamer, use the following folding conditions of 95 °C, 5 min, followed by 22 °C, 10 min, and 37 °C, 15 min.
NOTE: Always include a negative control (i.e., SELEX buffer without aptamers).
- Make up the 2x concentrations of aptamers (see section 2), and then mix and incubate the aptamers in the thermocycler machine, according to the required folding conditions. For this EpCAM aptamer, use the following folding conditions of 95 °C, 5 min, followed by 22 °C, 10 min, and 37 °C, 15 min.
- Following the 30 min incubation, centrifuge the cells (500 × g, 5 min, 4 °C), remove the supernatant, add 1 mL of WB, and centrifuge the cells again (500 × g, 5 min, 4 °C). Remove the supernatant and resuspend the cells in a suitable volume of the BiB.
- Pipette 50 µL of the resuspended cells into each well of an ice-cold, 96-well black plate. Keep the cells on ice to inhibit internalization of the protein of interest.
- Pipette 50 µL of the aptamers onto a 50 µL volume of cells, mix, and incubate in darkness at 4 °C for 30 min. Centrifuge the plate at 500 × g, 5 min, 4 °C, and carefully remove the supernatant.
- Carefully resuspend the pellet in WB and centrifuge at 500 × g for 5 min. Repeat the wash step (4.7) 2x and resuspend in 100 µL of WB for flow cytometric analysis.
NOTE: See Figure 3 for a diagram of interactions between aptamers and cells.

Figure 2: A diagram depicting the steps in performing an aptamer-protein-binding assay. Abbreviations: SELEX = Systematic Evolution of Ligands by EXponential Enrichment; BB = Blocking Buffer; WB = Wash Buffer; BiB = Binding Buffer. Please click here to view a larger version of this figure.

Figure 3: A diagram showing the different types of cells and aptamers required to perform the aptamer binding assay. Abbreviation: EpCAM = epithelial cellular adhesion molecule. This figure was created using Biorender.com. Please click here to view a larger version of this figure.
5. Flow cytometry and data analysis
NOTE: Before turning on the flow cytometer, make sure that there are no "bubbles" in the membrane filter units for the shut-down solution, cleaning solution, and sheath fluid (0.9% NaCl). "Bleed out" bubbles if there are bubbles in the capsules. Make sure that the waste container is empty, and containers of sheath fluid, water, and 1% bleach in ultrapure water are full.
- Turn on the flow cytometer and then the computer.
NOTE: The details of running the flow cytometer explained here are specific to the machine and software demonstrated in the video (see Table of Materials). Other software would require appropriate training to use. - Open the flow cytometry analysis software, log in to the program, and under the Cytometer tab, run Fluidics Start up.
- To create a new experiment, under the experiment tab, click New Folder and name the folder/experiment appropriately.
- Click on new folder to highlight, then under the experiment tab again, click New Experiment and name the experiment appropriately.
- To add the first sample/specimen, under the experiment tab, click New Specimen and name this specimen appropriately (name of cell line/control sample/ experiment sample).
- To add a tube sample, highlight the specimen (group) and under the experiment tab, click New Tube. Add the appropriate number of tubes and name.
- To prepare the required graphs, under the worksheet tab, open a new worksheet. Once the new worksheet window pops up, open the following using the worksheet screen (hover the mouse across the logo/pictures to find the names):
- Prepare a dot blot graph of forward scatter (FSC) versus side scatter (SCC) to select the population of interest. Define the first gate by identifying and selecting the population of interest (P1) in a forward and side scatter density plot. Exclude the debris, which constitutes the population with the lowest forward scatter signal.
NOTE: The FSC parameter detects cells or events based on their size and the SCC discriminates them based on their granularity20. - Prepare a dot blot graph of FSC-area (FSC-A) versus FSC-height (FSC-H) to select the single-cell population. Define the second gate by excluding doublet cell populations, as doublet cells considerably affect the results and conclusions. Exclude doublets by using FSC-H versus FSC-A density plots, where cells of the same size show a similar area and height. Hence, the singlets get clustered diagonally and separated from doublets.
NOTE: FSC is roughly proportional to the cell size. The voltage pulses are defined as FSC-H, the intensity of the signal, FSC-width that reflects cell size and the duration of the signal, and FSC-A, which is H × W. Doublets have a double width and area value; therefore, gating for singlets is based on detecting disproportions between H, W, and A caused by doublets. - Prepare a histogram of the number of events against the fluorophore of interest.
- Prepare a dot blot graph of forward scatter (FSC) versus side scatter (SCC) to select the population of interest. Define the first gate by identifying and selecting the population of interest (P1) in a forward and side scatter density plot. Exclude the debris, which constitutes the population with the lowest forward scatter signal.
- Before starting flow cytometry, ensure that the acquisition dashboard for controlling the sample acquisition, inspector, and cytometer to adjust voltage parameters, as well as the worksheet with all the graphs are open.
NOTE: At least 100 µL of a 10 × 104 cell suspension in a flow cytometry tube is needed to perform the analysis. Especially in case of lower viabilities, propidium iodide staining can be performed to select the viable cell population21,22. - To run the first sample, on the left-hand side of the screen make sure the arrow pointing to the tube is green. If this arrow is not green, click on the arrow to make it green.
- Using a pipette, transfer each sample from the 96-well black plate to a flow cytometry tube. Run the untreated, unstained control sample on a low speed.
- On the acquisition dashboard, choose an appropriate number of events to record (30,000), change the flow rate to low, and click Acquire Data.
- Adjust the voltage for the FSC and SCC parameters. Ensure the cell population is centralized within the dot plot and that no cells are touching either axis of the graph to avoid losing the cells of interest.
- Increase the acquisition speed to medium or high to analyze the samples faster but do not exceed more than 200 events/s. Then, click Record Data.
- Perform the gating for P1 (Figure 4A) and the single-cell population (Figure 4B). Construct the histogram of events against the used fluorochrome and select P1 based on the data (allophycocyanin (APC) in this case) (Figure 4C).
- After adjusting the voltage, gating and recording the data, take out the sample and click Next Tube.
- Insert the next sample, and repeat recording data for all control and test samples (Figure 3).
- Once all the data are collected, wash the flow cytometer by running three tubes of 50% bleach, FACS rinse, and ultrapure water, each for 5 min at a high flow rate.
- Then, from the Cytometer dropdown menu, click Fluidics Shut Down.
- Prior to closing the software and turning off the machine and the computer, export the results as .fcs files to a USB drive to transfer and analyze them, as follows:
- In the analysis software, press the NEW button to create a new document and window to handle the analysis. Drag the sample files into the new window.
- Double-click to open the unstained sample. Choose the P1 population, double-click on the P1 population to create a FSC-H versus FSC-A graph, and gate the single-cell population.
- Double-click on the gated single cells to create a histogram of events against the used fluorochrome.
- In the original window, select P1 and single cells and drag them to All Samples so that all samples now contain the same gating.
- Click on the Layout Editor button to open the Layouts window. Drag two samples (control and test) over one another to create an overlay histogram.
Wyniki
An important aspect of new drug discovery and development is assuring the selectivity and specificity of the drug candidate. This means that the drug candidate should be able to discriminate between different cells and only affect the cell population of interest (selectivity). Selectivity is studied using cell lines that differ in terms of expression of the protein of interest. In this study, MDA-MB-231 and HEK 293T cell lines were chosen as EpCAM-positive and -negative cells. Specificity is another determinant that show...
Dyskusje
The key challenge with developing new aptamers is the lack of standard guidelines that applies to different steps of this process. McKeague et al. have recently demonstrated some of the associated challenges, which lead to unclear presentations of data in publications and failure to replicate the research. They proposed fundamental guidelines necessary for consideration in characterizing aptamers19. An aptamer binding assay is a critical step in screening and/or characterizing aptamers
Ujawnienia
The authors have no conflicts of interest to disclose.
Podziękowania
The authors acknowledge the Institute for Mental and Physical Health and Clinical Translation (IMPACT) SEED funding, the "Alfred Deakin Postdoctoral Research Fellowship" program at Deakin University, and the "Australian Government Research Training Program Scholarship".
Materiały
| Name | Company | Catalog Number | Comments |
| 1.5 mL microcentrifuge tubes with attached lid | Sigma-Aldrich | T6649 | |
| 15 mL CellStar blue screw cap, conical bottom tube | Greiner Bio One | 188271 | |
| 5 mL serological pipettes | Greiner Bio One | 606180 | |
| BD FACSCanto II Flow Becton Dickinson Cytometer | Becton Dickinson | N/A | |
| BD FACSDiva V9.0 | BD Biosciences | N/A | |
| Bovine Serum Albumin (BSA), Lyophilized powder | Sigma-AldrichTM | A7906-50G | |
| Bright-line Hemocytometer | Sigma-Aldrich | Z359629 | |
| Dulbecco’s Modified Eagle Medium (DMEM) High Glucose Media Powder | Life Technologies | 12100046 | |
| Dulbecco’s Phosphate- Buffered Saline (DPBS) | Life Technologies | 21300025 | |
| FlowJo, LLC 10.8.1 | BD Biosciences | N/A | |
| Foetal Bovine Serum (FBS) | Bovogen | SFBS-F | |
| HEK293T | American Type Culture Collection | ACS-4500 | |
| Heracell 150i CO2 Incubator | Thermo Fisher Scientific | N/A | |
| Heraeus Megafuge 16R Centrifuge | Thermo Fisher Scientific | N/A | |
| Magnesium Chloride (MgCl2) | Sigma-Aldrich | M8266 | |
| MDA-MB-231 | American Type Culture Collection | CRM-HTB-26 | |
| Microplate, PS, 96 well, F-bottom (Chimney well), Black | Greiner Bio One | 655076 | |
| MiniAmp Thermal Cycler | Thermo Fisher Scientific | A37834 | |
| Phosphate-Buffered Saline (PBS) tablets | Life Technologies | 18912014 | |
| Pyrogen- and RNase-free ultrapure water | Milli-Q | ||
| T75 Cell Culture flask | Cellstar | 658170 | |
| TENN | Integrated DNA Technologies | N/A | 5′-GC GCG TGCA CGC GC TA ACG GA TTCCTTT TCC GT-3 |
| TEPP | Integrated DNA Technologies | N/A | 5′-GC GCG GTAC CGC GC TA ACG GA GGTTGCG TCC GT-3′ |
| Transfer RNA (tRNA) | Sigma-Aldrich | R8508-5X1ML | |
| Trypan Blue Solution | Life Technologies | 15250061 | |
| Trypsin-EDTA | Gibco | 15400054 |
Odniesienia
- Cancer. World Health Organization Available from: https://www.who.int/news-room/fact-sheets/detail/cancer#:~:text=Cancer%20is%20a%20leading%20cause.and%20rectum%20and%20prostate%20cancers (2022)
- Liu, J. K. H. The history of monoclonal antibody development - Progress, remaining challenges and future innovations. Annals of Medicine and Surgery. 3 (4), 113-116 (2014).
- Nakhjavani, M., Shigdar, S. Future of PD-1/PD-L1 axis modulation for the treatment of triple-negative breast cancer. Pharmacological Research. 175, 106019 (2022).
- Bukari, B., Samarasinghe, R. M., Noibanchong, J., Shigdar, S. L. Non-invasive delivery of therapeutics into the brain: the potential of aptamers for targeted delivery. Biomedicines. 8 (5), 120 (2020).
- Wu, X., Chen, J., Wu, M., Zhao, J. X. Aptamers: active targeting ligands for cancer diagnosis and therapy. Theranostics. 5 (4), 322 (2015).
- Feng, X., et al. The aptamer functionalized nanocomposite used for prostate cancer diagnosis and therapy. Journal of Nanomaterials. 2022, (2022).
- Huang, J., et al. Advances in aptamer-based biomarker discovery. Frontiers in Cell and Developmental Biology. 9, 571 (2021).
- Ashrafuzzaman, M. Aptamers as both drugs and drug-carriers. BioMed Research International. 2014, (2014).
- Nakhjavani, M., Samarasinghe, R. M., Shigdar, S. Triple-negative breast cancer brain metastasis: an update on druggable targets, current clinical trials, and future treatment options. Drug Discovery Today. , (2022).
- Macdonald, J., et al. Development of a bifunctional aptamer targeting the transferrin receptor and epithelial cell adhesion molecule (EpCAM) for the treatment of brain cancer metastases. ACS Chemical Neuroscience. 8 (4), 777-784 (2017).
- Macdonald, J., et al. Bifunctional aptamer-doxorubicin conjugate crosses the blood-brain barrier and selectively delivers its payload to EpCAM-positive tumor cells. Nucleic Acid Therapeutics. 30 (2), 117-128 (2020).
- Shigdar, S., Agnello, L., Fedele, M., Camorani, S., Cerchia, L. Profiling cancer cells by cell-SELEX: use of aptamers for discovery of actionable biomarkers and therapeutic applications thereof. Pharmaceutics. 14 (1), 28 (2021).
- Rahimizadeh, K., et al. Development of cell-specific aptamers: recent advances and insight into the selection procedures. Molecules. 22 (12), 2070 (2017).
- Chen, M., et al. Development of cell-SELEX technology and its application in cancer diagnosis and therapy. International Journal of Molecular Sciences. 17 (12), 2079 (2016).
- Shigdar, S., et al. The use of sensitive chemical antibodies for diagnosis: detection of low levels of EpCAM in breast cancer. PLoS One. 8 (2), 57613 (2013).
- Ni, J., et al. Role of the EpCAM (CD326) in prostate cancer metastasis and progression. Cancer and Metastasis Reviews. 31 (3), 779-791 (2012).
- Ni, J., et al. Epithelial cell adhesion molecule (EpCAM) is associated with prostate cancer metastasis and chemo/radioresistance via the PI3K/Akt/mTOR signaling pathway. The International Journal of Biochemistry & Cell Biology. 45 (12), 2736-2748 (2013).
- McKeague, M., Kruse, P. F., Patterson, M. K., et al. . Tissue Culture. , 395-397 (1973).
- McKeague, M., et al. The minimum aptamer publication standards (MAPS guidelines) for de novo aptamer selection. Aptamers. 6, 10-18 (2022).
- Schoofs, G., Van Hout, A., D'huys, T., Schols, D., Van Loy, T. A flow cytometry-based assay to identify compounds that disrupt binding of fluorescently-labeled CXC Chemokine ligand 12 to CXC Chemokine receptor 4. Journal of Visualized Experiments. (133), e57271 (2018).
- McKinnon, K. M. Flow cytometry: an overview. Current Protocols in Immunology. 120 (1), 1-11 (2018).
- Kamiloglu, S., Sari, G., Ozdal, T., Capanoglu, E. Guidelines for cell viability assays. Food Frontiers. 1 (3), 332-349 (2020).
- Ruscito, A., DeRosa, M. C. Small-molecule binding aptamers: Selection strategies, characterization, and applications. Frontiers in Chemistry. 4, 14 (2016).
- McKeague, M., et al. Comprehensive analytical comparison of strategies used for small molecule aptamer evaluation. Analytical Chemistry. 87 (17), 8608-8612 (2015).
- Henri, J., Bayat, N., Macdonald, J., Shigdar, S. A guide to using nucleic acid aptamers in cell based assays. Aptamers. 23, (2019).
- Mao, H., et al. The mechanism and regularity of quenching the effect of bases on fluorophores: the base-quenched probe method. Analyst. 143 (14), 3292-3301 (2018).
- McKeague, M., et al. Analysis of in vitro aptamer selection parameters. Journal of Molecular Evolution. 81 (5), 150-161 (2015).
- Chen, B., et al. Targeting negative surface charges of cancer cells by multifunctional nanoprobes. Theranostics. 6 (11), 1887 (2016).
- Shigdar, S., et al. RNA aptamers targeting cancer stem cell marker CD133. Cancer Letters. 330 (1), 84-95 (2013).
- Amraee, M., Oloomi, M., Yavari, A., Bouzari, S. DNA aptamer identification and characterization for E. coli O157 detection using cell based SELEX method. Analytical Biochemistry. 536, 36-44 (2017).
- Yu, X. -. X., et al. Selection and characterization of a novel DNA aptamer, Apt-07S specific to hepatocellular carcinoma cells. Drug Design, Development and Therapy. 14, 1535 (2020).
Przedruki i uprawnienia
Zapytaj o uprawnienia na użycie tekstu lub obrazów z tego artykułu JoVE
Zapytaj o uprawnieniaThis article has been published
Video Coming Soon
Copyright © 2025 MyJoVE Corporation. Wszelkie prawa zastrzeżone