Для просмотра этого контента требуется подписка на Jove Войдите в систему или начните бесплатную пробную версию.
Method Article
Флэш Фотолиз клетке соединений в ресничек Обонятельные сенсорные нейроны
В этой статье
Резюме
Фотолиз клетке соединений позволяет получать быстрое и локализованные увеличение концентрации различных физиологически активных соединений. Здесь мы покажем, как получить патч-зажим записи в сочетании с фотолиза клетках или в клетках цАМФ Ca для изучения обонятельной трансдукции в диссоциированных мыши обонятельной сенсорных нейронов.
Аннотация
Фотолиз клетке соединений позволяет получать быстрое и локализованные увеличение концентрации различных физиологически активных соединений 1. Клетке соединений молекулы, физиологически неактивных по химической клетки, которые могут быть нарушены вспышки ультрафиолетового света. Здесь мы покажем, как получить патч-зажим записи в сочетании с фотолиза клетке соединений для изучения обонятельной трансдукции в диссоциированных мыши обонятельной сенсорных нейронов. Процесс обонятельной трансдукции (рис. 1) имеет место в ресничками обонятельных сенсорных нейронов, где одоранта связывания с рецепторами приводит к повышению цАМФ, который открывает циклических нуклеотидов закрытого (СПГ) каналы 2. Са запись с помощью СПГ каналов активирует Са-активированных каналов Cl. Мы покажем, как отделить нейроны от мыши обонятельный эпителий 3 и инструкции по активации СПГ каналов или Ca-Cl активированного каналы фотолиза клетке цАМФ 4 или клетку Са 5 </ SUP>. Мы используем лампы-вспышки 6,7 применять ультрафиолетовые вспышки для цилиарной региона выпускать из клетки цАМФ или Са в то время как патч-зажим записи взяты для измерения тока в цельноклеточной напряжения зажим конфигурации 8-11.
протокол
1. Instrumentation
- To measure the response of olfactory sensory neurons to photolysis of caged compounds we use a flash lamp in combination with a typical patch-clamp recording system including: a patch-clamp amplifier, a recording electrode and a reference electrode connected to the head-stage of a patch-clamp amplifier, a digitizer, a computer, software for data acquisition, micro-manipulators, an epifluorescence microscope, a perfusion system, an anti-vibration table and a Faraday cage (Figure 2).
- To generate a high-intensity flash of ultraviolet (UV) light we use a Xenon flash lamp (Rapp OptoElectronic JML-C2 Flash Unit, Figure 3A) that functions by discharging a high voltage capacitor across a short-arc flash tube that is filled with Xenon gas6-7. The light flash can be triggered manually or by the computer, using the same software that controls electrophysiological acquisition.
- A UV short pass filter optimized for uncaging applications (270-390 nm) is inserted into an output slot of the flash lamp and a quartz fiber optic light guide is connected to the microscope (see 1.5).
- The intensity of the light flash and therefore the extent of photolysis can be modified by changing specific parameters:
voltage or capacitance6. Indeed, the light intensity is related to the energy stored in the capacitor and depends on the capacitance value and on the voltage across it, according to the standard relation 0.5 CV2. One of three capacitance values can be selected on the front panel of our flash lamp (C1=1000 μF, C2=2000 μF, or C3=3000 μF) and the voltage can be varied between 100 to 385 Volts (Figure 3A), producing a stored energy ranging between 5 and 220 J. The flash duration varies from 0.5 to 1 ms at full half maximal width and depends on the selected capacitance value. Before selecting a different capacitance or setting the voltage to a lower value, it is necessary to discharge the capacitor, by selecting the discharge mode on the front panel of the flash lamp (Figure 3A).
However the light energy is not simply proportional to the stored energy due to manyfold reasons related to the physics of gas discharges and to non-linear losses in the circuit as the electrical energy is increased6. To measure the energy associated to a light flash, a joulemeter, as the JM10 provided by RappOptoElectronics, can be used. Note that the energy at the exit of the quartz light guide with UV filter in place is in the range 1-15 mJ per flash, as reported in the user guide of the Rapp OptoElectronic Flash Unit.
A photodiode assembly (Figure 3B) is provided with the flash lamp unit and can be used to estimate variations of light intensities as a function of C and V. Indeed, the output of the photodiode is proportional to the light intensity. Following the user guide instructions, the light guide is connected to the input of the photodiode assembly, while the output is connected to an oscilloscope. Figure 3C shows the peak output voltage of the photodiode in response to light flashes for the three capacitance values C1, C2, or C3, available in our flash lamp unit, versus the applied voltage. These values will change as the flash bulb becomes old. It is a good practice to regularly use the photodiode to check the deterioration of the flash bulb.
Instead of modifying the capacitance and/or voltage on the front panel, a more precise and faster control of light intensity is obtained by placing neutral density filters into a second filter slot of the flash lamp (Figure 3A). This approach is quicker and additionally the flash duration, that depends on the selected capacitance value, is not modified. With neutral density filters ranging from 100% to 0.1 % transmission the flash intensity can be quickly modified over a large range. - The light flash is directed to the neuron, plated on glass-bottom dishes, through a quartz fiber optic light guide (Figure 2). The light guide is connected to the epifluorescence attachment of the inverted microscope using an adapter. A modified filter cube without excitation filter directs the UV beam to the neuron by a dichroic mirror.
- The light is focused through a 100x oil immersion objective. The area covered by the flash is visualized by inserting the light guide into an illuminator that provides a continuous source of visible light. The image (represented in yellow in the video) is viewed on a monitor through a CCD camera connected to the microscope. The contour of the illuminated area is drawn on the monitor to localize the UV flash area for the experiments. Before delivering the UV flash, the ciliary region of the neuron is brought into the area drawn on the monitor.
- The dimension of the spot of UV light is controlled by the objective magnification, the diameter of the light guide, and the position of the light guide at the back of the microscope. We use a 100x magnification oil immersion objective. The diameter of the circular spot is measured by directing the light from an illuminator on a micrometer slide placed on the stage of the microscope. The spot diameter in our set-up is approximately 16, 33, 50 or 105 μm for a light guide with a diameter respectively of 200, 400, 600 or 1250 μm.
2. Preparing solutions
Dissection
- Ringer’s solution: 140 mM NaCl, 5 mM KCl, 1 mM CaCl2, 1 mM MgCl2, 10 mM HEPES, 10 mM glucose, 1 mM sodium pyruvate (pH 7.4 adjusted with 1M NaOH).
- Stop mix solution: Ringer’s solution with 0.1 mg/ml BSA, 0.3 mg/ml leupeptin, and 0.02 mg/ml DNaseI.
- Zero-divalent Ringer’s solution: 140 mM NaCl, 5 mM KCl, 10 mM HEPES, 1 mM EDTA, 10 mM glucose, 1 mM sodium pyruvate (pH 7.4 with 1M NaOH). Add 200 μM cysteine and 2 U/ml papain for enzymatic dissociation.
Note: Sterile filter the solutions for dissection.
Patch-clamp recording solutions
Extracellular solutions
- Extracellular Ringer’s solution: 140 mM NaCl, 5 mM KCl, 1 mM CaCl2, 1 mM MgCl2, 10 mM HEPES, 10 mM glucose, 1 mM sodium pyruvate (pH 7.4 adjusted with 1M NaOH).
- Low-Ca Ringer’s solution: 140 mM NaCl, 5 mM KCl, 10 mM EGTA, 1 mM MgCl2, 10 mM HEPES, 10 mM glucose, 1 mM sodium pyruvate (pH 7.4 adjusted with 1M NaOH).
Intracellular solutions
Always prepare and use caged compound solutions in dim light to avoid degradation of caged compounds from ambient light. Protect containers from light using aluminum foil.
Caged cAMP:
- Make an intracellular solution containing 145 mM KCl, 4 mM MgCl2, 0.5 mM EGTA, 10 mM HEPES, 1 mM MgATP and 0.1 mM NaGTP (pH 7.4 adjusted with 1M KOH).
- Make a stock solution dissolving caged cAMP (BCMCM-cAMP4) in DMSO at 50 mM. Make aliquots of 5 μl. Store up to one year at -20°C.
- Dissolve an aliquot of the caged cAMP stock solution in the intracellular solution to obtain a final concentration of 50 μM caged cAMP. Mix using a vortex.
- Make aliquots of 1 ml of the caged cAMP intracellular solution. Store up to two months at -20°C until use.
Caged Ca:
We prepare intracellular solutions containing 3 mM DMNP-EDTA5 50% loaded with 1.5 mM Ca.
- Make an intracellular solution containing 140 mM KCl (or CsCl), 10 mM HEPES (pH 7.4 adjusted with 1M KOH or CsOH).
- Open a vial of 5 mg DMNP-EDTA. Add 52.8 μl of a 0.1 M calcium chloride standard solution and 1 ml of intracellular solution. Mix using a vortex.
- To avoid uncaging of caged Ca by ambient light, transfer the solution to a tube protected from light with aluminum foil. Add intracellular solution to reach a final volume of 3.5 ml. Mix using a vortex. Make aliquots of about 1 ml of the caged Ca intracellular solution and store up to two months at -20°C until use.
Notes: During experiments, protect caged compound solutions from light using aluminum foil and keep them on ice. Sterile filter the intracellular solution.
3. Dissociation of mouse olfactory sensory neurons
Animals were handled in accordance with the Italian Guidelines for the Use of Laboratory Animals (Decreto Legislativo 27/01/1992, no. 116) and European Union guidelines on animal research (No. 86/609/EEC).
- Prepare three glass-bottom dishes coated with 10 mg/ml concanavalin-A and 10 mg/ml poly-L-lysine.
- To prepare for the dissection, prepare 1 ml of zero-divalent Ringer’s solution. Fill two 50 mm Sylgard coated Petri dishes with Ringer’s solution and place them on ice. Also chill a papain-cysteine mix, 0.5 ml of the stop mix solution, and a syringe with a 0.22 μm filter containing about 10 ml Ringer’s solution.
- Sacrifice a mouse by CO2 asphyxiation followed by decapitation. Remove the skin overlying the skull, cut along the jaw lines and place the head in a Sylgard coated Petri dish.
- Place the dish under a stereomicroscope. Using a scalpel, sagitally bisect the head along the midline. Turn half of the head with the medial side up. Carefully remove the septum to expose the turbinates (see also Cygnar et al., 201013).
- Using number 3 forceps and a scalpel remove turbinates lined with the olfactory epithelium. Transfer to a Sylgard coated Petri dish.
- Using number 55 superfine forceps, separate the pieces of olfactory epithelium from the attached parts of turbinates. Transfer them to a tube containing 1 ml zero divalent Ringer’s solution. Add the papain and cysteine mix. Using micro-scissors, mince the epithelia and incubate at room temperature for 3 minutes. Gently mince again with micro-scissors and wait for 5 additional minutes.
- Using a flame-polished Pasteur pipette, transfer to a tube containing 0.5 ml of the stop mix solution.
- Centrifuge at 300 g (1500 RPM) for 5 minutes. Discard the supernatant and add about 1 ml of filtered Ringer’s solution. Gently triturate with a flame-polished Pasteur pipette.
- Plate about 0.3 ml of the solution containing the cells in the center of the three glass-bottom dishes. Allow cells to settle for about one hour at +4°C. Add Ringer’s solution.
4. Recording
- Prepare patch pipettes from borosilicate capillaries to obtain resistances of 3-7 MΩ when filled with intracellular solution.
- Place one glass-bottom dish containing the dissociated olfactory sensory neurons on the stage of the inverted microscope. Perfuse with Ringer’s solution.
- Protect a syringe containing the intracellular solution with caged compounds from light with aluminum foil and keep it refrigerated. Work in dim light to avoid degradation of caged compounds from ambient light.
- Look for an isolated olfactory sensory neuron with intact cilia at 100x magnification. Move the stage of the microscope to position the ciliary region inside the circle drawn on the monitor to localize the previously identified UV flash area.
- Fill a patch pipette with the intracellular solution containing the caged compound using a flexible needle. Remove bubbles from the pipette tip. Insert the pipette into the holder on the headstage of the patch-clamp amplifier. Approach the soma of the neuron using the micromanipulator and apply gentle suction to obtain a gigaohm seal. Set the voltage at -60 mV and apply additional suction to reach the whole-cell mode using standard patch-clamp techniques12.
- Wait for at least two minutes for the diffusion of the caged compound into the cilia.
- On the computer start a stimulation protocol and record the response. Use a low-pass filter at 1 kHz and digitize at a sample frequency of at least 2 kHz.
- A typical stimulation protocol clamps the voltage at a constant value and triggers the release of a UV flash from the flash lamp for photolysis of the caged compound in the ciliary region.
5. Representative results:
You should be able to produce local uncaging of caged cAMP or of caged Ca in the ciliary region of an isolated olfactory sensory neuron and record the current response in the whole-cell voltage-clamp configuration.
Figure 4 shows a typical inward current elicited by a UV flash producing photolysis of caged cAMP, recorded at a voltage of -60 mV in the presence of an extracellular low Ca Ringer’s solution. In this condition the inward current is due to Na entry through CNG channels. The rising phase of the current was fast and was fitted by a single exponential function with a time constant of 3.4 ms.
Figure 5A-B show the responses of another olfactory sensory neuron in low Ca and in Ringer’s solution with 1mM Ca. The rising phase of the current at -60 mV became much slower and multiphasic (Figure 5 A-B). This is due to the action of Ca entering the cilia through CNG channels and activating a secondary Cl current10. The earlier cationic current component, due to activation of CNG, is smaller in 1mM Ca Ringer solution than in low Ca solution because of the block due to the permeating Ca ions that reduce the overall current.
Another way to reduce the increase of Ca in the cilia is to clamp the neuron at +60 mV (Figure 5 C-D). The rising phase of the response due to cAMP uncaging at +60 mV was well described by a single exponential with a time constant of 6.7 ms, indicating the presence of only one current component.
By photoreleasing Ca inside the cilia of an olfactory sensory neuron you should be able to measure a rapidly rising current. This current is carried by Cl ions. Figure 6 A shows inward currents at -50 mV induced by photorelease of caged Ca in response to UV flashes of different intensities. The rising phase of the Ca-activated Cl currents was well described by a single exponential with time constants varying between 3.8 to 5 ms (Figure 6 B).
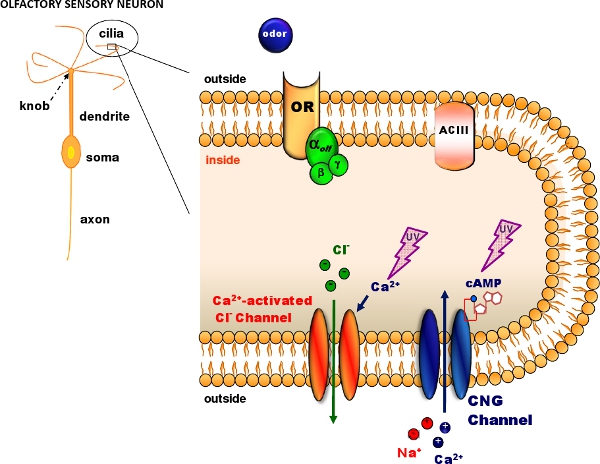
Figure 1. Olfactory transduction in the cilia of olfactory sensory neurons. Odorant molecules bind to odorant receptors (OR) activating a G protein that in turns activates adenylyl cyclase (ACIII) producing an intracellular increase in cAMP. cAMP opens cyclic nucleotide-gated (CNG) channels allowing the entry of Na and Ca ions. The intracellular Ca increase activates Ca-activated Cl channels. Caged cAMP or caged Ca can be introduced in the cilia diffusing through a patch pipette. A flash of UV light produces photolysis of the caged compound (Modified, with permission, from Pifferi et al. 20062).
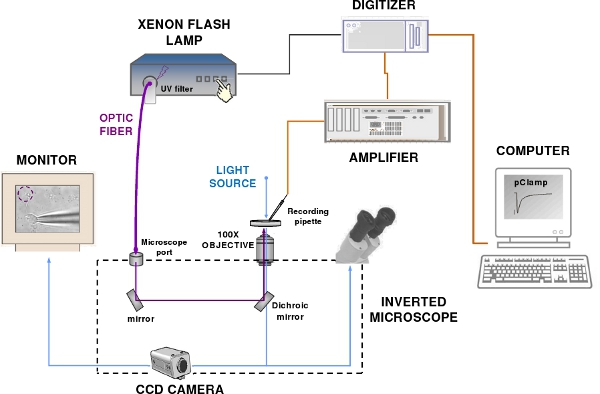
Figure 2. The patch-clamp recording and flash photolysis system. The set-up components include a patch-clamp amplifier, a computer, a digitizer, an epifluorescence microscope, a Xenon flash lamp, a CCD camera and a monitor. Blue and violet lines indicate respectively the visible and UV light path.
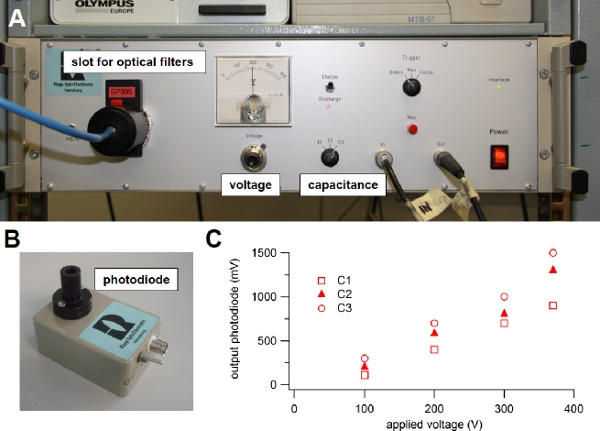
Figure 3. Xenon flash lamp. (A) Light source used for flash photolysis of caged compounds. (B) Photodiode module used to evaluate the intensity of the light flash. (C) The light guide from the flash lamp was connected to the input of the photodiode and the output was visualized onto an oscilloscope. One of the three available capacitance values (C1, C2 or C3) was selected on the front panel switch of the flash lamp and the voltage was changed turning the knob on the front panel. The output voltage from the photodiode in response to different flash intensities was plotted versus the applied voltage for each capacitance value: C1 = 1000 μF, C2 = 2000 μF, or C3 = 3000 μF. A 600 μm diameter light guide was used.
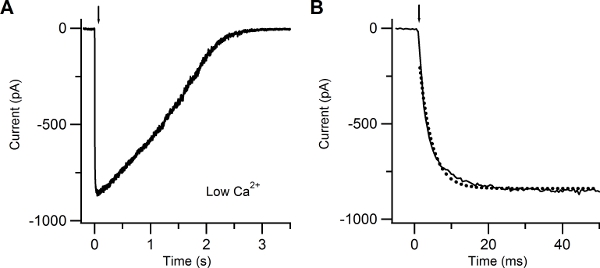
Figure 4. Patch-clamp recording in response to photolysis of caged cAMP in low extracellular Ca solution. (A) Whole-cell current response induced in an isolated olfactory sensory neuron by photolysis of caged cAMP localized to the cilia. A UV flash was released at the time indicated by the arrow. The holding potential was -60 mV. (B) The current rising phase was well fitted with a single exponential function (dotted line) with a time constant of 3.4 ms.
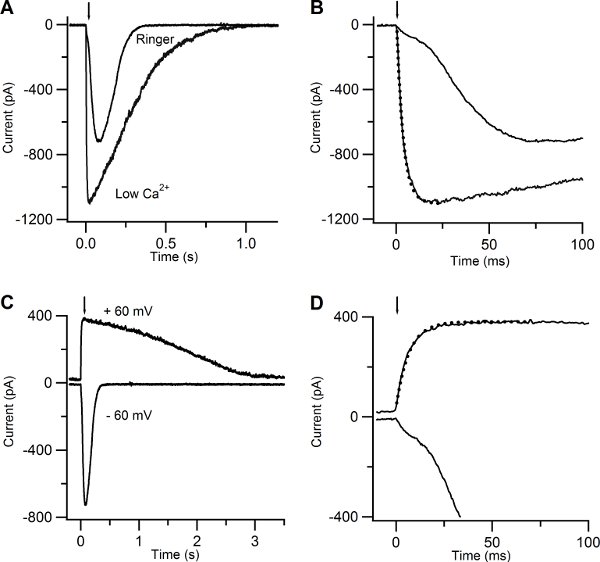
Figure 5. Current responses induced by photolysis of caged cAMP in low Ca and in Ringer solutions. (A) An olfactory sensory neuron was bathed in Ringer solution containing 1 mM Ca or in low Ca solution at the holding potential of -60 mV. A UV flash was released at the time indicated by the arrow. (B) Current responses plotted on an expanded timescale showed a multiphasic rising phase in Ringer, while the rising phase was well fitted with a single exponential function (dotted line) with a time constant of 3.5 ms for the response recorded in low Ca solution. (C) Currents responses from the same neuron shown in (A) bathed in Ringer’s solution at the holding potential of -60 and +60 mV. (D) Current responses plotted on an expanded timescale displayed a multiphasic rising phase at -60 mV, whereas at +60 mV the rising phase was well fitted by a single exponential with a time constant of 6.7 ms (dotted line).
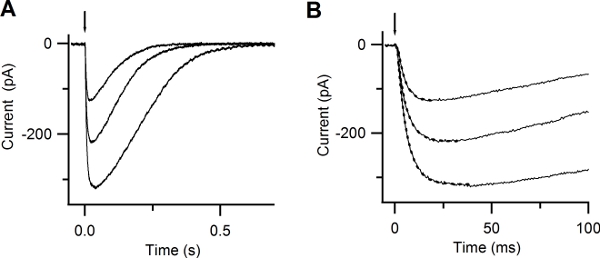
Figure 6. Responses to photolysis of caged Ca. (A) Whole-cell currents induced by photolysis of caged Ca at -50 mV. UV flashes were released at the time indicated by the arrow. Flash intensities were varied with neutral density filters. (B) Expanded timescale shows the rapid increase in the current after Ca photorelease. Currents were well fitted by a single exponential function (dotted lines), with time constants of 5, 4.8, 3.8 ms. (Reproduced, with permission, from Boccaccio & Menini, 200710).
Обсуждение
Флэш фотолиза клетке соединений в сочетании с патч-зажим записи является полезным методом для получения быстрого и местных скачков концентрации физиологически активных молекул внутри и вне клетки. Несколько типов клетке compounds1 были синтезированы, и эта техника может быть применена к ?...
Раскрытие информации
Нет конфликта интересов объявлены.
Материалы
| Name | Company | Catalog Number | Comments |
| Оборудование | Компания | Номер по каталогу | Комментарии |
|---|---|---|---|
| Адаптер модуля лампы-вспышки с микроскопом | Рапп Оптоэлектронные | FlashCube 70 | |
| Воздух стол | TMC | МИКРО-г 63-534 | |
| Digitizer | Axon инструменты | DIGIDATA 1322A | |
| ПО для сбора данных | Axon инструменты | pClamp 8 | |
| Анализ данных программного обеспечения | WaveMetrics | Игорь | |
| Зеркало для модуль адаптера | Рапп Оптоэлектронные | M70/100 | |
| Держатель электрода | Axon инструменты | 1-HL-U | |
| Фарадея клетке | На заказ | ||
| Фильтры куб | Олимп | U-MWU | Возбуждение фильтр удален |
| Импульсная лампа | Рапп Оптоэлектронные | JML-C2 | |
| Пинцет Дюмон # 55 | Инструменты Всемирной Precision | 14099 | |
| Стекло капилляров | Инструменты Всемирной Precision | PG10165-4 | |
| Блюдо с прозрачным дном | Инструменты Всемирной Precision | FD35-100 | |
| Осветитель | Олимп | Выделите 3100 | |
| Инвертационный микроскоп | Олимп | IX70 | |
| Микроманипуляторы | Luigs и Неймана | С. М. Я | |
| Микропипетки Puller | Narishige | PP-830 | |
| Монитор | HesaVision | МТБ-01 | |
| Фильтры нейтральной плотности | Омега Оптические | меняется | |
| Цель 100X | Zeiss | Fluar 440285 | Либо Zeiss или Olympuы |
| Цель 100X | Олимп | UPLFLN 100XOI2 | Либо Zeiss или Olympus |
| Оптический фильтр УФ shortpass | Рапп Оптоэлектронные | SP400 | |
| Патч-зажим усилителя | Axon инструменты | Axopatch 200B | |
| Фотодиод Ассамблеи | Рапп Оптоэлектронные | КПК | |
| Кварцевый световод | Рапп Оптоэлектронные | меняется | Мы используем 600 мкм в диаметре |
| Серебряная проволока | Инструменты Всемирной Precision | AGT1025 | |
| Серебряная земля гранул | Warner инструменты | 64-1309 | |
| Ксеноновая дуговая лампа | Рапп Оптоэлектронные | XBL-JML |
| Реагент | Компания | Номер по каталогу |
|---|---|---|
| BCMCM-клетке цАМФ | Биолог | B016 |
| Бычий сывороточный альбумин (BSA) | Сигма | A8806 |
| CaCl2 стандартный раствор 0,1 М | Fluka | 21059 |
| Caged Ca: DMNP-ЭДТА | Invitrogen | D6814 |
| Цистеин | Сигма | C9768 |
| Конканавалин типа V (ConA) | Сигма | C7275 |
| CsCl | Сигма | C4036 |
| ДМСО | Сигма | D8418 |
| Я ДНКазы | Сигма | D4527 |
| ЭДТА | Сигма | E9884 |
| EGTA | Сигма | E4378 |
| Глюкоза | Сигма | G5767 |
| HEPES | Сигма | H3375 |
| KCl | Сигма | P3911 |
| КОН | Сигма | P1767 |
| Leupeptin | Сигма | L0649 |
| MgCl2 | Fluka | 63020 |
| Папаин | Сигма | P3125 |
| Poly-L-лизин | Сигма | P1274 |
| NaCl | Сигма | S9888 |
| NaOH | Сигма | S5881 |
| NaPyruvate | Сигма | P2256 |
Ссылки
- Ellis-Davies, G. C. R. Caged compounds: photorelease technology for control of cellular chemistry and physiology. Nat. Methods. 4, 619-628 (2007).
- Pifferi, S., Boccaccio, A., Menini, A. Cyclic nucleotide-gated ion channels in sensory transduction. FEBS Lett. 580, 2853-2859 (2006).
- Bozza, T. C., Kauer, J. S. Odorant response properties of convergent olfactory receptor neurons. J. Neurosci. 18, 4560-4569 (1998).
- Hagen, V., Bendig, J., Frings, S., Eckardt, T., Helm, S., Reuter, D. Highly Efficient and Ultrafast Phototriggers for cAMP and cGMP by Using Long-Wavelength UV/Vis-Activation. Angew. Chem. Int. Ed. Engl. 40, 1045-1048 (2001).
- Kaplan, J. H., Ellis-Davies, G. C. Photolabile chelators for the rapid photorelease of divalent cations. Proc. Natl. Acad. Sci. 85, 6571-6575 (1988).
- Rapp, G. Flash lamp-based irradiation of caged compounds. Methods. Enzymol. 291, 202-222 (1998).
- Gurney, A. M., Montenegro, I., Queiros, M. A., Daschbach, J. L. Flash photolysis of caged compounds. Microelectrodes: Theory and Applications. , (1991).
- Lagostena, L., Menini, A. Whole-cell recordings and photolysis of caged compounds in olfactory sensory neurons isolated from the mouse. Chem. Senses. 28, 705-716 (2003).
- Boccaccio, A., Lagostena, L., Hagen, V., Menini, A. Fast adaptation in mouse olfactory sensory neurons does not require the activity of phosphodiesterase. J. Gen. Physiol. 128, 171-184 (2006).
- Boccaccio, A., Menini, A. Temporal development of cyclic nucleotide-gated and Ca2+ -activated Cl- currents in isolated mouse olfactory sensory neurons. J. Neurophysiol. 98, 153-160 (2007).
- Sagheddu, C., Boccaccio, A., Dibattista, M., Montani, G., Tirindelli, R., Menini, A. Calcium concentration jumps reveal dynamic ion selectivity of calcium-activated chloride currents in mouse olfactory sensory neurons and TMEM16B-transfected HEK 293T cells. J. Physiol. 588, 4189-4204 (2010).
- Balana, B., Taylor, N., Slesinger, P. A. Mutagenesis and Functional Analysis of Ion Channels Heterologously Expressed in Mammalian Cells. J. Vis. Exp. (44), e2189-e2189 (2010).
- Cygnar, K. D., Stephan, A. B., Zhao, H. Analyzing Responses of Mouse Olfactory Sensory Neurons Using the Air-phase Electroolfactogram Recording. J. Vis. Exp. (37), e1850-e1850 (2010).
- Bernardinelli, Y., Haeberli, C., Chatton, J. Y. Flash photolysis using a light emitting diode: an efficient, compact, and affordable solution. Cell. Calcium. 37, 565-572 (2005).
Перепечатки и разрешения
Запросить разрешение на использование текста или рисунков этого JoVE статьи
Запросить разрешениеСмотреть дополнительные статьи
This article has been published
Video Coming Soon
Авторские права © 2025 MyJoVE Corporation. Все права защищены