
Calibration Curves
Обзор
Source: Laboratory of Dr. B. Jill Venton - University of Virginia
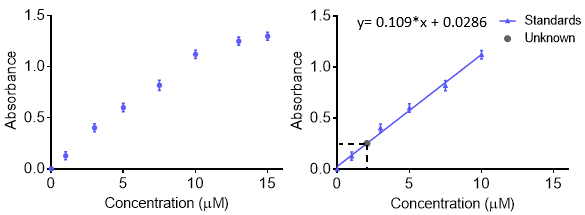
Calibration curves are used to understand the instrumental response to an analyte and predict the concentration in an unknown sample. Generally, a set of standard samples are made at various concentrations with a range than includes the unknown of interest and the instrumental response at each concentration is recorded. For more accuracy and to understand the error, the response at each concentration can be repeated so an error bar is obtained. The data are then fit with a function so that unknown concentrations can be predicted. Typically the response is linear, however, a curve can be made with other functions as long as the function is known. The calibration curve can be used to calculate the limit of detection and limit of quantitation.
When making solutions for a calibration curve, each solution can be made separately. However, that can take a lot of starting material and be time consuming. Another method for making many different concentrations of a solution is to use serial dilutions. With serial dilutions, a concentrated sample is diluted down in a stepwise manner to make lower concentrations. The next sample is made from the previous dilution, and the dilution factor is often kept constant. The advantage is that only one initial solution is needed. The disadvantage is that any errors in solution making—pipetting, massing, etc.—get propagated as more solutions are made. Thus, care must be taken when making the initial solution.
Процедура
1. Making the Standards: Serial Dilutions
- Make a concentrated stock solution of the standard. Typically, the compound is accurately weighed out and then quantitatively transferred into a volumetric flask. Add some solvent, mix so the sample dissolves, then fill to the line with the proper solvent.
- Perform serial dilutions. Take another volumetric flask and pipette the amount of standard needed for the dilution, then fill to the line with solvent and mix. A ten-fold dilution is typically made, so for
Заявка и Краткое содержание
Calibration curves are used in many fields of analytical chemistry, biochemistry, and pharmaceutical chemistry. It is common to use them with spectroscopy, chromatography, and electrochemistry measurements. A calibration curve can be used to understand the concentration of an environmental pollutant in a soil sample. It could be used determine the concentration of a neurotransmitter in a sample of brain fluid, vitamin in pharmaceutical samples, or caffeine in food. Thus, calibration curves are useful in environmental, bi
Перейти к...
Видео из этой коллекции:

Now Playing
Calibration Curves
Analytical Chemistry
798.5K Просмотры

Sample Preparation for Analytical Characterization
Analytical Chemistry
85.2K Просмотры

Internal Standards
Analytical Chemistry
205.3K Просмотры

Method of Standard Addition
Analytical Chemistry
320.7K Просмотры

Ultraviolet-Visible (UV-Vis) Spectroscopy
Analytical Chemistry
625.1K Просмотры

Raman Spectroscopy for Chemical Analysis
Analytical Chemistry
51.4K Просмотры

X-ray Fluorescence (XRF)
Analytical Chemistry
25.9K Просмотры

Gas Chromatography (GC) with Flame-Ionization Detection
Analytical Chemistry
283.0K Просмотры

High-Performance Liquid Chromatography (HPLC)
Analytical Chemistry
385.8K Просмотры

Ion-Exchange Chromatography
Analytical Chemistry
265.0K Просмотры

Capillary Electrophoresis (CE)
Analytical Chemistry
94.4K Просмотры

Introduction to Mass Spectrometry
Analytical Chemistry
112.8K Просмотры

Scanning Electron Microscopy (SEM)
Analytical Chemistry
87.6K Просмотры

Electrochemical Measurements of Supported Catalysts Using a Potentiostat/Galvanostat
Analytical Chemistry
51.8K Просмотры

Cyclic Voltammetry (CV)
Analytical Chemistry
125.9K Просмотры
Авторские права © 2025 MyJoVE Corporation. Все права защищены