Method Article
OLIgo Mass Profiling (OLIMP) of Extracellular Polysaccharides
In This Article
Summary
A rapid way is described to gain insights into the structure of polysaccharides in an extracellular matrix. The method takes advantage of the specificity of glycosylhydrolases and the sensitivity of mass spectrometry allowing minute amounts of materials to be analyzed. This technique is adaptable to be used directly on tissue itself.
Abstract
The direct contact of cells to the environment is mediated in many organisms by an extracellular matrix. One common aspect of extracellular matrices is that they contain complex sugar moieties in form of glycoproteins, proteoglycans, and/or polysaccharides. Examples include the extracellular matrix of humans and animal cells consisting mainly of fibrillar proteins and proteoglycans or the polysaccharide based cell walls of plants and fungi, and the proteoglycan/glycolipid based cell walls of bacteria. All these glycostructures play vital roles in cell-to-cell and cell-to-environment communication and signalling.
An extraordinary complex example of an extracellular matrix is present in the walls of higher plant cells. Their wall is made almost entirely of sugars, up to 75% dry weight, and consists of the most abundant biopolymers present on this planet. Therefore, research is conducted how to utilize these materials best as a carbon-neutral renewable resource to replace petrochemicals derived from fossil fuel. The main challenge for fuel conversion remains the recalcitrance of walls to enzymatic or chemical degradation due to the unique glycostructures present in this unique biocomposite.
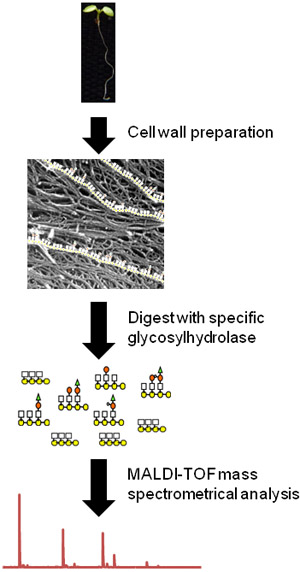
Here, we present a method for the rapid and sensitive analysis of plant cell wall glycostructures. This method OLIgo Mass Profiling (OLIMP) is based the enzymatic release of oligosaccharides from wall materials facilitating specific glycosylhydrolases and subsequent analysis of the solubilized oligosaccharide mixtures using matrix-assisted laser desorption/ionization time-of-flight mass spectrometry (MALDI-TOF/MS)1 (Figure 1). OLIMP requires walls of only 5000 cells for a complete analysis, can be performed on the tissue itself2, and is amenable to high-throughput analyses3. While the absolute amount of the solubilized oligosaccharides cannot be determined by OLIMP the relative abundance of the various oligosaccharide ions can be delineated from the mass spectra giving insights about the substitution-pattern of the native polysaccharide present in the wall.
OLIMP can be used to analyze a wide variety of wall polymers, limited only by the availability of specific enzymes4. For example, for the analysis of polymers present in the plant cell wall enzymes are available to analyse the hemicelluloses xyloglucan using a xyloglucanase5, 11, 12, 13, xylan using an endo-β-(1-4)-xylanase 6,7, or for pectic polysaccharides using a combination of a polygalacturonase and a methylesterase 8. Furthermore, using the same principles of OLIMP glycosylhydrolase and even glycosyltransferase activities can be monitored and determined 9.
Protocol
The OLIMP method is exemplified on the major hemicellulose present in the cell walls of dicot plants, xyloglucan, using an endoglucanase as the glycosylhydrolase. The method is demonstrated with whole Arabidopsis seedlings as a plant tissue source. Enzyme and extracellular matrix material can be substituted depending on the desired analysis using the same procedure.
1. Cell wall isolation
- Harvest five 5-day old whole Arabidopsis seedlings or the equivalent amount of your desired material and transfer them into a 1.5mL reaction tube. Make sure that the material is placed in the bottom of the tube.
- Add two 3mm metal balls to the reaction tube on top of the sample and snap-freeze in liquid nitrogen.
- Grind the frozen sample using a ball-mill (2:30min, 25Hz).
- Add 1mL 70% aqueous ethanol to the sample. Remove the metal balls using a magnet. Vortex thoroughly.
- Centrifuge sample at 14,000rpm for 10min to pellet the alcohol insoluble residue containing the cell wall material.
- Carefully remove the supernatant by aspiration. Make sure not to disturb the pellet.
- Add 1mL of chloroform/methanol (1:1 v/v) solution. Vortex thoroughly to resuspend the pellet.
- Centrifuge sample at 14,000rpm for 10 min and carefully remove the supernatant by aspiration. Make sure not to disturb the pellet.
- Dry the sample using a concentrator.
2. Solubilization of oligosaccharides
- For the solubilization the particular polysaccharide in form of its oligosaccharides resuspend the dry pellet in 25μl of an appropriate buffer. For the endoglucanase 50mM Ammonium formate, pH4.5, is used. Add 0.2U of endoglucanase. Vortex the suspension and spin liquid down.
- Incubate the sample for 16h at 37°C in an incubator, shaking at 300rpm.
- Remove the solvent of the digest (water) using a concentrator.
3. MALDI-TOF analysis of the released oligosaccharides
- BioRex MSZ 501 cation exchange resin beads are used to remove salts and enzyme from the digested sample. Condition the beads by placing an aliquot in an empty column and washing the beads with copious amounts of water.
- Add 5-10 BioRex beads to the digested and dried sample. Then add 10μl water, for smaller amounts of material 5μl of water may be used. Immerse the beads in the solution by briefly spinning the tube. Incubate for at least 10min at room temperature.
- Spot 2μl matrix (2,5-dihydroxybenzoic acid (DHB), 10mg/ml in water) onto a MALDI target plate. Evaporate the matrix solvent under vacuum leading to homogenous matrix chemical crystals.
- Spot 2μl of the desalted sample solution on top of the matrix crystals on the target plate.
If you want to spot a large number of samples only keep on spotting for a maximum of 3min. This time-frame ensures that the first spotted sample is not dry yet. Wait for an additional 2min to ensure a thorough mixing of re-dissolved matrix and sample oligosaccharide molecules in the last spotted sample. Then dry the target plate under a vacuum.
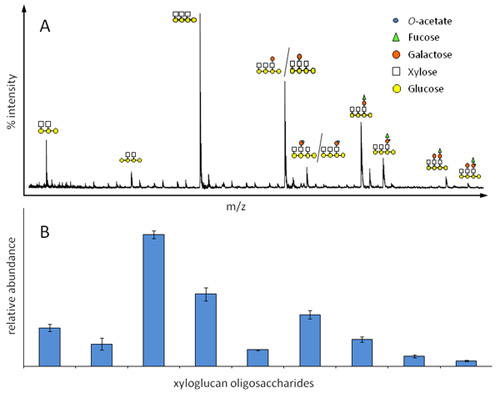
The sample/matrix mix should crystallize in less than 1min to enable homogenous crystallization. - Place target plate into a MALDI-TOF mass spectrometer. The machine should be set to positive reflectron mode with an accelerating voltage of 20000V and a delay of 350 nm; the selected mass range should be 500-3000 Da (may change dependent on the expected oligomers). Start firing the laser and collect 100-200 spectra per sample, which are compiled to generate a representative average spectrum (Figure 2A). Ions representing specific oligosaccharides can be identified by their mass over charge (m/z) ratio. The ion intensities (peak height) of all ions of interest should be added up to 100% resulting in the relative abundance of each oligosaccharide in the sample (Figure 2B).
4. In situ OLIMP analysis
OLIMP can also be used directly on the tissue omitting any wall preparation steps. As an example etiolated hypocotyls of Arabidopsis as a plant tissue source are used. Again, an endoglucanase is used to determine the structure of the hemicelluloses xyloglucan. Enzyme and tissue material can be substituted depending on the desired analysis using the same procedure.
- Harvest an etiolated seedling and place it onto an empty MALDI target plate and let the seedling dry.
- Add 0.5μl endoglucanase (0.4U/μl, dissolved in 50mM Ammonium formate, pH4.5) on the dried seedling at the desired position. Make sure that the enzyme drop touches partly the target plate.
- Place the MALDI target plate in a closed container with saturating humidity to avoid that the enzyme drop dries out. Incubate the plate in the chamber for 16h at 37°C.
- Dry the MALDI target plate with the plant tissue and the enzyme drop under vacuum.
- Add 0.5μl matrix (DHB; 10mg/l) on top of each dried enzyme spot. Let it stand for 2min.
- Dry the MALDI target plate under vacuum.
- Analyze samples with the MALDI-TOF. Place target plate with the tissue and the enzyme/matrix spot(s) into a MALDI-TOF mass spectrometer. The machine should be set to positive reflectron mode with an accelerating voltage of 20000V and a delay of 350 nm; the selected mass range should be 500-3000 Da (may change dependent on the expected oligomers).
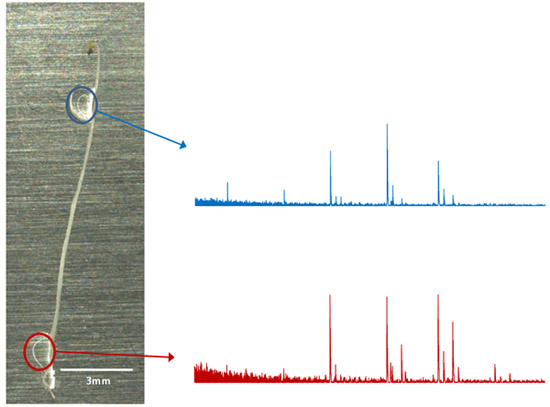
- Start firing the laser onto the matrix/sample crystals NEXT to the tissue. Make sure you don't hit the tissue itself, as in such a case the time-of flight of the molecules will be off. Collect around 20-50 spectra per spot, which are compiled to generate a representative average spectrum (Figure 3). Ions representing specific oligosaccharides can be identified by their mass over charge (m/z) ratio. The ion intensities (ion height) can be reported and all ions of interest should be added up to 100% resulting in the relative abundance of each oligosaccharides in the sample.
5. Representative Results
An example of an OLIMP analysis of the hemicelluloses xyloglucan present in Arabidopsis seedlings is shown in Figure 2. Due to the mass differences of the ions and the known well characterized enzyme (endoglucanase) specificity the ions can be assigned to specific oligosaccharide structures (Figure 2A). Obviously, structural isomers cannot be distinguished. The basic assumption for the determination of the relative abundance of the various oligosaccharides (Figure 2B) is that their mass spec response factor is very similar for those oligosaccharides. As shown here, the OLIMP quantification is highly reproducible. However, please note that robustness of the method is highly dependent on the signal to noise ratios of the various oligosaccharide ions. For example contamination with salts or lower amounts of oligosaccharides can decrease that ratio.
The OLIMP analysis on the tissue itself (in situ analysis) enables the study of very small and defined areas and involves very little sample preparation. In the example presented here (Figure 3) no qualitative (same ions) but quantitative differences (variation in the ion intensities) were observed between the shoot and root-tissue of the Arabidopsis seedling. Permutations of the OLIMP-method could thus lead to tissue "imaging".

Figure 1. Flow chart of the OLIMP procedure using whole Arabidopsis seedlings as a plant source. First, the tissue is macerated and cell wall material is prepared (picture modified from Fujino et al.10). Then oligosaccharides of a particular wall polysaccharide are released using a specific hydrolase. Finally, the relative abundances of the soluble oligosaccharides are determined using MALDI-TOF mass spectrometry.

Figure 2. Relative abundance of xyloglucan oligosaccharides in etiolated seedlings from Arabidopsis as determined by OLIMP. A) Representative xyloglucan oligosaccharide mass spectrum; each ion represents a specific oligosaccharide structure, structural isomers cannot be distinguished. B) Corresponding bar diagram for the determination of the relative oligosaccharide abundance.

Figure 3. In situ OLIMP analysis using etiolated seedlings of Arabidopsis as example. Each enzyme/digestion droplet (colored circles) can be analyzed independently and a corresponding mass spectra can be obtained and analyzed.

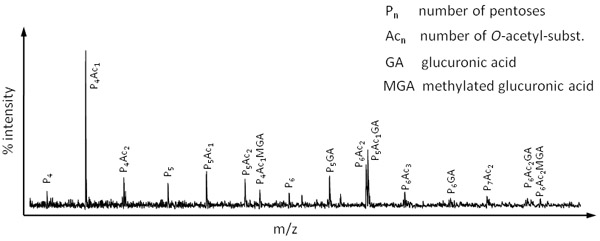
Figure 4. OLIMP spectrum of the hemicellulose xylan obtained by digesting Miscanthus leaf material with a xylanase (Megazyme).
Discussion
The OLIMP method presented here enables a very sensitive and rapid analysis of polymers present in the extracellular matrices. OLIMP combines the enzymatic release of oligomers with subsequent MALDI-TOF analysis. The generation of a MALDI-TOF spectrum takes less than one minute; hence OLIMP is suitable for a wide range of applications including high-throughput studies such as mutant screens. OLIMP is not restricted to plant polysaccharides but can potentially be applied to a wide range of polymers, only limited by the availability of specific hydrolytic enzymes. However, a limitation of OLIMP is that an absolute abundance of the polymer cannot be obtained.
As mentioned before OLIMP can be used to study the structure of a variety of polysaccharides present in the extracellular matrix of a diversity of species. As an example, Figure 4 represents an OLIMP spectrum of the major hemicellulose in grass species, xylan. Here, cell wall material derived from the temperate grass Miscanthus was digested using a xylanase.
Disclosures
No conflicts of interest declared.
Acknowledgements
This work was funded by the Energy Biosciences Institute's grant OO0G01.
Materials
| Name | Company | Catalog Number | Comments |
| 2,5-dihydroxybenzoic acid | Sigma-Aldrich | 37550 | 10mg/mL in water |
| BioRex MSZ 501(D) Resin | Bio-Rad | 142-7425 | |
| Endoglucanase | Megazyme | E-CELTR | |
| Xylanase M6 | Megazyme | E-XYRU6 | |
| 3mm metal balls | Retsch | 22.455.0011 | |
| Beat mill | Retsch | Mixer Mill MM400 | |
| MALDI-TOF | Shimadzu Corporation | Axima Performance | |
| MALDI target plate | Kratos Analytical | DE4555TA | |
| SpeedVac | Eppendorf | Vacufuge 5301 | |
| Vacuum manifold | EMD Millipore | MSVMHTS00 | |
| Vacuum pump | Welch Allyn | DryFast Ultra 2032 |
References
- Lerouxel, O. Rapid structural phenotyping of plant cell wall mutants by enzymatic oligosaccharide fingerprinting. Plant Physiology. 130 (4), 1754-1754 (2002).
- Obel, N. Microanalysis of plant cell wall polysaccharides. Molecular Plant. 2 (5), 922-922 (2009).
- Mouille, G. Quantitative trait loci analysis of primary cell wall composition in Arabidopsis. Plant Physiology. 141 (3), 1035-1035 (2006).
- Bauer, S. Development and application of a suite of polysaccharide-degrading enzymes for analyzing plant cell walls. PNAS. 103 (30), 11417-11417 (2006).
- Pauly, M. A xyloglucan-specific endo-beta-1,4-glucanase from Aspergillus aculeatus: expression cloning in yeast, purification and characterization of the recombinant enzyme. Glycobiology. 9 (1), 93-93 (1999).
- Aboughe-Angone, S. Cell wall carbohydrates from fruit pulp of Argania spinosa: structural analysis of pectin and xyloglucan polysaccharides. Carbohydr Res. 343 (1), 67-67 (2008).
- Brown, D. M. Comparison of five xylan synthesis mutants reveals new insight into the mechanisms of xylan synthesis. Plant Journal. 52 (6), 1154-1154 (2007).
- Lee, C. The PARVUS gene is expressed in cells undergoing secondary wall thickening and is essential for glucuronoxylan biosynthesis. Plant Cell Physiol. 48 (12), 1659-1659 (2007).
- Obel, N. Pectin may hinder the unfolding of xyloglucan chains during cell deformation: implications of the mechanical performance of Arabidopsis hypocotyls with pectin alterations. Molecular Plant . , (2009).
- Cavalier, D. M., Keegstra, K. Two xyloglucan xylosyltransferases catalyze the addition of multiple xylosyl residues to cellohexaose. Journal of Biological Chemistry. 281 (45), 34197-34197 (2006).
- Leonard, R. Identification of an Arabidopsis gene encoding a GH95 alpha1,2-fucosidase active on xyloglucan oligo- and polysaccharides. Phytochemistry. 69 (10), 1983-1983 (2008).
- Cavalier, D. M., Keegstra, K. Two xyloglucan xylosyltransferases catalyze the addition of multiple xylosyl residues to cellohexaose. Journal of Biological Chemistry. 281 (45), 34197-34197 (2006).
- Lee, C. H. The irregular xylem9 mutant is deficient in xylan xylosyltransferase activity. Plant and Cell Physiology. 48 (11), 1624-1624 (2007).
- Iglesias, N. Apoplastic glycosidases active against xyloglucan oligosaccharides of Arabidopsis thaliana. Plant and Cell Physiology. 47 (1), 55-55 (2006).
- Fujino, T., Sone, Y., Mitsuishi, Y., Itoh, T. Characterization of cross-links between cellulose microfibrils, and their occurrence during elongation growth in pea epicotyl. Plant Cell Physiol. 41 (4), 486-486 (2000).
- Vanzin, G. F. The mur2 mutant of Arabidopsis thaliana lacks fucosylated xyloglucan because of a lesion in fucosyltransferase AtFUT1. PNAS. 99 (5), 3340-3340 (2002).
- Cavalier, D. M. Disrupting two Arabidopsis thaliana xylosyltransferase genes results in plants deficient in xyloglucan, a major primary cell wall component. Plant Cell. 20 (6), 1519-1519 (2008).
- Hilz, H. A comparison of liquid chromatography, capillary electrophoresis, and mass spectrometry methods to determine xyloglucan structures in black currants. Journal of Chromatography A. 1133 (1-2), 275-275 (2006).
- Pauly, M. Effects of the mur1 mutation on xyloglucans produced by suspension-cultured Arabidopsis thaliana cells. Planta. 214 (1), 67-67 (2001).
Reprints and Permissions
Request permission to reuse the text or figures of this JoVE article
Request PermissionExplore More Articles
This article has been published
Video Coming Soon
Copyright © 2025 MyJoVE Corporation. All rights reserved