Method Article
Direct Analysis of Single Cells by Mass Spectrometry at Atmospheric Pressure
In This Article
Summary
Single cell analysis is performed by mass spectrometry on plant and animal cells at atmospheric pressure by using a sharpened optical fiber to sample the cells for laser ablation electrospray ionization (LAESI) mass spectrometry.
Abstract
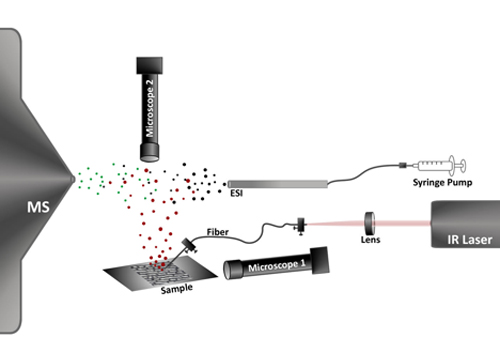
Analysis of biochemicals in single cells is important for understanding cell metabolism, cell cycle, adaptation, disease states, etc. Even the same cell types exhibit heterogeneous biochemical makeup depending on their physiological conditions and interactions with the environment. Conventional methods of mass spectrometry (MS) used for the analysis of biomolecules in single cells rely on extensive sample preparation. Removing the cells from their natural environment and extensive sample processing could lead to changes in the cellular composition. Ambient ionization methods enable the analysis of samples in their native environment and without extensive sample preparation.1 The techniques based on the mid infrared (mid-IR) laser ablation of biological materials at 2.94 μm wavelength utilize the sudden excitation of water that results in phase explosion.2 Ambient ionization techniques based on mid-IR laser radiation, such as laser ablation electrospray ionization (LAESI) and atmospheric pressure infrared matrix-assisted laser desorption ionization (AP IR-MALDI), have successfully demonstrated the ability to directly analyze water-rich tissues and biofluids at atmospheric pressure.3-11 In LAESI the mid-IR laser ablation plume that mostly consists of neutral particulate matter from the sample coalesces with highly charged electrospray droplets to produce ions. Recently, mid-IR ablation of single cells was performed by delivering the mid-IR radiation through an etched fiber. The plume generated from this ablation was postionized by an electrospray enabling the analysis of diverse metabolites in single cells by LAESI-MS.12 This article describes the detailed protocol for single cell analysis using LAESI-MS. The presented video demonstrates the analysis of a single epidermal cell from the skin of an Allium cepa bulb. The schematic of the system is shown in Figure 1. A representative example of single cell ablation and a LAESI mass spectrum from the cell are provided in Figure 2.
Protocol
1. Optical Components
- Laser ablation for laser ablation electrospray ionization (LAESI) mass spectrometry (MS) is produced by a 5 ns laser pulse at 2.94 μm wavelength. A tunable optical parametric oscillator driven by a Nd:YAG laser (Opolette 100, Opotek Inc., Carlsbad, CA) is used for ablation in this study. The repetition rate is selected between 5 and 100 Hz. This is a class IV laser that upon direct exposure may cause severe permanent damage to the eye or skin. The diffuse reflection of the laser beam can also be hazardous to the skin or eye. Wear an appropriate laser goggle for protection.
- The optical fiber made of germanium dioxide-based glass was obtained from Infrared Fiber Systems, Inc. (Silver Spring, MD). If there are Hytrel and polyimide coatings on the fiber follow the directions below to remove them from the ends. Heat 1-methyl-2-pyrrolidinone to 130-150 °C in a fume hood. Dip the fiber ends you want to strip into this liquid for approximately 1 min or until the coating starts to soften and peel off. Dip the softened coating into methanol or isopropanol for a minute, and wipe off any remaining coating with a lint-free napkin. After removing the coating, cleave both ends of the fiber with a sapphire blade (KITCO Fiber Optics, Virginia Beach, VA) by scoring and gently snapping them.
- To achieve the desired sharpness, chemically etch one end of the fiber tip by 1% (v/v) nitric acid (reagent grade) solution. Vertically immerse the selected end of the fiber into the acid solution to a depth of 300 to 500 μm after the initial contact. After approximately 15 minutes of etching, the tip will spontaneously detach from the acid surface. This results in a sharpened fiber tip with ~15 μm radius of curvature. Rinse with deionized water to remove any acid residue.
- Mount the etched end of the fiber on a micromanipulator (MN-151, Narishige, Tokyo, Japan) and bring it to close proximity (~20 μm) of the cell surface for efficient energy deposition.
- Hold the non-etched end of the optical fiber by a bare fiber chuck (BFC300, Siskiyou Corporation, Grants Pass, OR). For optical alignment, the fiber chuck is mounted on a five-axis translator (BFT-5, Siskiyou Corporation, Grants Pass, OR). The laser energy (0.5 to 1 mJ) is coupled into the fiber by focusing the beam by a plano-convex calcium fluoride or antireflection coated ZnSe lens (Infrared Optical Products, Farmingdale, NY) onto its non-etched end. Protected gold mirrors (PF10-03-M01, Thorlabs, Newton, NJ) are used to steer the mid-IR laser beam onto the focusing lens.
2. Electrospray Setup
- The electrospray system can be constructed using the following components: metal union with conductive perfluoroelastomer ferrule, fittings, tubing sleeve, needle port (e.g., U-435, M215,F-331Nx, F-242x, 9013, respectively IDEX Health & Sciences, Oak Harbor, WA) as well as fused silica tubing (e.g., CT360-100-50-5, New Objective Inc., Woburn, MA). The recommended emitter is made of stainless steel and has a tapered tip with a 50 μm i.d. (e.g., MT320-50-5-5, New Objective Inc., Woburn, MA).
- Prepare 50% methanol solution with 0.1 % acetic acid (v/v) for the electrospray. The solution is pumped at a rate of 200 to 300 nl/min by a syringe pump (Harvard Apparatus, Holliston, MA) using, e.g., a 500 μl syringe (81222, Hamilton Company, Reno, NV).
- Apply high voltage between 2,800 and 3,000 V to the metal union by a regulated power supply (PS350, Stanford Research Systems Inc, Sunnyvale, CA) to generate a steady electrospray. Make sure all electric connections are secure and shielded with the shielding properly grounded. Direct contact with exposed high voltage can result in electric shock.
3. Sample Handling
- Obtain the live tissue or cell sample from an appropriate source and keep them as recommended before the analysis. The Allium cepa bulbs for this demonstration were purchased from a local store. Cut a bulb longitudinally by a surgical scalpel. A few centimeter segment of a scale was sectioned into a strip. An intact monolayer of the inner epidermal tissue is peeled off.
- The wet surface of the epidermis is used to mount the tissue on a pre-cleaned glass microscope slide. Hold the slide by a general purpose plate holder (FP01, Thorlabs Inc., Newton, NJ) mounted on a three-axis translation stage for positioning. Acquire the mass spectra immediately after mounting the sample to prevent cell degradation.
4. Visualization System
- Two long distance microscopes are used to select the cells for analysis and to maintain the distance between the sharpened fiber tip and the cell surface. The latter is mounted under 15°-30° angle measured from the surface. This system consist of a long distance video microscope (7x precision zoom optic, Edmund Optics, Barrington, NJ) with a 5x infinity corrected objective lens (M Plan Apo 5x, Mitutoyo Co., Kanagawa, Japan) equipped with a CCD camera (Marlin F131, Allied Vision Technologies, Stadtroda, Germany) for monitoring and image capture.
- The second video microscope is mounted at a right angle to the sample surface to visualize the cells from the top. This system provides visual feedback to align the fiber tip over the cell selected for ablation and analysis. It consists of a 7x precision zoom optic (Edmund Optics, Barrington, NJ), fitted with a 10x infinity corrected long working distance objective lens (M Plan Apo 10x, Mitutoyo Co., Kanagawa, Japan) and a CCD camera.
5. Acquisition of Mass Spectra
- Turn on the laser, the electrospray and the mass spectrometer, e.g., a quadrupole time-of-flight system (Q-TOF Premier, Waters, Milford, MA). Optimize the geometry of the LAESI ion source by adjusting the position of the ablation spot and electrospray emitter relative to each other and the orifice of the mass spectrometer to achieve maximum ion intensities.
- Select the cell of interest for analysis by using the top-view visualization system. After selection, move the sample stage to bring the selected cell directly below the sharpened tip of the optical fiber. Using the side-view microscope readjust the tip-to-cell surface distance to ~20 μm.
- Fire laser pulses at the selected cell through the etched fiber tip. This result in the perforation of the cell wall and the ejection of the cytoplasm in the form of particulate matter. After postionization by the electrospray, the produced ions are collected by the mass spectrometer and mass spectra are recorded.
- After data acquisition, put the laser, the electrospray and the mass spectrometer in standby mode or turn them off. Keep the ablated A. cepa tissue sample for optional observation by light microscopy.
6. Representative Results
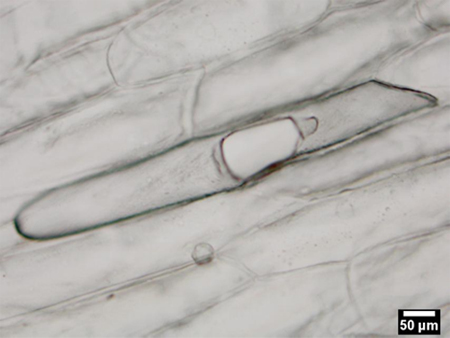
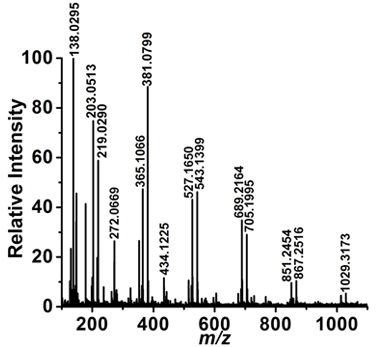
Successful ablation of a single cell results in the bursting of the cell wall and the collection of a LAESI mass spectrum. An unsuccessful experiment usually results in no ablation and/or no mass spectrum. For demonstration purposes, we present the results from the LAESI-MS analysis of a single embedded epidermal cell of an A. cepa bulb. Figure 2a shows a representative optical microscopy image after the sampling of a cell. The cell wall is perforated and the extent of perforation is limited by the boundaries with the neighbouring cells. The adjacent cells seem to be intact. Figure 2b shows a representative LAESI mass spectrum produced from the cell. A wide variety of ions are detected from the A. cepa cell and based on their accurate masses, isotope distribution patterns, and, in some cases, tandem mass spectra, they are tentatively assigned to endogenous metabolites. The ions detected from a single cell were similar to the ones observed in the analysis of the same tissue by conventional LAESI-MS of multiple cells.13

Figure 1. Schematic of single cell analysis by LAESI-MS. A mid-IR laser pulse is coupled into an optical fiber and delivered to the sample placed on glass slide. The sharpened fiber tip focuses the light into the target cell and the deposited energy bursts the cell. The produced ablation plume (red dots) is merged with an electrospray plume (black dots) the droplets coalesce (green dots) resulting in sample specific ion production. These ions are analyzed and detected by the mass spectrometer (MS). Two long distance video microscopes, Microscope 1 and Microscope 2, are utilized to monitor distance between the fiber tip and the cell surface and to select a cell for analysis, respectively.

Figure 2a. Ablation mark on a single epidermal cell of an A. cepa bulb. The adjacent cells do not exhibit visible damage and subsequently can be analyzed separately.

Figure 2b. Mass spectrum corresponding to the ablation of a single A. cepa epidermal cell shows the presence of primary and secondary metabolites.
Discussion
The water content of the cell cytoplasm and the tensile strength of the cell wall or membrane are critical factors governing the ablation of single cells during LAESI-MS analysis. The laser fluence has to be adjusted to reach the ablation thresholds of the different cell types. The delivered laser fluence depends on the energy of the laser pulse and on the distance between the fiber tip and the cell surface. Minimizing the perturbation of neighboring cells during the single cell analysis is critical. Keeping the laser energy at the ablation threshold limits the effect of analysis on the adjacent cells.
One of the potential applications is using single cells as the natural volumetric pixels (voxels) for chemical imaging by MS. Compared to collecting data on an artificial often rectangular grid, chemical imaging of a tissue one cell at a time is more likely to retain the spatial organization of biochemical interactions between cells.
Disclosures
No conflicts of interest declared.
Acknowledgements
The authors acknowledge financial support by the following institutions; the National Science Foundation (Grant 0719232), the Department of Energy (Grant DEFG02-01ER15129), the W. M. Keck Foundation (Grant 041904), and the George Washington University Research Enhancement Fund. The authors are grateful for the GeO2-based optical fibers generously supplied by Infrared Fiber Systems (Silver Spring, MD) as well as for the initial discussion on the protocol regarding fiber etching by Mark E. Reeves and Joan A. Hoffmann of the George Washington University. The authors would also like to thank Jessica A. Stolee for her help during the videotaping of the protocol.
Materials
| Name | Company | Catalog Number | Comments |
| Acetic acid | Fluka | 45727 | |
| Methanol | Fluka | 65548 | |
| 1-methyl-2-pyrrolidinon | Sigma-Aldrich | M79603 | |
| Water | Fluka | 39259 |
References
- Cooks, R. G., Ouyang, Z., Takats, Z., Wiseman, J. M. Ambient Mass Spectrometry. Science. 311, 1566-1570 (2006).
- Chen, Z. Y., Vertes, A. Early plume expansion in atmospheric pressure midinfrared laser ablation of water-rich targets. Physical Review E. E77, 036316-036316 (2008).
- Li, Y., Shrestha, B., Vertes, A. Atmospheric Pressure Molecular Imaging by Infrared MALDI. Mass Spectrometry. Analytical Chemistry. 79, 523-532 (2006).
- Li, Y., Shrestha, B., Vertes, A. Atmospheric Pressure Infrared MALDI Imaging Mass Spectrometry for Plant Metabolomics. Analytical Chemistry. 80, 407-420 (2007).
- Nemes, P., Vertes, A. Laser Ablation Electrospray Ionization for Atmospheric Pressure in Vivo, and Imaging Mass Spectrometry. Analytical Chemistry. 79, 8098-8106 (2007).
- Shrestha, B., Li, Y., Vertes, A. Rapid analysis of pharmaceuticals and excreted xenobiotic and endogenous metabolites with atmospheric pressure infrared MALDI mass spectrometry. Metabolomics. 4, 297-311 (2008).
- Nemes, P., Barton, A. A., Li, Y., Vertes, A. Ambient Molecular Imaging and Depth Profiling of Live Tissue by Infrared Laser Ablation Electrospray Ionization Mass Spectrometry. Analytical Chemistry. 80, 4575-4582 (2008).
- Nemes, P., Barton, A. A., Vertes, A. Three-Dimensional Imaging of Metabolites in Tissues under Ambient Conditions by Laser Ablation Electrospray Ionization Mass Spectrometry. Analytical Chemistry. 81, 6668-6675 (2009).
- Nemes, P., Woods, A. S., Vertes, A. Simultaneous Imaging of Small Metabolites and Lipids in Rat Brain Tissues at Atmospheric Pressure by Laser Ablation Electrospray Ionization Mass Spectrometry. Analytical Chemistry. 82, 982-988 (2010).
- Shrestha, B. Direct analysis of lipids and small metabolites in mouse brain tissue by AP IR-MALDI and reactive LAESI mass spectrometry. Analyst. , (2010).
- Sripadi, P., Nazarian, J., Hathout, Y., Hoffman, E., Vertes, A. In vitro analysis of metabolites from the untreated tissue of Torpedo californica electric organ by mid-infrared laser ablation electrospray ionization mass spectrometry. Metabolomics. 5, 263-276 (2009).
- Shrestha, B., Vertes, A. In Situ Metabolic Profiling of Single Cells by Laser Ablation Electrospray Ionization Mass Spectrometry. Analytical Chemistry. 81, 8265-8271 (2009).
- Shrestha, B., Nemes, P., Vertes, A. Ablation and Analysis of a Single Cell by Consecutive Laser Pulses. Applied Physics A. , (2010).
Reprints and Permissions
Request permission to reuse the text or figures of this JoVE article
Request PermissionThis article has been published
Video Coming Soon
Copyright © 2025 MyJoVE Corporation. All rights reserved