A subscription to JoVE is required to view this content. Sign in or start your free trial.
Method Article
Isolation of Basal Cells and Submucosal Gland Duct Cells from Mouse Trachea
In This Article
Summary
Here we demonstrate our protocol for isolation of basal and submucosal gland duct cells from mouse tracheas. We also demonstrate the method of injecting stem cells into the dorsal mouse fat pad to create an in vivo model of submucosal gland regeneration.
Abstract
The large airways are directly in contact with the environment and therefore susceptible to injury from toxins and infectious agents that we breath in 1. The large airways therefore require an efficient repair mechanism to protect our bodies. This repair process occurs from stem cells in the airways and isolating these stem cells from the airways is important for understanding the mechanisms of repair and regeneration. It is also important for understanding abnormal repair that can lead to airway diseases 2. The goal of this method is to isolate a novel stem cell population from the mouse tracheal submucosal gland ducts and to place these cells in in vitro and in vivo model systems to identify the mechanisms of repair and regeneration of the submucosal glands 3. This production shows methods that can be used to isolate and assay the duct and basal stem cells from the large airways 3.This will allow us to study diseases of the airway, such as cystic fibrosis, asthma and chronic obstructive pulmonary disease. Currently, there are no methods for isolation of submucosal gland duct cells and there are no in vivo models to study the regeneration of submucosal glands.
Protocol
Outline of Steps
1. Dissection of trachea
2. Cleaning trachea and cutting it
3. Enzyme digestion and processing into single cell suspension
4. Staining for FACS and sorting
5. Processing sorted cells for in vivo and in vitro models
1. Dissection of Trachea
- Euthanize the mouse with an intraperitoneal injection of 0.1 mg/0.2 cc of pentobarbital.
- Cut open the abdominal wall, and move the intestines to the side to expose the abdominal aorta and then dissect it.
- Open the chest by cutting through the diaphragm and anterior chest wall on both sides to expose the heart and lungs. Continue cutting up into the neck removing the fat and salivary glands to expose the trachea.
- Remove the thymus and cut the lung off its connections below and behind. Separate the trachea from the esophagus by inserting a forceps between them then cut the trachea at its upper most part above its connection with the larynx. Then hold the trachea with forceps and dissect it from its attachment and continue downward to remove it with the heart and lung en-block. Cut away the heart and lungs near to the hilum to include most of the right and left main bronchi.
- Place the trachea in a small Petri dish containing collecting medium on ice.
2. Cleaning Trachea and Cutting It
- Under the dissecting microscope, use very fine point forceps (No. 5) and Vannas Tubingen scissors (FST 15003-08 finescience.com) to clean the trachea from all the other tissues attached to it. This includes: lymph nodes, recurrent laryngeal nerve, fat, thyroid gland and remaining pulmonary vessels. The upper part of the trachea needs special attention, to remove the big laryngeal cartilages without compromising the biggest bunch of SMG that is lodged between the cricoid cartilage and the first tracheal cartilaginous ring (C1)4.
- Cut the trachea into the upper part and the lower part between C4 & C5 and then cut open both parts through the lumen of the trachea.
3. Enzyme Digestion and Processing into Single Cell Suspension (SCS)
- Incubate the lower part of the trachea in 1 ml of 16 U dispase in an Eppendorf tube at room temperature (RT) for 30 min, as previously described 5. Then add 0.5 mg/ml DNase I in DMEM for an additional 20 min at RT.
- Remove the digested tracheas into fresh collecting medium in a sterile Petri dish, and strip the surface epithelium under the dissecting microscope. Use a pipette to transfer the medium containing the stripped epithelium to a 50 ml conical tube.
- Spin down the stripped epithelium at 1,000 x g at 4 °C. Remove the supernatant, and add 0.1% Trypsin/EDTA and incubate while shaking the tube in a 37 °C shaking incubator (200 rpm) for 30 min. After the incubation, using a 1,000 μl tip, pipette up and down to break up clumps and form a single cell suspension.
- Place the upper trachea in a conical tube containing 1 ml of 0.15% pronase. Then incubate at 4 °C for 4 hr.
- Gently vortex the tube and then place the trachea into fresh collecting medium and confirm under the dissecting microscope that there is complete detachment of the surface epithelium (SE).
- Mince the trachea with a fine scissors to open up the SMG compartments and then incubate for one more hour in pronase at RT with slow shaking.
- Spin down the tracheal tissue, remove the pronase, add 0.1% Trypsin/EDTA and incubate at 37 °C for 30 min with shaking as above.
- Passage the digested cells, clumps and any remaining chunks of glands through 20G, 23G and 26G needles using a 10 ml syringe. Repeat the passaging several times with each needle size before stepping down. Now, most cells should be in a SCS.
- Filter the suspension through a 40 μM strainer then wash the strainer and spin down the cells. Then reconstitute the cells in the appropriate volume of medium, count the cells and proceed immediately to FACS staining and sorting. Do not leave cells in 4 °C or on ice for several hours because we found that this affects the viability and severely reduces the sphere forming efficiency.
4. Staining for FACS and Sorting
- Take enough cells for preparing the unstained and single stained compensation tubes then stain the rest of the cells with primary antibodies, goat Trop2 and rat ITGA6, for 15 min at RT. Then wash with PBS or collecting medium, remover the supernatant very carefully and break the cell pellet.
- Stain with the appropriate secondary antibody, incubate in the dark at RT for 10 min, wash and remove supernatant and then break the pellet.
- On the FACS ARIA, after adjusting your voltage and compensation, gate out the debris, very small cells, cell doublets and dead cells. Then, most cells from the SE should be TROP2 positive while 20-50% of SMG cells will be TROP2+ 6.
- Set your sorting gate for Trop2+ITGA6+ cells from SE (basal cells) and for Trop2+ cells (+/-ITGA6 positive cells) from SMG (duct cells).
5. Processing Sorted Cells for: in vitro Culture and the in vivo Model
5.1 In vitro sphere forming 5-9 culture
- Mix 100 μl of "Growth Factor reduced Matrigel" with 100 μl of complete medium 10,11 (see Table 1) containing up to 50,000 sorted cells then put this mixture in the upper chamber of a 24-well trans-well. Then put 400 μl of complete medium in lower chamber and incubate at 37 °C. Change medium in lower chamber every other day and add extra 100 μl of Matrigel every week or earlier if it becomes thin.
5.2 In vivo model
- Reconstitute the sorted cell pellet in complete medium mixed 1:1 with matrigel at a concentration of 5,000-10,000 cells per 50 μl.
- Anesthetize the recipient C57/BL6 mice. Administer Carprofen (5 mg/kg) subcutaenously as an analgesic. Sterilize and shave their backs then make a central longitudinal skin incision in the upper back. The incision should be large enough to identify the fat pad injection site as well as the bleb that forms after injection. Use the blunt side of the scissor to widen pouches between the skin and back of the chest wall on both sides to maximize access and visualization.
- Identify the medial border of the scapula by pushing the mouse forelimb up and backward to see the scapula moving. Take 50 μl of the cell suspension into a 300 μl BD insulin syringe and inject it in the fat pad just medial to the scapula and lateral to the vertebrae. You should be able to see a bleb otherwise you are too deep. Repeat the same on the other side then clip or stitch the skin incision. Check mice and give Carprofen (5 mg/kg, SC) once daily for 48 hr.
- After 3 weeks, euthanize mice with pentobarbatol (0.1 mg/0.2 cc, IP), open the skin as above and dissect the whole fat pad from both sides with a safety margin to avoid missing any tissue structure that might have formed and extended around. Fix in PFA and embed in paraffin 12. Extreme care should be employed during trimming and cutting the block not to bypass or overlook a structure. The best practice is to trim 40 μm once then cut a 4 μm slice, place it on a glass slide and examine it under the microscope to confirm if there are any "epithelial structures" in this part of the block or not. If there is nothing seen, then trim once more and repeat this step.
6. Representative Results
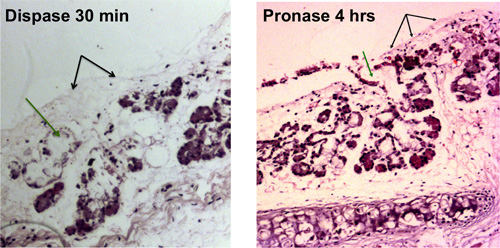
Stripping of the mouse tracheas will result in a denuded trachea that is visible by light microscopy as shown in Figure 1A. Figure 1B shows the brightfield view of a trachea after epithelial stripping with submucosal glands being released from the tissues and resembling bunches of grapes.
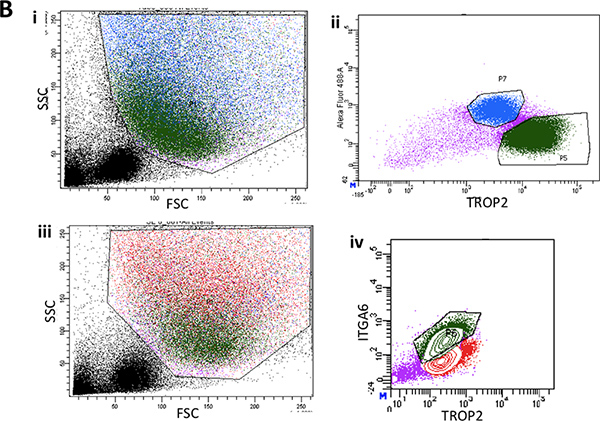
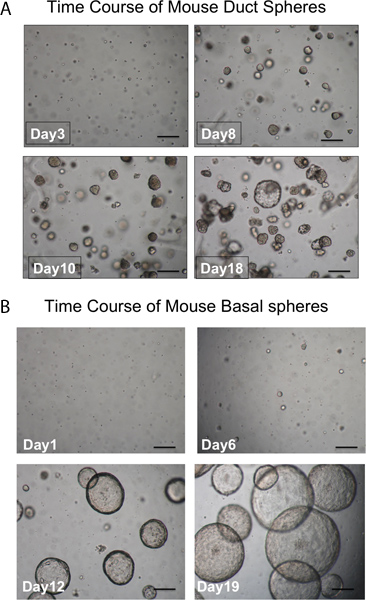
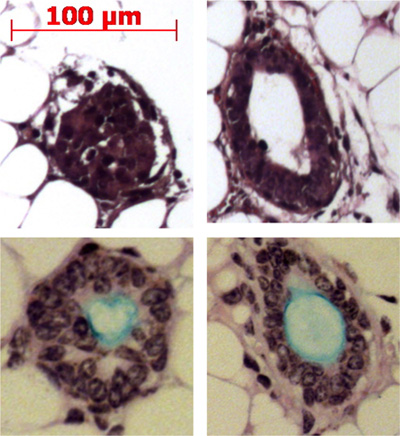
Pronase removes the ITGA6 epitope and this is why the TROP2 duct cells cannot be separated into ITGA6+ and - populations. However, dispase, which preserves the ITGA6 epitope, digests all the surface epithelium and the duct cells even with very short incubation times, and therefore cannot be used to separate duct from basal cells3. Flow cytometry of the single cell suspensions should show forward scatter and side scatter plots that are represented in Figure 2A. Good separation of duct cells from the rest if the tracheal cells should be seen with the Trop2 antibody in flow cytometry for fluorescent activated cell sorting (FACS) as seen in Figure 2B. Spheres should be visible in the matrigel after about 1 week in culture and are dense in appearance as shown in Figure 3. The efficiency of this process is the order of 1-2% and single cells will still be present in the matrigel and likely represent cells from the submucosal gland ducts that do not possess the capacity for self-renewal. Injection of duct stem cells into the mouse fat pad results in the formation of submucosal gland-like structures that are shown Figure 4. These are seen in the blocks even without H&E staining. These are spherical and possess a central lumen. Many cross sections need to be made through the fat pad in order not to miss these epithelial structures.

Figure 1. Enzymatic digestion of tracheal epithelium. Removal of surface epithelial cells is shown with black arrows, removal of cells in the submucosal gland ducts is shown with green arrows. Denuded tracheas that are visible by light microscopy are shown after 30 min of dispase digestion and after 4 hr of pronase digestion.

Figure 2A. i. Flow cytometry of the single cell suspensions showing representative forward scatter and side scatter plots from mouse tracheas after surface epithelial stripping. ii. Representative FACS plots for TROP2 expression in duct cells from mouse tracheas.

Figure 2B. i. Flow cytometry of the single cell suspensions from stripped surface epithelium of the lower two thirds of the mouse trachea showing representative forward scatter and side scatter plots. ii. Typical FACS plot of ITGA6 expression in surface epithelium. iii. Another representative FACS plot of forward and side scatter from surface epithelium showing back gating of the basal cell population in green. iv. Typical ITGA6 and TROP2 expressing cell population in green.

Figure 3. Time course of development of spheres. A. Duct spheres. Spheres should be visible in the matrigel after about 1 week in culture and almost all are dense in appearance. Single cells that don't form spheres are also seen. (scale bar = 50 μm). B. Basal spheres are larger and luminal in appearance. Single cells that don't form spheres are also seen. (scale bar = 50 μm).

Figure 4. Injection of duct stem cells into the mouse fat pad results in the formation of submucosal gland-like structures. Representative structures are shown in the fat pad and some are shown producing mucin (light blue) with the Alcian blue Periodic Acid Schiff stain.
Discussion
This technique to isolate duct and basal cells from the airways is important for improving our understanding of airway repair and regeneration and airway diseases. The techniques described here include a few critical steps. The first is the optimized enzymatic digestion period. The second is the creation of a single cell suspension through serial passaging with progressively higher gage needles to prevent cell shearing but to break up cell clumps. The third is the FACS analysis, and gating of cells with appropriate antib...
Disclosures
No conflicts of interest declared.
Acknowledgements
We would like to acknowledge the Broad Stem Cell Research Center FACS and especially thank Jessica Scholes and Felicia Codrea for their help with cell sorting. The work was funded by CIRM RN2-00904-1, K08 HL074229, American Thoracic Society/COPD Foundation ATS-06-065, The Concern Foundation, The UCLA Jonsson Comprehensive Cancer Center Thoracic Oncology Program/Lung Cancer SPORE, the University of California Cancer Research Coordinating Committee and the Gwynne Hazen Cherry Memorial Laboratories (BG).
Materials
| Name | Company | Catalog Number | Comments |
| Complete medium 10: DMEM-F-12 , 50/50, 1X) | Mediatech | 15-090-CV | |
| Hepes (15 mM) | Invitrogen | 15630 | |
| Sodium bicarbonate (3.6mM or 0.03%) | Invitrogen | 25080 | |
| L-glutamine (4 mM) | Mediatech | 25-005-Cl | |
| Penicillin (100 U/ml) | Mediatech | 30-001-CI | |
| Streptomycin (100 μg/m) | Mediatech | 30-001-CI | |
| Insulin (10 μg/ml) | Sigma | I6634 | |
| Transferrin (5 μg/ml) | Sigma | T1147 | |
| Cholera toxin (0.1 μg/ml) | Sigma | C8052 | |
| Epidermal Growth Factor (25 ng/ml) | BD | 354001 | |
| Bovine Pituitary Extract (30 μg/ml) | Invitrogen | 13028-014 | |
| Fetal Bovine Serum (5%) | Fisher | SH3008803HI | |
| Retinoic acid (0.05 μM) | Sigma | R2625 | |
| Growth Factor Reduced Matrigel | BD | 354230 | |
Table 1. Complete media components. | |||
| Pronase | Roche | 10165921001 | Used at 0.15%: -o/n at 4 °C digestion to isolate total tracheal cells (for ALI culture) -4 hr digestion 4 °C to isolate SMG |
| Dispase | BD Biosciences | 354235 | Used at 16 Units: 30 min at RT |
| DNase I | Sigma | DN25 | Used at 0.5 mg/ml: 20-30 min at RT |
Table 2. Enzymes used for enzymatic digestion of the trachea. | |||
References
- Bartlett, J. A., Fischer, A. J., McCray, P. B. Innate immune functions of the airway epithelium. Contrib. Microbiol. 15, 147-163 (2008).
- Finkbeiner, W. E. Physiology and pathology of tracheobronchial glands. Respir. Physiol. 118, 77-83 (1999).
- Hegab, A. E. A Novel Stem/Progenitor Cell Population from Murine Tracheal Submucosal Gland Ducts with Multipotent Regenerative Potential. Stem Cells. , (2011).
- Jeffery, P. K. Morphologic features of airway surface epithelial cells and glands. Am. Rev. Respir. Dis. 128, S14-S20 (1983).
- Rock, J. R. Basal cells as stem cells of the mouse trachea and human airway epithelium. Proc. Natl. Acad. Sci. U.S.A. 106, 12771-12775 (2009).
- Goldstein, A. S. Trop2 identifies a subpopulation of murine and human prostate basal cells with stem cell characteristics. Proc. Natl. Acad. Sci. U.S.A. 105, 20882-20887 (2008).
- Reynolds, B. A., Weiss, S. Generation of neurons and astrocytes from isolated cells of the adult mammalian central nervous system. Science. 255, 1707-1710 (1992).
- McQualter, J. L., Yuen, K., Williams, B., Bertoncello, I. Evidence of an epithelial stem/progenitor cell hierarchy in the adult mouse lung. Proc. Natl. Acad. Sci. U.S.A. 107, 1414-1419 (2010).
- Inayama, Y. In vitro and in vivo growth and differentiation of clones of tracheal basal cells. Am. J. Pathol. 134, 539-549 (1989).
- You, Y., Richer, E. J., Huang, T., Brody, S. L. Growth and differentiation of mouse tracheal epithelial cells: selection of a proliferative population. Am. J. Physiol. Lung. Cell. Mol. Physiol. 283, L1315-L1321 (2002).
- Wu, X., Peters-Hall, J. R., Bose, S., Pena, M. T., Rose, M. C. Human Bronchial Epithelial Cells Differentiate to 3D Glandular Acini on Basement Membrane Matrix. Am. J. Respir. Cell Mol. Biol. , (2010).
- Ooi, A. T. Presence of a putative tumor-initiating progenitor cell population predicts poor prognosis in smokers with non-small cell lung cancer. Cancer Res. 70, 6639-6648 (2010).
Reprints and Permissions
Request permission to reuse the text or figures of this JoVE article
Request PermissionThis article has been published
Video Coming Soon
Copyright © 2025 MyJoVE Corporation. All rights reserved