A subscription to JoVE is required to view this content. Sign in or start your free trial.
Method Article
Functional Neuroimaging Using Ultrasonic Blood-brain Barrier Disruption and Manganese-enhanced MRI
In This Article
Summary
A technique is described for broadly opening the blood-brain barrier in the mouse using microbubbles and ultrasound. Using this technique, manganese can be administered to the mouse brain. Because manganese is an MRI contrast agent that accumulates in depolarized neurons, this approach enables imaging of neuronal activity.
Abstract
Although mice are the dominant model system for studying the genetic and molecular underpinnings of neuroscience, functional neuroimaging in mice remains technically challenging. One approach, Activation-Induced Manganese-enhanced MRI (AIM MRI), has been used successfully to map neuronal activity in rodents 1-5. In AIM MRI, Mn2+ acts a calcium analog and accumulates in depolarized neurons 6,7. Because Mn2+ shortens the T1 tissue property, regions of elevated neuronal activity will enhance in MRI. Furthermore, Mn2+ clears slowly from the activated regions; therefore, stimulation can be performed outside the magnet prior to imaging, enabling greater experimental flexibility. However, because Mn2+ does not readily cross the blood-brain barrier (BBB), the need to open the BBB has limited the use of AIM MRI, especially in mice.
One tool for opening the BBB is ultrasound. Though potentially damaging, if ultrasound is administered in combination with gas-filled microbubbles (i.e., ultrasound contrast agents), the acoustic pressure required for BBB opening is considerably lower. This combination of ultrasound and microbubbles can be used to reliably open the BBB without causing tissue damage 8-11.
Here, a method is presented for performing AIM MRI by using microbubbles and ultrasound to open the BBB. After an intravenous injection of perflutren microbubbles, an unfocused pulsed ultrasound beam is applied to the shaved mouse head for 3 minutes. For simplicity, we refer to this technique of BBB Opening with Microbubbles and UltraSound as BOMUS 12. Using BOMUS to open the BBB throughout both cerebral hemispheres, manganese is administered to the whole mouse brain. After experimental stimulation of the lightly sedated mice, AIM MRI is used to map the neuronal response.
To demonstrate this approach, herein BOMUS and AIM MRI are used to map unilateral mechanical stimulation of the vibrissae in lightly sedated mice 13. Because BOMUS can open the BBB throughout both hemispheres, the unstimulated side of the brain is used to control for nonspecific background stimulation. The resultant 3D activation map agrees well with published representations of the vibrissae regions of the barrel field cortex 14. The ultrasonic opening of the BBB is fast, noninvasive, and reversible; and thus this approach is suitable for high-throughput and/or longitudinal studies in awake mice.
Protocol
1. Assemble and Calibrate Ultrasound System
- The ultrasound system begins with a single-element ultrasound transducer with a diameter wide enough to cover the mouse brain and a center frequency in the range of 2 MHz. The transducer is driven by a 50-dB-power amplifier, which is connected to a signal generator that produces the ultrasound pulse sequence.
- To calibrate the acoustic pressure of the ultrasound system, use a hydrophone to relate the applied voltage to the resultant acoustic pressure. Place the transducer in a water tank over the hydrophone. Apply a simple pulse (e.g., a 10-cycle sinusoid at the transducer's frequency with pulse repetition frequency of 10 Hz) to the transducer. Use a 3-axis translation stage to find the peak response, which should be at the center of the ultrasound beam at the transducer's natural focus (approximately 60 mm for our 13 mm diameter 2.15 MHz transducer).
- Make several measurements over a range of input voltages (e.g., 50-400 mVpp) to verify the linearity of the system. Use a simple linear regression to estimate the relationship between input voltage and acoustic pressure. In our system, input voltages of 258 and 167 mVpp corresponded to peak-negative acoustic pressures of 0.52 and 0.36 MPa.
- Program the signal generator to produce an ultrasound pulse sequence consisting of bursts of sinusoidal pulses at the transducer frequency with 50000 cycles per burst and a burst period of 64 ms. Based on the calibration measurements, set the pulse amplitude to generate peak-negative acoustic pressures of 0.36 MPa at the center of the transducer's natural focus.
2. Prepare the Reagents
- Dissolve Manganese Chloride tetrahydrate (MnCl2·4H2O) in sterile water at a concentration of 100 mM (300 mOsM) and filter sterilize.
- Produce the perflutren lipid microspheres by "activating" the vial in the manufacturer-supplied agitator for 45 s. For a day of experiments, a single vial can be activated once at the start of the day and used without reactivation for the rest of the day.
- Immediately prior to microsphere administration, agitate the vial by hand for 1 min to resuspend the microspheres. When withdrawing microbubbles from the vial, do not inject room air into the vial, as this degrades the remaining microbubbles. Leave the vial out until the last use of the day, and then store it in a refrigerator. Maintained in this fashion, a single vial can last several days. Re-activate the stored vial in the agitator, prior to the first use on subsequent days.
3. Animal Preparation
- Anesthetize the animals with isoflurane, delivered by nose cone. The nose cone apparatus should be designed to fix the animal's head precisely and reliably in the same position each time. Our device 15 maintains the head in the "skull-flat" position (i.e., the dorsal skull surface is horizontal) used in the Paxinos brain atlas 16. Titrate the anesthetic to maintain a respiratory rate between 85 and 125 breaths-per-minute. Maintain body temperature using a heat lamp or blown air. Protect the eyes with lubricant.
- Remove the hair from the mouse scalp using an electric trimmer.
- Place a tail vein catheter and an intraperitoneal (IP) catheter. For survival studies, be sure to use appropriate sterile technique; IP catheter placement demonstrated in the video for this article is appropriate only for non-survival experiments.
- Make any additional preparations required for the neuronal stimulation experiment. For mapping of vibrissae stimulation of the barrel field cortex, use a dissecting microscope and microsurgical scissors to cut the vibrissae as close as possible to the skin surface without irritating the follicle or surrounding skin.
- Place ultrasound gel on the scalp, and then lower a water column contained by a thin plastic sheet (e.g., a 7.6 μm trash bin liner) onto the head. Reach through with water column with a cotton-tipped swab to push out any air bubbles that get trapped in the ultrasound gel. Position the ultrasound transducer at its natural focal distance (58 mm) directly over the mouse brain in the column of water, and wipe the transducer with a finger tip to remove any trapped air bubbles.
4. Blood-brain Barrier Opening with Microbubbles and Ultra Sound (BOMUS)
- Give an intraperitoneal injection of the manganese solution at a dose of 0.5 mmol/kg IP. Cap the intraperitoneal catheter so the manganese does not flow out, and wait 10 minutes to allow it to distribute (Figure 1).
- To open the BBB, administer 30 μL of perflutren lipid microspheres (activated DEFINITY) through the tail vein catheter, and simultaneously, initiate the ultrasound pulse sequence. Continue insonification for 3 minutes.
5. Neuronal Stimulation
- Allow approximately 40 minutes for brain levels of Mn2+ to stabilize before beginning neuronal stimulation. In this way, the dramatic baseline enhancement due to Mn2+ diffusion across the BBB can be distinguished from the subtle differential enhancement due to the stimulation. Then, begin stimulation with your paradigm of choice (Figure 1).
- For vibrissae stimulation, turn off the isoflurane and remove the nose cone. Move a soft artist's paintbrush manually in a circular motion (1-5 Hz) through the vibrissae array at a distance of approximately 2-5 mm from the skin. Continue the stimulation for 90 min. The manganese has a sedative effect which allows unrestrained stimulation of the animal. If the animal becomes restless, administer 5% isoflurane via nose cone for approximately 15 seconds.
6. Magnetic Resonance Imaging
- After stimulation, resume anesthesia via nose cone. Continue maintaining the body temperature and titrating the isoflurane level to a respiratory rate of 85 to 125 breaths-per-minute.
- Place the mouse in an MR imaging coil and transfer to the MRI system. Acquire high-resolution 3D T1-weighted MR images. For example, use a 3D spoiled gradient recalled echo (SPGR) sequence with the following parameters: repetition time of 25 ms; echo time of 2 ms; flip angle of 30 degrees; bandwidth of 15.63 kHz; field of view of 20 × 20 × 12 mm; matrix of 128 × 128 × 60.
7. Image Analysis
- Image analysis is specific to the stimulation paradigm used. For the vibrissae stimulation experiment (Figure 2), import the images from several animals into a suitable analysis environment. If some animals were stimulated on the right while others were stimulated on the left, flip some so that all images are effectively "left-stimulated." Then, to compare the stimulated side of each brain to its contralateral unstimulated side, create a duplicated and mirrored left-unstimulated image set is created. Register all images to a common space and then smooth them with a 3 × 3 × 3 pixel Gaussian kernel.
- Export the data to a mathematical analysis environment, such as MATLAB. Optionally, mask irrelevant anatomy in the datasets. Intensity-normalize the images by the iterative method of Venot et al. 17,18.
- Use a paired, single-tailed t test to compare each voxel of the stimulated sides of each brain to the corresponding contralateral voxel on the unstimulated sides of each brain.
- Display the resultant p-value map to identify regions of differential activity (Figure 3).
8. Representative Results
The method presented here has two fundamental steps: (1) BBB Opening with Microbubbles and UltraSound (BOMUS) and (2) Activation-Induced Manganese-enhanced MRI (AIM MRI). Because the latter step depends on the former, it is important to verify successful implementation BOMUS.
Disruption of the blood-brain barrier after administration of a T1-shortening contrast agent (such as manganese or a gadolinium-based agent) results in a signal increase in the brain parenchyma on T1-weighted imaging when compared to brains in which BOMUS was not performed (Figure 4). The distribution of this manganese enhancement is not completely uniform, although it is fairly consistent between animals. The distribution reflects not only inhomogeneity in BBB opening, but also is the intrinsic non-uniform distribution of Mn within the brain 19. The spatial and temporal dynamics of the BBB opening have been further described previously 12.
Once BOMUS has been successfully implemented, the next step is to perform AIM MRI. Many experimental paradigms are possible; however, because there are many potential confounds, the controls and analysis must be carefully designed. Confounding effects include inhomogeneous BBB opening, inhomogeneous accumulation of Mn in the brain, temporal dynamics of Mn diffusion, and nonspecific neuronal activity. In this demonstration, the neuronal response to unilateral stimulation of the vibrissae was mapped. To account for the inhomogeneities and Mn flux, the unstimulated side of each brain was used as an internal control. To account for nonspecific neuronal activity that might vary between animals, the analysis used statistical testing to identify regions that were consistently different among the animals (Figure 2). The results were a three-dimensional difference map and a three-dimensional p-value map (Figure 3), the right side of which indicated regions of higher signal contralateral to the stimulated vibrissae. The left side of the map indicated which regions had significantly higher signal ipsilateral to the stimulated vibrissae. The p-value map identified a broad region of elevated signal contralateral to the stimulated vibrissae which corresponded to the barrel field of the primary sensory cortex, whose response to vibrissae stimulation has been extensively documented by electrophysiology 20,21 and 2-deoxyglucose studies. A more complete discussion of these results has been published previously 13.

Figure 1. Protocol timeline for functional neuroimaging with BOMUS and AIM MRI (Adapted from Howles et al. 13).
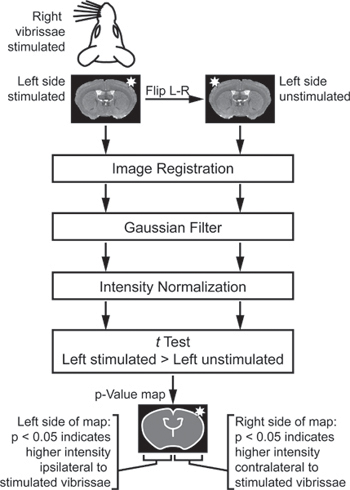
Figure 2. Analysis scheme for identifying regions of different intensity between the stimulated and unstimulated sides of each brain. To compare the stimulated side of each brain to its contralateral unstimulated side, a duplicated and mirrored left-unstimulated image set is created. These images are registered, filtered, and normalized. Finally, a t test compares the left-stimulated and left-unstimulated images. The t test is "paired" so that the stimulated side of each brain is only compared to the unstimulated side of the same brain. The t test is "single-tailed" so that one side of the p-value map indicates significantly higher signal on the stimulated side of the brain, while the other side of the p-value map indicates significantly higher signal on unstimulated side of the brain (Adapted from Howles et al. 13).
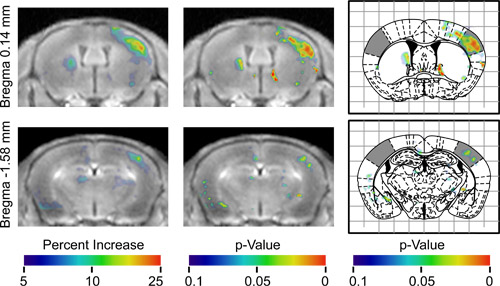
Figure 3. Results of pooled analysis of 7 animals at two different axial positions. The first column shows the mean of all registered images aligned, so that effectively all mice had their left vibrissae stimulated. These images are overlaid with a color map indicating the average percent increase in signal at each voxel relative to the contralateral hemisphere, as indicated by the color bar. Colored regions on the right side of the image show where the hemisphere contralateral to the stimulation had higher signal. Colored regions on the left side of the image show where the hemisphere ipsilateral to the stimulation had higher signal. The second column shows the same images overlaid with the p-value map indicating the statistical significance of the increase in signal. The third column shows the same p-value map overlaid on the corresponding figures from the Paxinos stereotaxic atlas16 with the barrel fields of the sensory cortex shaded (Adapted from Howles et al. 13).
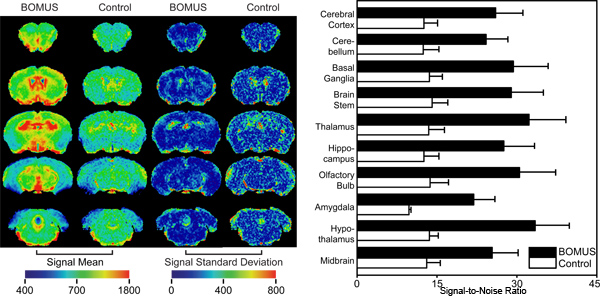
Figure 4. Spatial distribution of Mn2+ in the brain. Images were acquired 170 min after 0.5 mmol/kg IP MnCl2 from BOMUS-treated (n=5) and control (n=4) mice. After normalization, mean and standard deviation maps were calculated (left panel). Enhancement was greater in the BOMUS-treated mice. Though this enhancement was not uniform across the brain, it was fairly consistent, except near the edges of the brain and ventricles. Using regions of interest (ROIs) drawn around various structures, the mean SNR (+ 1 SD) was calculated across each group (right panel). BOMUS-treated animals showed greater SNR but also greater variance between structures and between animals (Adapted from Howles et al. 13).
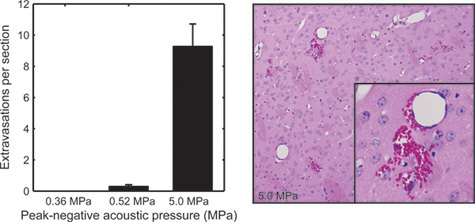
Figure 5. To examine tissue effects of BOMUS, brains from BOMUS-treated mice were fixed, sectioned at 500- μm intervals, and stained with hematoxylin and eosin. The mean number of red blood cell extravasations seen in each section of the brain is shown for acoustic pressures of 0.36 MPa (n = 3), 0.52 MPa (n = 4), and 5.0 MPa (n = 1). Error bars show standard error. The second panel shows an example of severe red blood cell extravasation from the brain exposed to 5.0 MPa (Adapted from Howles et al. 12).
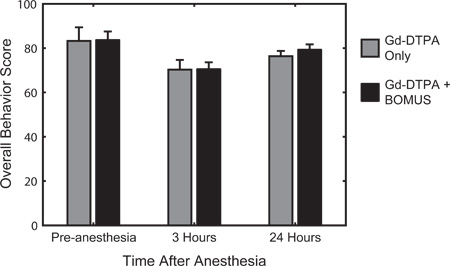
Figure 6. Quantitative behavioral testing was used to assess activity, arousal, and responsiveness before anesthesia, and 3 and 24 hours after recovery from anesthesia. The scoring system, described previously 12, was based on the well-established quantitative mouse behavioral assessment developed by Irwin in 196822. The average behavior (± SEM) score for control (n = 3) and BOMUS (0.36 MPa) treated (n = 8) animals is shown. Relative to the pre-anesthesia baseline, all animals show a decrease in behavior score 3 hours after anesthesia, but they largely recover by the next day. At each time point, no difference was seen between the two groups, indicating that BOMUS did not measurably affect animal behavior (Adapted from Howles et al. 12).
Access restricted. Please log in or start a trial to view this content.
Discussion
Here, a method was presented for noninvasively opening the BBB throughout the whole mouse brain with ultrasound and microbubbles (BOMUS). With the BBB open, Mn2+ was administered and activation-induced manganese-enhanced MRI (AIM MRI) was used to image neuronal response to short-duration stimulation in lightly sedated mice.
Adequate BBB opening was achieved with a peak-negative acoustic pressure of 0.36 MPa. Note, this is the pressure at scalp surface at the center of the ultrasound...
Access restricted. Please log in or start a trial to view this content.
Disclosures
No conflicts of interest declared.
Acknowledgements
All work was performed at the Duke Center for In Vivo Microscopy, an NIH/NIBIB national Biomedical Technology Resource Center (P41 EB015897) and NCI Small Animal Imaging Resource Program (U24 CA092656). Additional support was provided from NSF Graduate Research Fellowship (2003014921).
Access restricted. Please log in or start a trial to view this content.
Materials
| Name | Company | Catalog Number | Comments |
| Hydrophone | Sonora Medical Systems, Longmont, CA | SN S4-251 | |
| Translation stage | Newport Corporation, Irvine, CA | ||
| Ultrasound transducer | Olympus NDT, Inc., Waltham MA | A306S-SU | Review the manufacturer's test sheet that accompanies the transducer to find the exact center frequency of that particular transducer, which may differ from the nominal frequency listed in the catalog. (e.g., the nominal frequency of our transducer was 2.25 MHz, but the actual center frequency was 2.15 MHz.) |
| Vevo Imaging Station | VisualSonics, Inc. Toronto, Canada | ||
| 50 dB power amplifier | E&I, Rochester, NY | model 240L | |
| Signal generator | Agilent Technologies, Santa Clara, CA | model 33220A | |
| MnCl2-(H2O)4 | Sigma | Molecular weight varies by batch, call manufacturer for exact measurement | |
| Perflutren lipid microspheres | Lantheus Medical Imaging, N. Billerica, MA | DEFINITY | |
| Microsphere agitator | Lantheus Medical Imaging, N. Billerica, MA | VIALMIX | |
| MR imaging coil | m2m Imaging Corp., Hillcrest, OH | 35 mm diameter quadrature transmit/receive volume coil | |
| MRI system | GE Healthcare, Milwaukee, WI | GE EXCITE console operating a 7-T horizontal bore magnet | |
| Image analysis environment | Visage Imaging, San Diego, CA, MathWorks, Natick MA | Amira MATLAB |
References
- Aoki, I. Detection of the anoxic depolarization of focal ischemia using manganese-enhanced MRI. Magnet. Reson. Med. 50, 7-12 (2003).
- Aoki, I. Dynamic activity-induced manganese-dependent contrast magnetic resonance imaging. DAIM MRI). Magnet. Reson. Med. 48, 927-933 (2002).
- Duong, T. Q., Silva, A. C., Lee, S. P., Kim, S. G. Functional MRI of calcium-dependent synaptic activity: Cross correlation with CBF and BOLD measurements. Magnet. Reson. Med. 43, 383-392 (2000).
- Lin, Y. J., Koretsky, A. P. Manganese ion enhances T-1-weighted MRI during brain activation: An approach to direct imaging of brain function. Magnet. Reson. Med. 38, 378-388 (1997).
- Lu, H. B. Cocaine-induced brain activation detected by dynamic manganese-enhanced magnetic resonance imaging (MEMRI). P. Natl. Acad. Sci. U.S.A. 104, 2489-2494 (2007).
- Drapeau, P., Nachshen, D. A. Manganese fluxes and manganese-dependent neurotransmitter release in presynaptic nerve-endings isolated from rat-brain. J. Physiol-London. 348, 493-510 (1984).
- Narita, K., Kawasaki, F., Kita, H. Mn and Mg influxes through Ca channels of motor-nerve Terminals are prevented by verapamil in Frogs. Brain Res. 510, 289-295 (1990).
- Hynynen, K., McDannold, N., Vykhodtseva, N., Jolesz, F. A. Noninvasive MR imaging-guided focal opening of the blood-brain barrier in rabbits. Radiology. 220, 640-644 (2001).
- Sheikov, N., McDannold, N., Vykhodtseva, N., Jolesz, F., Hynynen, K. Cellular mechanisms of the blood-brain barrier opening induced by ultrasound in presence of microbubbles. Ultrasound Med. Biol. 30, 979-989 (2004).
- McDannold, N., Vykhodtseva, N., Raymond, S., Jolesz, F. A., Hynynen, K. MRI-guided targeted blood-brain barrier disruption with focused ultrasound: Histological findings in rabbits. Ultrasound Med. Biol. 31, 1527-1537 (2005).
- McDannold, N., Vykhodtseva, N., Hynynen, K. Targeted disruption of the blood-brain barrier with focused ultrasound: association with cavitation activity. Phys. Med. Biol. 51, 793-807 (2006).
- Howles, G. P. Contrast-enhanced in vivo magnetic resonance microscopy of the mouse brain enabled by noninvasive opening of the blood-brain barrier with ultrasound. Magnet. Reson. Med. 64, 995-1004 (2010).
- Howles, G. P., Qi, Y., Johnson, G. A. Ultrasonic disruption of the blood-brain barrier enables in vivo functional mapping of the mouse barrel field cortex with manganese-enhanced MRI. Neuroimage. 50, 1464-1471 (2010).
- Woolsey, T. A., Welker, C., Schwartz, R. H. Comparative anatomical studies of sml face cortex with special reference to occurrence of barrels in layer-4. J. Comp. Neurol. 164, 79-94 (1975).
- Howles, G. P., Nouls, J. C., Qi, Y., Johnson, G. A. Rapid production of specialized animal handling devices using computer-aided design and solid freeform fabrication. J. Magnet. Reson. Imag. 30, 466-471 (2009).
- Paxinos, G., Franklin, K. B. J. The mouse brain in stereotaxic coordinates. , 2nd edn, Academic Press. (2001).
- Cross, D. J. Statistical mapping of functional olfactory connections of the rat brain in vivo. Neuroimage. 23, 1326-1335 (2004).
- Venot, A., Lebruchec, J. F., Golmard, J. L., Roucayrol, J. C. An automated-method for the normalization of scintigraphic images. J. Nucl. Med. 24, 529-531 (1983).
- Aoki, I., Naruse, S., Tanaka, C. Manganese-enhanced magnetic resonance imaging (MEMRI) of brain activity and applications to early detection of brain ischemia. Nmr. Biomed. 17, 569-580 (2004).
- Welker, E., Vanderloos, H. Quantitative correlation between barrel-field size and the sensory innervation of the whiskerpad - a comparative-study in 6 strains of mice bred for different patterns of mystacial vibrissae. J. Neurosci. 6, 3355-3373 (1986).
- McCasland, J. S., Woolsey, T. A. High-resolution 2-deoxyglucose mapping of functional cortical columns in mouse barrel cortex. J. Comp. Neurol. 278, 555-569 (1988).
- Irwin, S. Comprehensive observational assessment : A systematic quantitative procedure for assessing behavioral and physiologic state of mouse. Psychopharmacologia. 13, 222-257 (1968).
- Choi, J. J., Pernot, M., Small, S. A., Konofagou, E. E. Noninvasive, transcranial and localized opening of the blood-brain barrier using focused ultrasound in mice. Ultrasound Med. Biol. 33, 95-104 (2007).
- McDannold, N., Vykhodtseva, N., Hynynen, K. Use of ultrasound pulses combined with definity for targeted blood-brain barrier disruption: A feasibility study. Ultrasound Med. Biol. 33, 584-590 (2007).
- Silva, A. C., Lee, J. H., Aoki, L., Koretsky, A. R. Manganese-enhanced magnetic resonance imaging (MEMRI): methodological and practical considerations. Nmr. Biomed. 17, 532-543 (2004).
- Meiri, U., Rahamimoff, R. Neuromuscular transmission - inhibition by manganese ions. Science. 176, 308(1972).
- Aschner, M., Guilarte, T. R., Schneider, J. S., Zheng, W. Manganese: Recent advances in understanding its transport and neurotoxicity. Toxicol. Appl. Pharm. 221, 131-147 (2007).
- Watanabe, T., Frahm, J., Michaelis, T. Manganese-enhanced MRI of the mouse auditory pathway. Magnet. Reson. Med. 60, 210-212 (2008).
- Yu, X., Wadghiri, Y. Z., Sanes, D. H., Turnbull, D. H. In vivo auditory brain mapping in mice with Mn-enhanced MRI. Nat. Neurosci. 8, 961-968 (2005).
- Yu, X. Statistical mapping of sound-evoked activity in the mouse auditory midbrain using Mn-enhanced MRI. Neuroimage. 39, 223-230 (2008).
Access restricted. Please log in or start a trial to view this content.
Reprints and Permissions
Request permission to reuse the text or figures of this JoVE article
Request PermissionExplore More Articles
This article has been published
Video Coming Soon
Copyright © 2025 MyJoVE Corporation. All rights reserved