A subscription to JoVE is required to view this content. Sign in or start your free trial.
Method Article
Tangential Flow Ultrafiltration: A “Green” Method for the Size Selection and Concentration of Colloidal Silver Nanoparticles
In This Article
Summary
Tangential flow ultrafiltration (TFU) is a recirculation method used for the weight-based separation of biosamples. TFU was adapted to size-select (1-20 nm diameter) and highly concentrate a large volume of polydisperse silver nanoparticles (4 L of 15.2 μg ml-1 down to 4 ml of 8,539.9 μg ml-1) with minimal aggregation.
Abstract
Nowadays, AgNPs are extensively used in the manufacture of consumer products,1 water disinfectants,2 therapeutics,1, 3 and biomedical devices4 due to their powerful antimicrobial properties.3-6 These nanoparticle applications are strongly influenced by the AgNP size and aggregation state. Many challenges exist in the controlled fabrication7 and size-based isolation4,8 of unfunctionalized, homogenous AgNPs that are free from chemically aggressive capping/stabilizing agents or organic solvents.7-13 Limitations emerge from the toxicity of reagents, high costs or reduced efficiency of the AgNP synthesis or isolation methods (e.g., centrifugation, size-dependent solubility, size-exclusion chromatography, etc.).10,14-18 To overcome this, we recently showed that TFU permits greater control over the size, concentration and aggregation state of Creighton AgNPs (300 ml of 15.3 μg ml-1 down to 10 ml of 198.7 μg ml-1) than conventional methods of isolation such as ultracentrifugation.19
TFU is a recirculation method commonly used for the weight-based isolation of proteins, viruses and cells.20,21 Briefly, the liquid sample is passed through a series of hollow fiber membranes with pore size ranging from 1,000 kD to 10 kD. Smaller suspended or dissolved constituents in the sample will pass through the porous barrier together with the solvent (filtrate), while the larger constituents are retained (retentate). TFU may be considered a "green" method as it neither damages the sample nor requires additional solvent to eliminate toxic excess reagents and byproducts. Furthermore, TFU may be applied to a large variety of nanoparticles as both hydrophobic and hydrophilic filters are available.
The two main objectives of this study were: 1) to illustrate the experimental aspects of the TFU approach through an invited video experience and 2) to demonstrate the feasibility of the TFU method for larger volumes of colloidal nanoparticles and smaller volumes of retentate. First, unfuctionalized AgNPs (4 L, 15.2 μg ml-1) were synthesized using the well-established Creighton method22,23 by the reduction of AgNO3 with NaBH4. AgNP polydispersity was then minimized via a 3-step TFU using a 50-nm filter (460 cm2) to remove AgNPs and AgNP-aggregates larger than 50 nm, followed by two 100-kD (200 cm2 and 20 cm2) filters to concentrate the AgNPs. Representative samples were characterized using transmission electron microscopy, UV-Vis absorption spectrophotometry, Raman spectroscopy, and inductively coupled plasma optical emission spectroscopy. The final retentate consisted of highly concentrated (4 ml, 8,539.9 μg ml-1) yet lowly aggregated and homogeneous AgNPs of 1-20 nm in diameter. This corresponds to a silver concentration yield of about 62%.
Protocol
1. Synthesis of Colloidal AgNPs
The reaction mechanism for the Creighton method (slightly modified, inexpensive)22 is described in great detail in the Supporting information of reference Pavel et.al together with the undesired hydrolysis side-reaction of NaBH4 at room temperature or higher.23
- Clean all glassware for 12-24 hr in a 10% HNO3 bath, then for 4-12 hr in a 1.25 M NaOH in 40% ethanol bath, and finally autoclave. Glassware should be rinsed thoroughly a minimum of five times with ultrapure water (17 MΩ or higher) after the acid and base bath steps.
- Prepare 300 ml of a 2 mM NaBH4 solution and 100 ml of a 1 mM AgNO3 solution using autoclaved water cooled at 10 °C. The lower temperatures will prevent the side-reaction of NaBH4.
- Add 300 ml of 2 mM NaBH4 solution to a 500 ml Erlenmeyer reaction flask containing a stir bar and wrap the flask with aluminum foil to prevent silver oxidation. Place the flask in an ice bath on a stir plate and stir the solution at 325 rpm for 10 min.
- Prime a 25 ml burette by rinsing with a full column of ultrapure water. After priming, fill the burette with AgNO3 solution and wrap with aluminum foil.
- In a dark room, add 50 ml of 1 mM AgNO3 solution at a rate of 1 drop sec-1 to the NaBH4 solution with continuous stirring (Figure 1A). Cover the middle section of the apparatus with a "foil tent" to minimize light exposure during the AgNO3 addition. The AgNO3 addition will require 30-40 min. Replenish the ice bath periodically.
- After the AgNO3 addition is complete, replenish the ice bath and continue stirring the colloidal solution for an additional 45-50 min. The formation of colloidal AgNPs is signaled by a change in color from colorless to a golden yellow, which is characteristic of the surface plasmon resonance maximum of AgNPs (Figure 1B).
- Once the reaction is completed, refrigerate the colloid. Colloidal AgNP batches may be combined after one week if the colloid has remained consistent, i.e., the colloidal solution has not aggregated and the batch has been characterized using UV-Vis absorption spectrophotometry and Raman spectroscopy to identify possible aggregation or contaminants.
2. Characterization of Colloidal AgNPs
A Cary 50 UV-VIS-NIR spectrophotometer (Varian Inc.) and a LabRamHR 800 Raman system (Horiba Jobin Yvon, Inc.) equipped an Olympus BX41 confocal Raman microscope, were utilized for AgNP characterization. The Cary WinUV software, LabSpec v.5 and Origin 8.0 software were employed for the data collection and analysis.
Note: The acquisition parameters will have to be optimized for other instrumentation models.
Determination of Surface Plasmon Resonance of Colloidal AgNPs via UV-Vis Spectrophotometry
- Fill a 1 cm3 disposable cuvette with Creighton colloid and ultrapure water in a 1:10 volume ratio. Fill another 1 cm3 cuvette with ultrapure water for a blank baseline correction. Wipe the outside of both cuvettes with a Kimwipe.
- Set the spectrophotometer to absorbance mode from a Y minimum of -0.5 to a Y maximum of 1.0. Set the X scanning window to 200-800 nm and select a fast scan rate of 4,800 nm min-1 with baseline correction.
- Insert the cuvette filled with water into the instrument and run a baseline scan. Repeat if necessary until a non-zero baseline control is achieved.
- Replace the blank cuvette with the sample cuvette and initiate an absorbance scan for the collection of the UV-Vis absorption spectrum of the colloidal sample (Figure 1C).
Purity Test of Colloidal AgNPs via Raman spectroscopy
Due to the time limitation of the video demonstration (10-15 min video) and the space limitation of the protocol text (maximum 3 pages), this experimental section will not be videotaped.
- Set the instrument parameter settings as follows: excitation source (632.8 nm He-Ne), filter (no filter, laser power at the sample ~ 17 mW), confocal hole (300 μm), spectrometer (730 cm-1), holographic grating (600 groves/mm), objective lens (50x long working distance air objective), exposure time (30 s), and accumulation cycles (5).
- Use a clean pipette to fill a 2 ml quartz cuvette with colloid and gently insert the plug. Use a Kimwipe to clean off fingerprints, smudges or colloid from the surface of the cuvette. Significantly lower the microscope stage. Select the 50x objective lens and place the cuvette onto the stage.
- Focus the laser beam on the AgNP colloid directly underneath the inner wall of the cuvette using the video mode of the instrument and the Olympus camera. Turn off room lights and acquire Raman spectrum (Figure 1D).
3. Size-selection and Concentration of Colloidal AgNPs via Tangential Flow Ultrafiltration (TFU)
A KrosFlo II Research filtering system (Spectrum Laboratories, Rancho Dominguez, CA) was used to limit the AgNP polydispersity and to concentrate them (Figure 2). The three steps of the TFU process were: (1) Size-selection of AgNPs and AgNP-aggregates of 50-nm in diameter and larger using a 50-nm MidiKros polysulfone module (460 cm2), 2) Size selection and concentration of AgNPs of 1-20 nm in diameter using a 100-kD MidiKros filter (200 cm2), and (3) Further volume reduction using a 100-kD MicroKros polysulfone filter (20 cm2) (Figure 3).
Step 1
- Connect the size 17 MasterFlex feeding tubing to the peristaltic pump according to Figure 2A. A Y-junction and a tubing junction will be needed for the set-up. Attach tubing to the 50-nm MidiKros module. Be sure to secure tubing to filter using zip ties. Select tubing size 17 using SIZE button.
- Select counterclockwise pump direction using DIR button. Make sure MODE button is on INT.
- Lower the pump rate to below 300 ml min-1 before starting pump. The pump rate should be adjusted according to the size of the used tubing. It should be a small setting to permit the operator to promptly react to potential leaks but large enough to still have an effect of priming the system. In order to create the vacuum needed to draw colloid from the reservoir into the tubing and filter, cut the tubing that leads from the bottom section of the filter to the top portion of the Y-junction in the middle of the tubing.
- Place the section of tubing that leads from the filter into the reservoir bottle and clamp off the bottom section of tubing near the Y-junction with a clamp or by hand. Turn on the pump. The created vacuum should begin siphoning the colloid.
- Once the liquid is flowing freely through the tube, turn off the pump, join the broken section of tubing with a tubing junction and secure with zip ties. Turn on the pump again and continue filtration.
- Check the tubing circuit for leaks. If a leak is found, fix the leak by adjusting the fitting or re-securing with a zip tie. Once the tubing system is leak free, the pump flow rate may be increased to no greater than 700 ml min-1. This pump rate value should be optimized according to tubing size to avoid tubing failure. Continue filtration until the liquid in the reservoir bottle is depleted to nearly nothing.
- Once the filtration is complete, collect the filtrate that contains AgNPs of 50-nm diameter and smaller. The retentate may be saved for further analysis according to the specific AgNP application.
Step 2
- Rinse the tubing with 2% HNO3 and ultrapure water prior to installing the 100-kD MidiKros filter using the same setup as for the 50-nm module.
- Repeat step 3.3 using the 100-kD MidiKros module.
- Once the filtration is complete, collect the contents of the tubing and the filter (100-kD retentate). The volume should be approximately 50 ml.
Step 3
- Connect the size 14 MasterFlex tubing and the 100-kD MicroKros FILTER to the peristaltic pump according to Figure 2B. Secure all junctions with zip ties. Select tubing size 14 on the pump using the SIZE button and lower the pump rate to 30 ml min-1.
- Begin the filtration process. Check the tubing circuit for leaks. If a leak is found, fix the leak by adjusting the fitting or re-securing with a zip tie.
- Once the tubing system is leak free, the pump flow rate may be increased to no greater than 90 ml min-1. Continue filtration until the liquid remaining in the reservoir bottle contains a minimal amount of concentrate.
- The remaining contents of the tubing and filter can be collected into the reservoir bottle by removing the feeding tube from the bottle while the pump is still running. Once the tubing and filter contents are in the reservoir bottle, the pump may be turned off.
4. Quantification of Silver Amount in Colloidal AgNPs by Inductively Coupled Plasma Optical Emission Spectroscopy (ICP-OES)
Each colloidal sample was chemically digested and the amount of silver was quantified by ICP-OES using an A 710E spectrometer (Varian Inc.). A linear regression calibration curve for silver (Figure 4) was constructed using eight silver standards (0, 3, 7, 10, 15, 25, 50, and 100 μg L-1), which were prepared from a 10,000 μg ml-1 silver standard for trace metal analysis (Ultra Scientific).
- Chemically digest samples using HNO3. The representative samples are the original colloid (step 1), 50-nm filtrate (step 1), 100-kD retentate (step 2), and final 100-kD retentate (step 3) (Figure 3).
- The samples should be diluted with 2% HNO3 using the following volume ratios: 1:1000 for the original colloid, 1:1000 for the 50-nm filtrate, 1:25,000 for the first 100-kD retentate, and 1:250,000 for the final 100-kD retentate. To prevent silver leaching, all samples should be stored in low-density polypropylene containers.
- Set the ICP-OES instrument parameters as follows: wavelength for Ag (328.068 nm), power (1.20 kW), plasma flow (15.0 L min-1), auxiliary flow (1.50 L min-1), and nebulizer pressure (200 kPa).
- Each sample should be measured in triplicate with a replicate time of 10 s. Between-measurement stabilization time of 15 sec and a 30 sec sample uptake delay should be used. A method blank should be introduced between every sample to reduce potential cross-contamination.
5. Size Distribution of Colloidal AgNPs via Transmission Electron Microscopy (TEM)
A Phillips EM 208S TEM was used to visualize the colloidal AgNPs. Electron micrographs were captured using a high resolution Gatan Bioscan camera and analyzed in ImageJ software.24
- Dilute the 100-kD retentate sample with ultrapure water (1:100 volume ratio). Deposit 20 μl of the original colloid and the diluted 100-kD retentate (step 3) on 300-mesh formvar-coated gold grids (Electron Microscopy Sciences). Allow the grids to dry in a desiccator. View within one day.
- Set the accelerating potential of the TEM instrument at 70 kV to visualize AgNPs. Capture electron micrographs (Figure 5) using the high-resolution camera and save as tagged image files format (tiff).
6. Representative Results
Synthesis and Characterization of Colloidal AgNPs
Four liters of Creighton colloidal AgNPs were successfully synthesized using the setup displayed in Figure 1A. The final colloid had a characteristic golden yellow color (Figure 1B).22, 23 The UV-Vis absorption spectrum of this colloid had a typical sharp, symmetrical surface plasmon peak (SPR) at 394 nm (Figure 1C). The Raman spectrum of the original Creighton colloid and the final 100-kD retentate presented only three vibrational modes, namely the bending (1640 cm-1) and symmetric and asymmetric stretching modes of H2O (3245 cm-1 and 3390 cm-1, respectively) (Figure 1D).
TFU of Colloidal AgNPs
The TFU setup and the schematic of the 3-step TFU process are depicted in Figures 2 and 3, respectively. In step 1, a 50-nm filter (460 cm2) was utilized to size-select and to remove AgNPs and AgNP-aggregates of 50-nm diameter and larger from the original colloid (about 100 ml of 50-nm retentate). This step was also accompanied by a small volume reduction from 4 L of original colloid down to 3.9 L of 50-nm filtrate. No backwashing or flow disruption step was used. The largest volume reduction (i.e., water removal) was obtained in step 2, when the 50-nm filtrate was subsequently run through a 100-kD filter (200 cm2). The resulting 100-kD retentate had a total volume of 50 ml. Most of the synthesis byproducts and excess reagents were eliminated in this step through the water solvent (3.850 ml of 100-kD filtrate). Further, AgNP concentration was achieved by the addition of a third filtration step to the previously reported procedure.19 In this step 3, a 100-kD filter of a smaller surface area (20 cm2) reduced the 100-kD retentate volume to 4.0 ml. The TEM measurements will demonstrate that this final 100-kD retentate consists mostly of lowly aggregated AgNPs of 1-20 nm in diameter.
ICP-OES and TEM of Colloidal AgNPs
A linear regression calibration curve (Figure 4) for silver was constructed from eight standards (0, 3, 7, 10, 15, 25, 50, and 100 μg L-1). The amount of silver in each of the four representative colloidal samples was then determined from the ICP-OES calibration curve through extrapolation: original colloid (15.2 ppm, Figure 3A), 50-nm filtrate (14.1 ppm, Figure 3B), first 100-kD retentate (683.1 ppm, Figure 3C) and final 100-kD retentate (8,538.9 ppm, Figure 3D). The actual yield of 15.2 ppm is very close to the typical theoretical yield of 15.4 ppm for the Creighton reaction. The extreme concentration of AgNPs (4 ml of 8,538.9 ppm) was reflected by a dramatic change in color from golden yellow for the original colloid to dark brown for the final 100-kD retentate (Figure 3, insets of vial pictures). The quality of the filters was found to be critical to the TFU process, in particular to step 1. The final retentate concentrations ranged from 3,390.1 ppm to 9,333.3 ppm depending on the condition of the filters (heavily used versus brand new). If the membrane pores become compromised, AgNPs that have diameters less than 50-nm will also be retained and will subsequently decrease the overall amount of AgNPs that is collected in the filtrate. Optimization of the filtration process to include pressure monitoring and proper cleaning can increase the life span of the filters.
Representative TEM micrographs of the original Creighton colloid and the final 100-kD retentate (step 3) are shown in Figure 5A and 5C, respectively. In their unaggregated state, AgNPs appear as black round areas on a lighter grey background. Approximately 800 AgNPs were identified in the TEM micrographs of each of the two samples and were analyzed using the Image J software. One particle was defined by a complete and enclosed perimeter. An area threshold value was set at 1.0 nm2 according to the resolution of the TEM micrographs. The AgNP counts and area data were then exported into Microsoft Excel and the AgNP diameters were extrapolated. The average AgNP diameter in the original colloid and the final 100-kD retentate were determined to be 9.3 nm and 11.1 nm, respectively. The diameter measurements of the AgNPs were then exported to Origin 8.0 software and a TEM size histogram was constructed for each sample (Figure 5B and 5D).
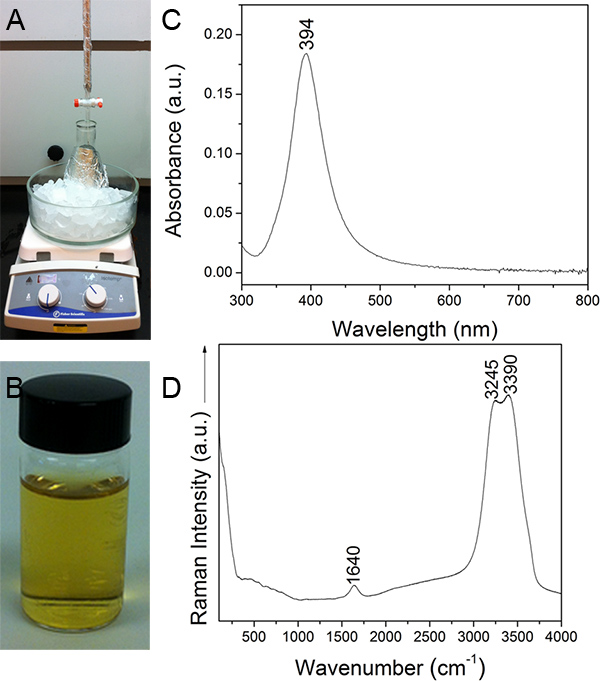
Figure 1. A) Synthesis setup, B) Characteristic color, C) UV-Vis absorption spectrum, and D) Raman spectrum of Creighton colloidal AgNPs.
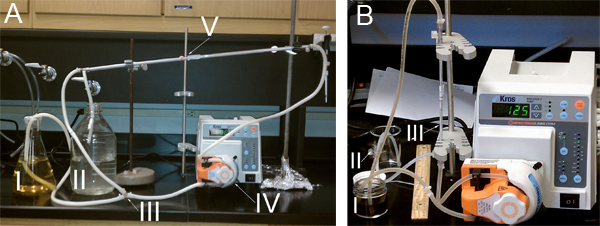
Figure 2. TFU experimental setup for A) steps 1 and 2: I) Reservoir containing Creighton colloidal AgNPs. II) Reservoir for filtrate collection. III) Y-junction in tubing. IV) Peristaltic pump head. V) Either 50-nm or 100-kD Midi Kros filter. B) step 3: I) Reservoir containing Creighton colloidal AgNPs. II) Reservoir for filtrate collection. III) 100-kD Micro Kros filter.
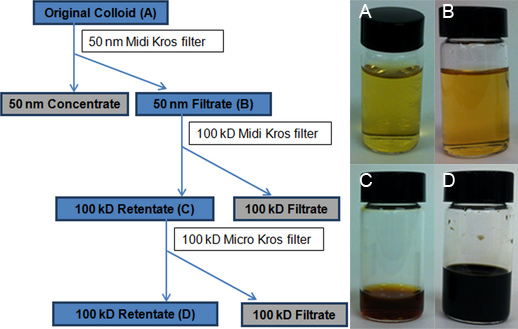
Figure 3. Flowchart depicting the TFU process. The blue-shaded boxes mark the colloidal suspensions of AgNPs collected for further analysis. Vial photographs show A) Original colloid batch, B) 50-nm filtrate collected after processing the original colloid through the 50-nm filter (460 cm2), C) first 100-kD retentate obtained after volume reduction using the 100-kD Midi Kros filter (200 cm2), and D) final 100-kD retentate resulting from the volume reduction using the 100-kD Micro Kros filter (20 cm2). The 100-kD filtrate looks like water.
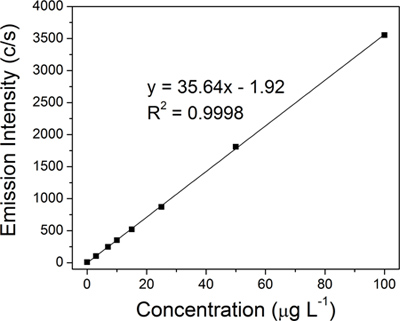
Figure 4. ICP-OES linear calibration constructed using eight silver standards: 0, 3, 7, 10, 15, 25, 50, and 100 μg L-1.
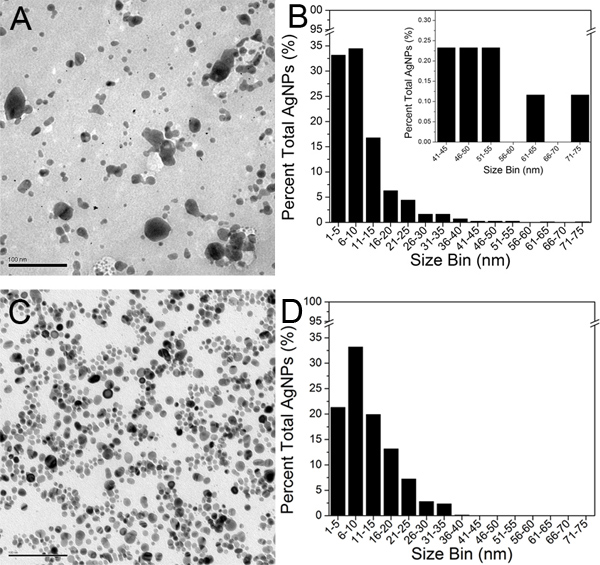
Figure 5. TEM micrographs of A) original Creighton AgNPs and C) final 100-kD retentate (scale bar is 100 nm). TEM size histograms constructed by analyzing approximately 800 AgNPs for B) original Creighton AgNPs, and D) final 100-kD retentate. The inset in Figure 5B shows the expanded 41-75 nm size range for comparison purposes. Click here to view larger figure.
Discussion
UV-Vis Absorption Spectrophotometry and Raman Spectroscopy of Colloidal AgNPs
It is well known that the number of surface plasmon resonance peaks in the absorption spectrum of a colloid decreases as the symmetry of the AgNPs increases. Additionally, AgNP aggregation leads to the appearance of broader or red-shifted peaks.25,26 The presence of a single, sharp and symmetrical SPR peak at 394 nm is indicative of small, spherical AgNPs of moderate aggregation and size distribution.
<...Disclosures
No conflicts of interest declared.
Acknowledgements
Funding from the National Science Foundation through the NUE in Engineering and the LEADER Consortium Programs is gratefully acknowledged.
Materials
| Name | Company | Catalog Number | Comments |
| Silver nitrate (AgNO3) | Acros Organics Inc. | CAS: 7761-88-8 | |
| Sodium borohydride (NaBH4) | Acros Organics Inc. | CAS: 16940-66-2 | |
| Nitric acid (HNO3, Optima) | Fisher Scientific Inc. | A467-1 | Trace metal grade for ICP analysis |
| 10,000 μg ml-1 silver standard, EnviroConcentrate | Ultra Scientific | US-IAA-047 | |
| KrosFlo Research IIi Tangential Flow Filtration System | Spectrum Laboratories Inc. | SYR2-U20-01N | |
| 0.05 μm PS (0.5 mm) 460 cm2 | Spectrum Laboratories Inc. | X30S-900-02N | |
| Midi 100 kD PS 200 cm2 | Spectrum Laboratories Inc. | X3-100S-901-02N | |
| Micro100 kD PS 20 cm2 | Spectrum Laboratories Inc. | X1AB-300-10N | |
| MasterFlex C-Flex tubing L/S Size 17 | Cole-Palmer Instrument Co. | 06424-17 | |
| MasterFlex C-Flex tubing L/S Size 14 | Cole-Palmer Instrument Co. | 06424-14 | |
| Cary 50 UV-VIS-NIR spectrophotometer | Varian Inc. | ||
| LabRam HR 800 system | Horiba Jobin Yvon Inc. | ||
| Varian 710ES ICP-–S | Varian Inc. | ||
Table 1. Specific reagents and equipment. | |||
References
- Savage, N., Diallo, M. S. Nanomaterials and Water Purification: Opportunities and Challenges. Journal of Nanoparticle Research. 7, 331-342 (2005).
- Jain, J. Silver Nanoparticles in Therapeutics: Development of an Antimicrobial Gel Formulation for Topical Use. Mol. Pharmaceutics. 6, 1388-1401 (2009).
- Dal Lago, V., Franca, d. O., de, A. G., Kobarg, J., Borba Cardoso, M. Size-selective silver nanoparticles: future of biomedical devices with enhanced bactericidal properties. J. Mater. Chem. 21, 12267-12273 (2011).
- Panacek, A. Silver Colloid Nanoparticles: Synthesis, Characterization, and Their Antibacterial Activity. J. Phys. Chem. B. 110, 16248-16253 (2006).
- Elechiguerra, J. Interaction of silver nanoparticles with HIV-1. Journal of Nanobiotechnology. 3, 6 (2005).
- Jana, N. R., Sau, T. K., Pal, T. Growing Small Silver Particle as Redox Catalyst. J. Phys. Chem. B. 103, 115-121 (1999).
- Tolaymat, T. M. An evidence-based environmental perspective of manufactured silver nanoparticle in syntheses and applications: A systematic review and critical appraisal of peer-reviewed scientific papers. Sci. Total Environ. 408, 999-1006 (2010).
- Willets, K. Surface-enhanced Raman scattering (SERS) for probing internal cellular structure and dynamics. Analytical and Bioanalytical Chemistry. 394, 85-94 (2009).
- Novak, J. P., Nickerson, C., Franzen, S., Feldheim, D. L. Purification of Molecularly Bridged Metal Nanoparticle Arrays by Centrifugation and Size Exclusion Chromatography. Anal. Chem. 73, 5758-5761 (2001).
- Hossain, M. K., Kitahama, Y., Huang, G. G., Han, X., Ozaki, Y. Surface-enhanced Raman scattering: realization of localized surface plasmon resonance using unique substrates and methods. Analytical and Bioanalytical Chemistry. 394, 1747-1760 (2009).
- Henglein, A., Giersig, M. Formation of Colloidal Silver Nanoparticles: Capping Action of Citrate. J. Phys. Chem. B. 103, 9533-9539 (1999).
- Sapsford, K. E., Tyner, K. M., Dair, B. J., Deschamps, J. R., Medintz, I. L. Analyzing Nanomaterial Bioconjugates: A Review of Current and Emerging Purification and Characterization Techniques. Anal. Chem. 83, 4453-4488 (2011).
- Al-Somali, A., Krueger, K. M., Falkner, J. C., Colvin, V. L. Recycling Size Exclusion Chromatography for the Analysis and Separation of Nanocrystalline Gold. Anal. Chem. 76, 5903-5910 (2004).
- Hanauer, M., Pierrat, S., Zins, I., Lotz, A., Sonnichsen, C. Separation of Nanoparticles by Gel Electrophoresis According to Size and Shape. Nano Lett. 7, 2881-2885 (2007).
- Sweeney, S. F., Woehrle, G. H., Hutchison, J. E. Rapid Purification and Size Separation of Gold Nanoparticles via Diafiltration. J. Am. Chem. Soc. 128, 3190-3197 (2006).
- Clarke, N. Z., Waters, C., Johnson, K. A., Satherley, J., Schiffrin, D. J. Size-Dependent Solubility of Thiol-Derivatized Gold Nanoparticles in Supercritical Ethane. Langmuir. 17, 6048-6050 (2001).
- Schaaff, T. G. Isolation of Smaller Nanocrystal Au Molecules: Robust Quantum Effects in Optical Spectra. J Phys Chem B. 101, 7885-7891 (1997).
- Trefry, J. C. Size Selection and Concentration of Silver Nanoparticles by Tangential Flow Ultrafiltration for SERS-Based Biosensors. J. Am. Chem. Soc. 132, 10970-10972 (2010).
- Bhattacharjee, S., Bhattacharjee, C., Datta, S. Studies on the fractionation of & beta-lactoglobulin from casein whey using ultrafiltration and ion-exchange membrane chromatography. J. Membr. Sci. 275, 141-150 (2006).
- Eppler, A., Weigandt, M., Schulze, S., Hanefeld, A., Bunjes, H. Comparison of different protein concentration techniques within preformulation development. Int. J. Pharm. 421, 120-129 (2011).
- Creighton, J. A., Blatchford, C. G., Albrecht, M. G. Plasma resonance enhancement of Raman scattering by pyridine adsorbed on silver or gold sol particles of size comparable to the excitation wavelength. J. Chem. Soc. Faraday Trans. 2, 790-798 (1979).
- Pavel, I. E. Estimating the Analytical and Surface Enhancement Factors in Surface-Enhanced Raman Scattering (SERS): A Novel Physical Chemistry and Nanotechnology Laboratory Experiment. J. Chem. Educ. , (2011).
- Rasband, W. S. . ImageJ. , (1997).
- Kelly, K. L., Coronado, E., Zhao, L. L., Schatz, G. C. The Optical Properties of Metal Nanoparticles: The Influence of Size, Shape, and Dielectric Environment. J. Phys. Chem. B. 107, 668-677 (2003).
- Śileikaitċ, A., Prosyčevas, I., Puišo, J., Juraitis, A., Guobienċ, A. Analysis of Silver Nanoparticles Produced by Chemical Reduction of Silver Salt Solution. Mater. Sci. (Medziagotyra). 12, 287-291 (2006).
- Lewis, L. N. Chemical catalysis by colloids and clusters. Chem. Rev. 93, 2693-2730 (1993).
- Li, Y., Wu, Y., Ong, B. S. Facile Synthesis of Silver Nanoparticles Useful for Fabrication of High-Conductivity Elements for Printed Electronics. J. Am. Chem. Soc. 127, 3266-3267 (2005).
- Sun, Y., Xia, Y. Shape-Controlled Synthesis of Gold and Silver Nanoparticles. Science. 298, 2176-2179 (2002).
- Han, X., Zhao, B., Ozaki, Y. Surface-enhanced Raman scattering for protein detection. Analytical and Bioanalytical Chemistry. 394, 1719-1727 (2009).
- Pavel, I. Label-Free SERS Detection of Small Proteins Modified to Act as Bifunctional Linkers. J. Phys. Chem. C. 112, 4880-4883 (2008).
- Ladner, D. A., Steele, M., Weir, A., Hristovski, K., Westerhoff, P. Functionalized nanoparticle interactions with polymeric membranes. J. Hazard. Mater. , (2011).
Reprints and Permissions
Request permission to reuse the text or figures of this JoVE article
Request PermissionExplore More Articles
This article has been published
Video Coming Soon
Copyright © 2025 MyJoVE Corporation. All rights reserved