A subscription to JoVE is required to view this content. Sign in or start your free trial.
Method Article
SNARE-mediated Fusion of Single Proteoliposomes with Tethered Supported Bilayers in a Microfluidic Flow Cell Monitored by Polarized TIRF Microscopy
In This Article
Summary
Here, we present a protocol to detect single, SNARE-mediated fusion events between liposomes and supported bilayers in microfluidic channels using polarized TIRFM, with single molecule sensitivity and ~15 msec time resolution. Lipid and soluble cargo release can be detected simultaneously. Liposome size, lipid diffusivity, and fusion pore properties are measured.
Abstract
In the ubiquitous process of membrane fusion the opening of a fusion pore establishes the first connection between two formerly separate compartments. During neurotransmitter or hormone release via exocytosis, the fusion pore can transiently open and close repeatedly, regulating cargo release kinetics. Pore dynamics also determine the mode of vesicle recycling; irreversible resealing results in transient, "kiss-and-run" fusion, whereas dilation leads to full fusion. To better understand what factors govern pore dynamics, we developed an assay to monitor membrane fusion using polarized total internal reflection fluorescence (TIRF) microscopy with single molecule sensitivity and ~15 msec time resolution in a biochemically well-defined in vitro system. Fusion of fluorescently labeled small unilamellar vesicles containing v-SNARE proteins (v-SUVs) with a planar bilayer bearing t-SNAREs, supported on a soft polymer cushion (t-SBL, t-supported bilayer), is monitored. The assay uses microfluidic flow channels that ensure minimal sample consumption while supplying a constant density of SUVs. Exploiting the rapid signal enhancement upon transfer of lipid labels from the SUV to the SBL during fusion, kinetics of lipid dye transfer is monitored. The sensitivity of TIRF microscopy allows tracking single fluorescent lipid labels, from which lipid diffusivity and SUV size can be deduced for every fusion event. Lipid dye release times can be much longer than expected for unimpeded passage through permanently open pores. Using a model that assumes retardation of lipid release is due to pore flickering, a pore "openness", the fraction of time the pore remains open during fusion, can be estimated. A soluble marker can be encapsulated in the SUVs for simultaneous monitoring of lipid and soluble cargo release. Such measurements indicate some pores may reseal after losing a fraction of the soluble cargo.
Introduction
Membrane fusion is a universal biological process required for intracellular trafficking of lipids and proteins, secretion, fertilization, development, and enveloped virus entry into host organisms1-3. For most intracellular fusion reactions including release of hormones and neurotransmitters via exocytosis, the energy to fuse two lipid bilayers is provided by formation of a four-helix bundle between cognate soluble N-ethylmaleimide-sensitive factor attachment protein receptor (SNARE) proteins, anchored in the vesicle (v-SNARE) and the target membrane (t-SNARE)4, respectively. Synaptic vesicle exocytosis is the most tightly regulated fusion reaction and occurs within a millisecond after the arrival of an action potential1,4,5. The fusion pore, the initial connection between the two fusing compartments, can flicker open and closed multiple times before resealing or expanding irreversibly5-7. The former results in transient, "kiss & run" fusion, while the latter leads to full fusion. Factors governing the balance between these two modes of fusion and mechanisms regulating pore flickering are not well understood5,8.
SNARE proteins are required for exocytosis; synaptic vesicle fusion is abolished upon cleavage of SNAREs by neurotoxins9. Bulk fusion experiments using small unilamellar vesicles (SUVs) showed that SNAREs are not only required, but also sufficient to drive membrane fusion10. In this bulk assay, SUVs reconstituted with v-SNAREs (v-SUV) were doped with fluorescent phospholipids (N-(7-nitro-2-1,3-benzoxadiazol-4-yl)-phosphoethanolamine (NBD-PE) and (N-(lissamine rhodamine B sulfonyl)-phosphoethanolamine (LR-PE) and mixed with unlabeled vesicles containing t-SNAREs (t-SUV). Initially the fluorescence of NBD-PE in v-SUVs is quenched by Förster resonance energy transfer (FRET) to LR-PE. As labeled v-SUVs fuse with unlabeled t-SUVs, the fluorophore surface density in the now combined membrane is reduced and the resulting increase in NBD-PE fluorescence reports the extent of lipid mixing10. As the bulk assay is easy to set up and analyze, it has been widely used to study mechanisms of SNARE-mediated fusion10-14. However, it has several limitations, such as low sensitivity and poor time resolution. Most importantly, as an ensemble measurement, it averages results over all events making discrimination between docking and fusion, as well as detection of hemifusion intermediates difficult.
Over the past decade several groups, including ours, have developed new assays to monitor fusion events at the single vesicle level15-27. Ha and colleagues used v-SUVs tethered onto a surface and monitored their fusion with free t-SUVs18,19. Lipid mixing was monitored using FRET between a pair of lipid-bound fluorophores embedded in the v- and t-SUVs, respectively, using total internal reflection fluorescence (TIRF) microscopy18. Later, Brunger's laboratory used a single lipid-label species together with a contents marker for simultaneous detection of lipid and contents mixing20,28. Both the lipid and the contents markers were included at high, self-quenching concentrations; fusion with unlabeled SUVs resulted in fluorescence dequenching20,28.
Others have fused v-SUVs to planar bilayers reconstituted with t-SNAREs15-17,21-27,29. The planar geometry of the target (t-SNARE containing) bilayer better mimics the physiological fusion process of small, highly curved vesicles with a flat plasma membrane. The Steinem group employed pore-spanning membranes reconstituted with t-SNAREs, suspended over a porous silicon nitride substrate and detected fusion with individual v-SUVs using confocal laser scanning microscopy23. Others fused v-SUVs to planar bilayers reconstituted with t-SNAREs, supported on a glass substrate15-17,21,22,24-27,29. The great advantage of using supported bilayers (SBLs) is that TIRF microscopy can be used to detect docking and fusion events with excellent signal-to-noise ratio and without interference from free v-SUVs, although using microfluidics also provides single-event resolution using standard far-field epifluorescence microscopy24.
A major concern is whether and how substrate-bilayer interactions affect supported bilayer quality and the fusion process. Early work made use of planar SBLs that were directly supported on a glass or quartz substrate15-17. These SBLs were made by adsorption, bursting, spreading and fusion of t-SUV membranes on the substrate. It was soon realized, however, that omitting a key t-SNARE component, SNAP25, from SBLs prepared in this manner resulted in v-SUV docking and fusion kinetics indistinguishable from those obtained using the complete t-SNAREs17. Because SNAP25 is absolutely required for fusion in vivo30,31, the physiological relevance of these early attempts was put into question. Tamm's group overcame this challenge by using better controlled supported bilayer formation21. It used Langmuir-Blodgett deposition for the protein-free first leaflet of the SBL, followed by fusion of that monolayer with t-SUVs21. This resulted in SNAP25-dependent fusion.
To avoid potential artefacts associated with a bilayer directly supported on a glass substrate without need to use Langmuir-Blodgett methods, Karatekin et al. introduced a soft, hydrated poly(ethylene glycol) (PEG) cushion between the bilayer and the substrate24. This modification also resulted in SNAP25-dependent fusion24. Bilayers cushioned on a soft polymer layer had been known to better preserve transmembrane protein mobility and function32, and had been used in fusion studies with viruses33. In addition, PEGylated bilayers seem to retain some ability to self-heal and are very robust34,35. First, a fraction of commercially available, lipid-linked PEG chains are included in the t-SUV membrane. When these t-SUVs burst and form a planar bilayer on a glass substrate, a PEG brush covers both leaflets of the planar bilayer. Because planar bilayer formation is driven by adhesion of the PEG chains surrounding t-SUVs onto the hydrophilic glass surface, liposome bursting and planar bilayer formation are relatively insensitive to the lipid composition used. However, when large amounts of cholesterol are included, increasing the cohesive properties of the SUVs, the SUVs may not burst spontaneously. If this is the case, osmotic shock or divalent ions can be employed to help planar bilayer formation25.
As mentioned above, in this approach a PEG brush covers both sides of the planar, supported bilayer. The brush facing the microfluidic flow channel helps to prevent nonspecific adhesion of incoming v-SUVs which are also usually covered with a PEG layer. Formation of v- and t-SNARE complexes starts from the membrane-distal N-termini and proceeds in stages toward the membrane-proximal domains36. For the v-SUVs to interact with the t-SBL, the v- and t-SNARE N-termini need to protrude above the PEG brushes, which seems to be the case under the conditions of the assay. Brush height can be adapted to study proteins other than SNAREs by varying the density of PEGylated lipids and the PEG chain length37,38. Another benefit of the PEG brushes covering the proximal surfaces of the fusing bilayers is that they mimic the crowded environment of biological membranes which are packed with 30,000-40,000 integral membrane proteins per square micron39. Just like the PEG chains in this assay, the repulsive protein layer covering biological membranes needs to be pushed aside to allow for contact between the two phospholipid bilayers for fusion to occur.
Microfluidic flow channels are used in this assay, as they offer unique advantages. First, microfluidic flow enables more uniform deposition of t-SUVs to spread and fuse to form the t-SBL. Second, the small channel volume (< 1 µl) minimizes sample consumption. Third, the small volumes required allow the entire experiment to be conducted under constant flow. Flow removes weakly, presumably non-specifically, adhered v-SUVs from the SBL16. It also maintains a constant density of v-SUVs above the t-SBL, simplifying kinetic analysis17. Finally, docked vesicles are easily distinguished from free ones carried by the flow25. Fourth, several microfluidic channels can be used on the same coverslip, each probing a different condition. This allows comparison of conditions during the same experimental run. A similar approach has been used by the van Oijen group to study fusion between influenza virus and cushioned SBLs33.
In TIRF microscopy, the exponential decay of the evanescent field (with a decay constant ~100 nm) confines fluorescence excitation to those molecules that are in very close proximity of the glass-buffer interface. This minimizes contribution of fluorescent molecules that are further away, increases the signal-to-noise ratio, and allows single molecule sensitivity with frame exposure times of 10-40 msec. The evanescent field also leads to a signal increase upon fusion: as the labeled lipids transfer from the SUV into the SBL, they find themselves, on average, in a stronger excitation field. This increase in fluorescence is stronger for larger liposomes.
If polarized light is used to generate the evanescent field, additional effects contribute to changes in fluorescence upon transfer of labels from the SUV into the SBL. Some lipid dyes have a transition dipole oriented with a preferred mean angle with respect to the bilayer in which they are embedded. This creates a difference in the amount of fluorescence emitted by the fluorophores when they are in the SUV versus the SBL, since the polarized beam will excite dyes in the two membranes differently. For the former, the excitation beam will interact with transition dipoles oriented around the spherical SUV, whereas for the latter, dipole orientations will be confined by the flat SBL geometry. For example, when s-polarized incident light (polarized normal to the plane of incidence) is used, excitation is more efficient when the dye is in the SBL than in the SUV for a lipid dye transition dipole oriented parallel to the membrane29,40 (such as that of DiI or DiD41-43). A SUV doped with such a fluorophore appears dim when it docks onto the SBL (Figure 7, Representative Results). As a fusion pore opens and connects the SUV and SBL membranes, fluorescent probes diffuse into the SBL and become more likely to be excited by the s-polarized evanescent field25,27,29. Consequently, the fluorescence signal integrated around the fusion site increases sharply during dye transfer from the SUV into the SBL27 (Figure 3 and Figure 7). An additional factor that contributes to signal changes that accompany fusion is dequenching of fluorescent labels as they are diluted when transferred into the SBL. The contribution of dequenching is usually minor compared to evanescent field decay and polarization effects in the assay described here, because only a small fraction ( ) of the lipids are labeled.
The signal increase upon fusion can be exploited to deduce fusion pore properties by comparing the time,  , required for a lipid to escape through a pore that is freely permeable to lipids to the actual release time,
  . If the two time scales are comparable, it would be concluded that the pore presents little resistance to lipid flow. However, if the actual release time is significantly longer than the time for diffusion-limited release, this would indicate a process, such as pore flickering, retarding lipid release. The diffusion-limited release time, , depends on the size of the fusing liposome and lipid-diffusivity; its estimation requires these two parameters to be quantified. The single molecule sensitivity of the assay allows lipid diffusivity to be measured by tracking several single lipid fluorophores after their release into the SBL for every fusion event26. The size of every fusing vesicle can be estimated27 by combining (i) the intensity of a single lipid dye, (ii) the change in the total fluorescence around a docking site after all fluorophores are transferred into the SBL upon fusion, (iii) the known labeling density of SUV lipids, and (iv) the area per lipid. For many fusion events, the actual lipid release times were found to be much slower than expected by diffusion-controlled release27, as was noted previously assuming uniform SUV size44. Assuming retardation of lipid release is due to pore flickering, a quantitative model allows estimation of "pore openness", the fraction of time the pore remains open during fusion27.
Whenever practical, it is important to test fusion mechanisms using both lipid and soluble contents labels. For example, lipid release could be retarded by processes other than pore flickering, such as restriction of lipid diffusion by the SNARE proteins that surround the pore. If this were the case, then release of contents would precede release of lipid labels, provided the pore is large enough to allow passage of soluble probes. A more fundamental flaw in the approach could be in the assumption that the transfer of labeled lipids to the SBL occurs through a narrow fusion pore connecting the SBL to a vesicle that has largely retained its pre-fusion shape. Lipid transfer into the SBL could also result from rapid dilation of the fusion pore with a concomitant, extremely rapid collapse of the SUV into the SBL membrane, as previously suggested based on lipid release data alone29. Monitoring both lipid and contents release simultaneously, it was found that many pores resealed after releasing all their lipid labels, but retained some of their soluble cargo27. This indicates that at least some liposomes do not collapse into the SBL after fusion, and that the lipid dye transfer into the SBL occurs through a fusion pore. In addition, lipid and contents release occurred simultaneously27, making it unlikely that retardation of lipid release was due to hindrance of lipid diffusion by the SNARE proteins surrounding the pore45.
A SUV-SBL fusion protocol that did not monitor soluble contents release was previously published by Karatekin and Rothman25. Here, more recent developments are included, namely simultaneous monitoring of lipid and contents release and estimation of SUV, lipid, and fusion pore properties27. The protocol starts with instructions for preparing the microfluidic cells, made by bonding a poly(dimethyl siloxane) (PDMS) elastomer block containing grooves with a glass coverslip25. Next, preparation of v-SUVs with both lipid and contents markers is explained. Sections 4 and 5 provide instructions for assembling the microfluidic cells, forming the SBLs in situ and checking for defects and fluidity, introduction of v-SUVs into the flow cells and detection of fusion events. Section 6 provides instructions for data analysis.
Protocol
1. Preparation of a PDMS Block to Form the Microfluidic Channel

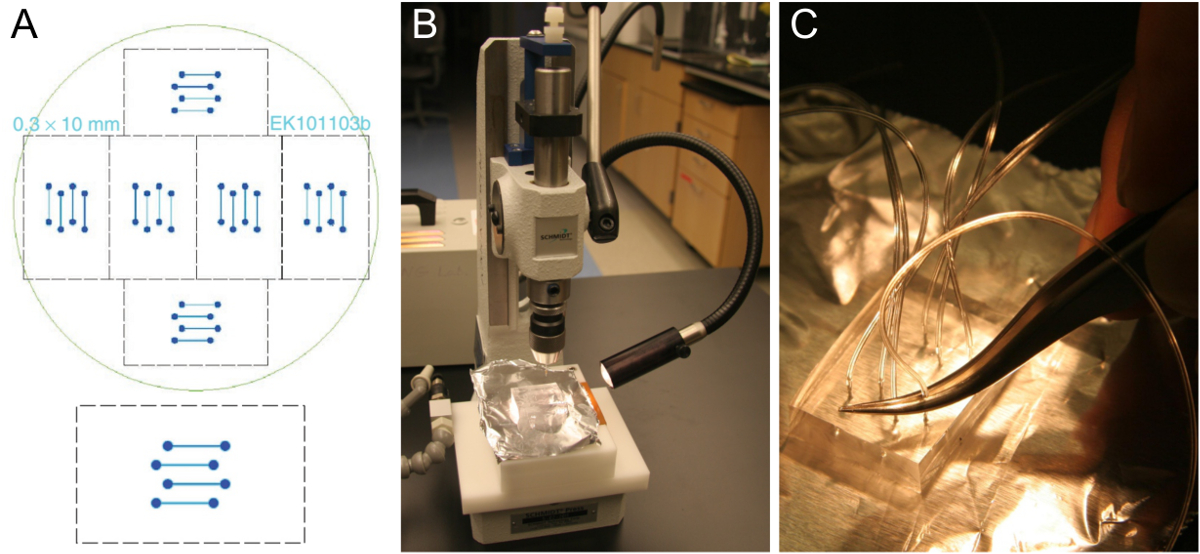
Figure 1. Microfabrication of flow cell template and PDMS block preparation. (A) Design of a four-channel flow cell that fits onto a 24 x 60 mm glass coverslip (bottom). Six identical designs are arranged to fit onto a 10 cm silicon wafer (top). (B) Cut out block of approximately 5-8 mm thick PDMS on a hole puncher. (C) Insertion of tubing into the punched hole using a pair of tweezers. Please click here to view a larger version of this figure.
- Obtain a flow cell template such as the one in Figure 1A. Typical channels are 0.3-1 mm wide, 70-100 µm high, and 1-2 cm long. Fabricate a template using standard photolithography techniques in a cleanroom facility25 or order if cleanroom access is not available. Alternatively, machine a template with larger dimensions from a suitable material.
Note: Cleanroom staff can train and guide unexperienced users (access to a cleanroom facility is always restricted to users with proper training) in the design and ordering of a mask, wafer cleaning, and photolithography. Once a template is obtained, it can be used outside the cleanroom repeatedly, provided it is kept in a closed dish and care is taken to exclude dust. - Prepare a mixture of ~100 ml PDMS (silicone elastomer base) and ~10 ml of cross-linker (curing agent) in a disposable plastic cup. Break off the tip of a disposable pipette to handle the viscous PDMS more easily. Weigh the PDMS into the plastic cup as pipetting is not accurate.
- Stir the mixture well. Remove the many air bubbles by degassing in a vacuum desiccator (about 20 min). As the cup is placed under vacuum, the bubbles will initially grow in size, increasing the volume of the mixture greatly. Control the vacuum that is applied and make sure the cup is deep enough to avoid a spill.
- Pour a large drop of the degassed PDMS mixture into a glass Petri dish (150 mm x 20 mm) and press the wafer onto the PDMS with the template facing up. This avoids bubbles being trapped beneath the wafer. Trapped bubbles will expand and may tilt the wafer when the dish is placed in the oven. Now pour degassed PDMS onto the template on top of the wafer until it is covered by about 5-8 mm of PMDS. If an air bubble occurs gently remove it with a pipette tip.
- Bake the PMDS in an oven at 60 °C for 3 hr. Ensure that the dish is level.
- Use a new scalpel blade to cut out a PDMS block containing the molded channel structures. The cut out block needs to fit onto a coverslip (see step 4.1.9).
- Peel out the cut out block from the dish and place it onto a piece of clean aluminum foil.
Note: The cross-linked PMDS blocks can be kept for a few months. On a single wafer, there are 6 sets of flow channels (Figure 1A), so 6 PDMS blocks can be produced in a single PDMS molding. After cutting out all 6 of the PDMS blocks, clean loose pieces of PDMS, but otherwise do not remove the remaining PDMS before pouring and cross-linking the next batch, which will require only about half the PDMS used for the first batch. A good template can last a few years. - Use a hole puncher to drill through the PDMS block in one straight motion (Figure 1B). Start on the side of the channel grooves. Be sure to remove the punched out piece of PDMS. Repeat this for all eight holes of the four channel design.
- Place the PDMS block channel side down onto a new and wrinkle-free piece of aluminum foil. Store the block for up to a few months in a dry box, ideally in a desiccator.
- Push the tubing (0.25 mm ID, 0.76 mm OD) about one-third into the punched hole using a pair of tweezers (Figure 1C). Cut the tubing slanted for easier insertion. Leave tubes long enough to reach the SUV reservoir and the syringe pump, respectively. After placing the assembled chip onto the microscope, cut the tubes again if they are too long.
- To connect to the syringes of the pump, cut a short piece of larger silicone tubing (0.51 mm ID, 2.1 mm OD) and insert the thinner tube into one side. This ready-to-use block of PDMS can be kept for a few months.
2. Coverslip Cleaning
- Clean coverslips according to the protocol described in Karatekin and Rothman25 using a strong oxidizing mixture of sulfuric acid (H2SO4) and hydrogen peroxide (H2O2). Perform this procedure in a cleanroom, and observe proper safety precautions. Alternatively, use a cleanroom cleaned coverslip that is commercially available (see Materials List).
3. Preparation of v-SUVS Containing Both Lipid and Content Labels

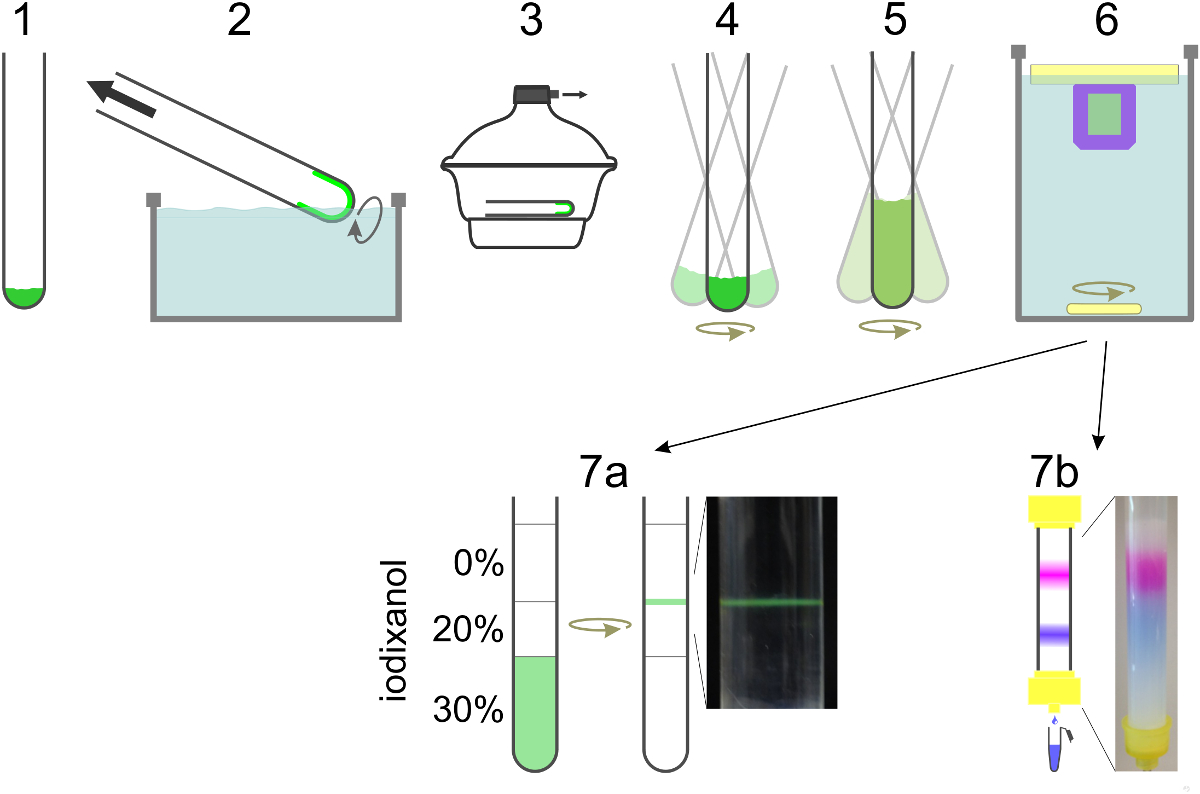
Figure 2. Schematic of SUV preparation. Lipids are mixed in a glass tube (1) and solvent is evaporated to form a lipid film by rotating the tube in a water bath (2). Remaining traces of solvent are removed under high vacuum (3). The lipid film is hydrated in reconstitution buffer containing detergent and protein while vortexed (4). If contents dye is to be encapsulated, it is included in this step as well as in the dilution step (5). Dilution of the detergent concentration below its critical micelle concentration leads to liposome formation. Detergent is dialyzed away overnight (6). For t-SUVs for SBL formation including NBD-PE (green), vesicles are floated in a density gradient and collected at the interface between two layers (7a). To separate v-SUVs with encapsulated content marker from free dye the sample is run over a size-exclusion column and collected in 0.5 ml fractions (7b). Please click here to view a larger version of this figure.
- Prepare 4 L of reconstitution buffer, containing 25 mM HEPES-KOH, 140 mM KCl, 100 µM EGTA and 1 mM DTT, pH 7.4. Use most of the buffer for dialysis and 100 ml for other steps.
Note: Other buffers may be used, but it is important to keep the buffer osmolarity consistent throughout the experiment and choose conditions in which the proteins are functional. For preparing v-SUVs containing lipid labels only and t-SUVs, follow Karatekin and Rothman25. - As lipid stocks are stored at -20 °C in chloroform or chloroform:methanol (2:1, v/v), let vials reach room temperature before opening to avoid condensation.
- Rinse a glass tube with chloroform to remove trace amounts of detergent and mix the lipids at the desired ratio with a final amount of 1 µmol in a mixture of chloroform and methanol (2:1, v/v). Only use glass syringes/tubes to handle organic solvents/dissolved lipids.
Note: The lipids used here are POPC:SAPE:DOPS:Cholesterol:PEG2000-DOPE:DiD at a molar ratio of 57.4:15:12:10:4.6:1 for v-SNARE containing vesicles and POPC:SAPE:DOPS:Cholesterol:brain PI(4,5)P2:PEG2000-DOPE:NBD-PE (54.9:15:12:10:3:4.6:0.5) for t-SNARE SUVs. See Material for details. Other lipid compositions can be used. - Evaporate the solvent under a gentle stream of nitrogen, or in a rotary evaporator. Immerse the tip of the tube in a water bath (37 °C) heated above the highest melting temperature of the lipids to yield a homogenous lipid film and to avoid large changes in temperature while evaporating the solvent. Start vacuum at around 300 mbar until the lipid film is formed, then continue for ~2 min at highest possible vacuum in the rotary evaporator.
- Remove the glass tube and wrap it in aluminum foil to avoid light exposure and remove remaining traces of solvent by placing the tube in a desiccator under high vacuum for at least 2 hr. This step can also run overnight.
- To rehydrate the dried lipid film, prepare a mixture of detergent (n-Octyl-β-D-glucopyranoside, OG), protein (v-SNAREs), and SRB in reconstitution buffer (500 µl final volume). Keep the final detergent concentration ~2 times above the critical micelle concentration (CMC, 20-25 mM for OG) and adjust the final volume such that the detergent to lipid ratio is >10. Dissolve Sulforhodamine B (SRB) powder in the protein-detergent solution to obtain a final concentration of 10-50 mM SRB by gently shaking the solution. Adjust the osmolarity of the reconstitution buffer when adding high concentrations of SRB by reducing the concentration of potassium chloride accordingly.
Note: Lipid-to-protein ratio (LP) for t-SNAREs is high (LP ~20,000, ~70 t-SNAREs per sq. micron25). Significantly higher t-SNARE densities in the SBL may lead to inactive protein aggregates with significantly reduced the fusion rates17,24. LP for v-SNAREs is much lower (LP ~200, ~7,000 v-SNAREs per µm2), close to the v-SNARE densities found on synaptic vesicles46,47. To ensure protein function after recombinant expression and purification of v- and t-SNAREs it is useful to perform a simple bulk fusion assay48 before going through all the steps of the single vesicle fusion assay. - Gently shake the pre-warmed glass tube containing the dried lipid film while adding the protein-detergent-SRB solution from step 3.6. Try to avoid creating bubbles. Continue to shake for 15 min at 37 °C.
- Dilute the detergent fivefold by adding reconstitution buffer containing SRB (add 2 ml, 2.5 ml final volume) while rapidly vortexing to avoid concentration gradients. Continue to shake for 15 min to 1 hr at 37 °C.
Note: Longer incubation increase protein reconstitution efficiency. The rapid dilution decreases the detergent concentration below the CMC and leads to the formation of small liposomes. - Dialyze the vesicle suspension first against ~1 L of reconstitution buffer for 1-2 hr at ambient temperature and then against 3 L of reconstitution buffer overnight at 4 °C with 4 g of polystyrene adsorbent, using a 20,000 MWCO dialysis tube or cassette. Use different beakers for dialysis of vesicles with and without SRB to prevent cross contamination.
- Equilibrate a gel filtration column with reconstitution buffer. Run the vesicle suspension through the column to separate free SRB from the v-SUVs with encapsulated SRB. Use reconstitution buffer without SRB as eluent once the entire sample has entered the column. Collect v-SUVs in 0.5 ml fractions.
- Verify successful SRB encapsulation at self-quenched concentrations by measuring SRB fluorescence before and after addition of detergent to an aliquot of vesicles16. Using a fluorescence spectrometer, excite the sample at 550 nm and scan the SRB emission between 570 nm and 630 nm. Expect a 4-8 fold increase in SRB fluorescence depending on the encapsulated amount upon detergent addition as the membrane is solubilized and the released SRB is diluted.
- Characterize the lipid and protein recovery using fluorescence spectroscopy24 and SDS-PAGE gel electrophoresis, respectively. Use a sensitive staining method, especially for the high LP t-SUV samples (see Materials List). Typically about 50% of both lipid and protein input is lost during the preparation resulting in a LP close to the nominal value.
- Characterize SUV sizes using dynamic light scattering24 or electron microscopy48. Store SRB containing v-SUVs at 4 °C up to ~3-4 days. Do not freeze, as freezing and thawing breaks the membrane and releases encapsulated SRB.
4. SUV-SBL Fusion Assay to Monitor Lipid Release Only
- Formation of the tethered supported bilayer within the microfluidic flow channels
- Place the PDMS block (step 1.11) under high vacuum for at least 20 min prior to the experiment to remove dissolved gasses. This greatly reduces the risk of air bubbles in the microfluidic channels during the fusion experiment.
- Turn on the microscope setup and heat the stage and sample holder (Figures 3 and 4) to the desired temperature.
- Filter the reconstitution buffer used to dilute the vesicles through a filter with 0.45 µm or smaller pore size.
- Dilute ~30 µl of the NBD-PE labeled t-SUVs or protein-free (pf-SUVs) control liposomes (stock solution 0.5-1 mM lipid) with ~60 µl of buffer. The final concentration is not critical here.
- Degas this mixture using a 3 ml syringe. Press out most of the air above the sample while holding the syringe vertically. Seal the (needle free) tip using paraffin film and create a vacuum by pulling down the plunger. Tap the syringe barrel to accelerate degassing of the solution. Repeat this process a few times until no more bubbles occur when vacuum is applied.
- Use a hypodermic needle with a diameter slightly larger than the tubing that is attached to the PDMS block to punch a hole in the cap of a microcentrifuge tube. Make sure that the punched out piece of plastic is not inside the tube as it might clog the tubing connected to the microfluidic channel inlet later.
- Fill the degassed SUV solution into the microcentrifuge tube having a hole in the cap and place it into the holder on the microscope stage to equilibrate to the set temperature.
- Place a previously cleaned coverslip (section 2) in a plasma cleaner and run air plasma for about 5 min. Put the plasma treated coverslip (treated side facing up) on top of a few lint-free tissues serving as a cushion.
- Remove the aluminum foil from the degassed PDMS block and place the block on top of the coverslip. When reusing the PDMS block put on and detach a piece of adhesive tape to the channel side to clean it. Press down the PDMS block onto the coverslip using a pair of tweezers to make it stick, but do not press too hard as the glass might break.
- Place the assembled flow cell onto the microscope stage and connect the tubing to the SUV reservoir and the syringe pump, respectively. Tape the coverslip to the stage (Figure 3B).
- Start aspirating SUVs at 3 µl/min until the solution fills the channels completely (~2.25 mm/sec for the 75 µm x 300 µm channel cross-section). When solutions for all channels start moving up the tubing on the exit side, reduce flow to 0.5 µl/min and incubate for 30-45 min.
Note: The time between plasma treating the glass slide and flowing the SUVs into the channel should not exceed 10-20 min as the effect of the plasma treatment is transient. - Check the channels for any leak. Use a 10-20X air objective to observe NBD-PE fluorescence from the NBD-PE containing t- or pf-SUVs. Excite NBD fluorophores using the 488 nm laser. Leaks are difficult to detect using bright field illumination.
- Put a tube with degassed reconstitution buffer into the holder and let the temperature equilibrate as fast changes in temperature might cause defects in the SBL. Stop the flow and wait ~1 min to make sure the flow has stopped completely and no air bubble will be aspirated into the tube before switching the inlet tubes to the degassed buffer.
- Rinse all channels with degassed buffer to wash away unbound SUVs.
- Switch to a higher magnification TIRF objective (60X, oil, NA 1.45-1.49) and verify that the bilayer looks homogeneous and is free of any obvious large-scale defects such as dark patches or lipid tubules extending out from the SBL.
- Check the fluidity of the bilayer
- If a dedicated FRAP unit is not available, or if a FRAP sequence cannot be programmed, then qualitatively test membrane fluidity as follows.
- Close the field diaphragm to a small size (~40 µm diameter) and adjust the 488 nm excitation light intensity through the software (20-80 µW, or 15-60 nW/µm2) to bleach the NBD-PE fluorescence in the exposed area significantly, but not completely. For a fluid bilayer, at steady state, the fluorescence intensity in the middle of the exposed area should be lower than at the edges, as intact NBD-PE molecules enter the exposed area and diffuse a certain distance before bleaching. In contrast, if the surface-adhered SUVs failed to burst, or for some other reason the supported bilayer is not fluid, all fluorophores in the exposed area should bleach.
Note: Laser intensity values in this and later steps are given as a rough starting point and should be optimized for a given set of conditions. - Stop the illumination and start it again a few minutes later to verify the results of the steady state measurements
- Close the field diaphragm to a small size (~40 µm diameter) and adjust the 488 nm excitation light intensity through the software (20-80 µW, or 15-60 nW/µm2) to bleach the NBD-PE fluorescence in the exposed area significantly, but not completely. For a fluid bilayer, at steady state, the fluorescence intensity in the middle of the exposed area should be lower than at the edges, as intact NBD-PE molecules enter the exposed area and diffuse a certain distance before bleaching. In contrast, if the surface-adhered SUVs failed to burst, or for some other reason the supported bilayer is not fluid, all fluorophores in the exposed area should bleach.
- Program a FRAP sequence for a more quantitative measurement, if possible. See supplemental files and the corresponding legend for details.
Note: Sometimes SUVs will adhere onto the glass coverslip, but fail to burst and form a fluid bilayer. If this occurs, rinse the channels with degassed reconstitution buffer containing 10 mM Mg2+ to help supported bilayer formation. Use fluorescence bleaching to assess bilayer fluidity as in 4.2. Once a fluid bilayer is formed, rinse with Mg2+-free reconstitution buffer.
- If a dedicated FRAP unit is not available, or if a FRAP sequence cannot be programmed, then qualitatively test membrane fluidity as follows.
- Introducing v-SUVs into the microfluidic flow channels
- Degas reconstitution buffer and use it to dilute the v-SUV stock solution by a factor of about 103 to 105 depending on the v-SUV stock concentration. Aim for a dilution that results in about 10-100 fusion events within 60 sec in the field of view.
Note: Too many fusions increase the background fluorescence (since each event deposits LR-PE or DiD lipid labels into the SBL) and make detection and analysis of fusion events difficult. In contrast, a fusion rate that is too low results in poor statistics¸ or requires acquisition of many more movies. For a v-SUV concentration of 0.1 mM lipid, start by diluting 5 µl SUV stock in 995 µl reconstitution buffer and then dilute 5-50 µl of this in 950-995 µl reconstitution buffer. - Let temperature equilibrate before stopping the flow and inserting the inlet tube into the diluted v-SUV solution.
- Adjust the TIRF angle and polarization as follows.
- After setting the desired polarization by rotating the excitation beam, adjust the tilt of the mirror commanding the position of the beam via a stepper motor through the software. Slowly move the position of the laser beam from the center of the objective at the back focal plane to one side off-center. Observe the light from the objective at the front side emerge with an increasing angle with respect to the objective axis as the position is moved further off-center.
- Note the motor position when the exiting beam first disappears into the objective, i.e., when TIR is first achieved.
- Slowly keep moving the beam position further off-center while monitoring the fluorescence from the surface. Note the motor position when the surface fluorescence disappears when the beam has moved too far off-center.
- Choose a beam position between the two limits determined above. For best signal-to-noise ratio and more signal enhancement upon fusion, choose a shallow penetration depth (beam position closer to the edge of the objective) that still provides uniform illumination of the viewfield.
Note: It is best to keep the same TIR beam position (same penetration depth) for all experiments after settings are optimized. Make sure rotating the polarization does not result in changes in beam position.
- Flow v-SUVs into the channel at a flow rate of 2 µl/min, corresponding to an average linear flow velocity of ~1.5 mm/sec for a cross section of 75 µm x 300 µm. Switch to the excitation/emission settings to monitor lipid mixing (LR or DiD only).
- Degas reconstitution buffer and use it to dilute the v-SUV stock solution by a factor of about 103 to 105 depending on the v-SUV stock concentration. Aim for a dilution that results in about 10-100 fusion events within 60 sec in the field of view.
- Observing fusion between single v-SUVs and the SBL

Figure 3. The experimental pTIRF setup. (A) Schematic representation of a v-SUV and a t-SBL on a glass substrate. False-color TIRFM images of single SUV-SBL fusion event showing lipid docking (1) and release of lipid dye into the SBL (2) followed by bleaching and decrease of the fluorescence intensity (3). The total fluorescence intensity (sum of pixel values in the 5.3 µm x 5.3 µm box) signal is shown. (B) The coverslip bonded to the PDMS block is taped onto the heated stage. Inlet tube for microfluidic channels draw samples from tube in metal sample holder (right) aspirated by the syringe pump (left). Beneath the pump is the dual emission unit. Please click here to view a larger version of this figure.

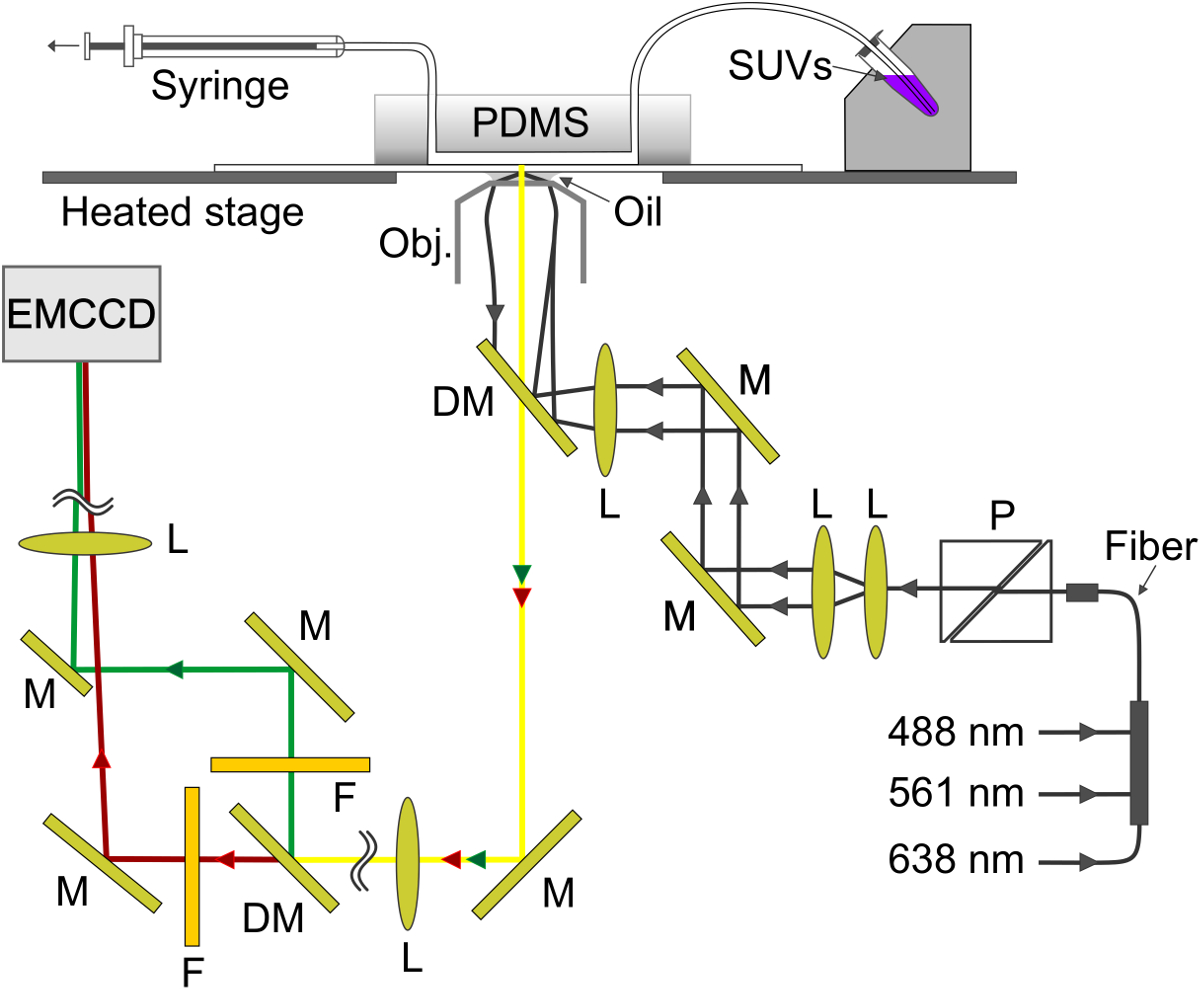
Figure 4. Schematic of the experimental setup. The evanescent wave is created at the glass-buffer interface in the microfluidic channel. The SBL is formed on the glass and v-SUV are aspirated from the metal sample holder (top right) through the channel into the syringe (top left). M, mirror; DM, dichroic mirror; L, lens; F, filter; P, polarizer. Please click here to view a larger version of this figure.
- Continuously excite and monitor v-SUV fluorescence using a 561 nm (for LR-PE) or 638 nm (for DiD) laser depending on the fluorophore incorporated in v-SUVs. As v-SUVs reach the flow channel and dock onto and fuse with the SBL, the background fluorescence signal starts to accumulate.
- Adjust the excitation laser intensity through the software to continuously bleach the background fluorescence such that at steady state new docking and fusion events can readily be observed.
Note: If bleaching is too slow, background fluorescence will be too high. If bleaching is too fast, signals from docked SUVs and from fluorophores released into the SBL will fade rapidly, shortening the window during which fusion of docked SUVs can be detected or a fluorophore can be tracked. For LR-PE excited at 561 nm, 2.5-7.5 mW power illuminating a 190 µm diameter circle (100-250 nW/µm2) is a reasonable value to start. For 638 nm excitation of DiD, 0.8-1.6 mW power over a 190 µm diameter circle (30-60 nW/µm2) can be used for initial tests. - Acquire several movies at different positions in a given channel. Check NBD-PE fluorescence to verify that the SBL does not have defects at these positions. Acquire full-frame movies at the maximum rate (~50 frames/sec) or a cropped region of interest at higher frame rate (up to ~100 Hz) for 60 sec.
- Move to another microfluidic channel and repeat the recordings for other conditions. Include negative controls such as a protein-free SBL or SUVs, add the soluble cytoplasmic domain of the v-SNARE VAMP2 (CDV) as an inhibitor or treat v-SUV with tetanus neurotoxin (30 min at 37 °C) in one or more of the channels on the same coverslip.
- Clean up and PDMS recycling
- In order to reuse the PDMS block, rinse the microfluidic channels with ~200 µl of 70% ethanol at a flow rate of 5 µl/min. Finally, aspirate air through the tubing and channels.
- Detach the PDMS block gently from the coverslip by squeezing it slightly. Place it on a clean piece of aluminum foil. Store in a vacuum desiccator. It can be reused several times.
- For a more thorough cleaning rinse the channels with a detergent or sodium hydroxide solution prior to 70% ethanol. Alternatively, remove all tubes from the PDMS and sonicate the block for 30 min in isopropanol, before drying and inserting new tubing.
5. SUV-SBL Fusion Assay to Monitor Lipid and Content Release Simultaneously
- For dual color monitoring of simultaneous lipid and soluble contents release, follow the same steps as in section 4, except use liposomes labeled with both a lipid (DiD) and a soluble contents (SRB) label, as explained in section 3. SRB is encapsulated at 10 mM and is initially highly self-quenched.
- Using the configuration shown schematically in Figure 4, excite SRB and DiD fluorescence simultaneously using 561 nm and 638 nm lasers, respectively. A dichroic mirror (640 nm) splits the emission into two beams that run through a short (595/50 nm) and a long (700/75 nm) wavelength filter to detect the SRB and DiD emissions, respectively. The two emission beams are projected side-by-side onto the EM-CCD chip.
6. Data Analysis
- Analysis of FRAP data
- Use the MATLAB program provided in the Supplementary Information to estimate the lipid diffusion coefficient, D. The program reads a list of OME-TIFF files49, detects the bleached area, plots the mean pixel values in the bleached area as a function of time, and fits the resulting recovery curve to a model by Soumpasis50 to extract the recovery time,
 , where w is the radius of the bleached circle.
Note: A MATLAB program was provided earlier25 for analysis of FRAP movies using Nikon ND2 files. The current program reads OME-TIFF files49, because most file formats can readily be converted to OME-TIFF. A quantitative analysis of FRAP data is easiest and most accurate when bleaching is instantaneous, the bleached region is a circle, and bleaching during read-out is negligible. Although these criteria are not strictly satisfied in the simple FRAP measurements described here, a reasonable estimate of the diffusion coefficient can be obtained. For a more accurate estimate, use tracking of single lipid dyes (section 6.3).
- Use the MATLAB program provided in the Supplementary Information to estimate the lipid diffusion coefficient, D. The program reads a list of OME-TIFF files49, detects the bleached area, plots the mean pixel values in the bleached area as a function of time, and fits the resulting recovery curve to a model by Soumpasis50 to extract the recovery time,
- Analysis of docking rate, fusion rate and docking-to-fusion delay times
- Use ImageJ to open a movie to analyze and adjust brightness and contrast to clearly identify vesicle docking and fusing events. Start the SpeckleTrackerJ26 plugin. See Smith et al.26 and online documentation for SpeckleTrackerJ for instructions for usage.
- Identify all newly docked SUVs in SpeckleTrackerJ. To distinguish SUVs that dock tightly from those that bounce off the SBL, impose a minimum docking duration of a few frames. Save the tracks, and repeat for all movies.
Note: For the docking rate, all that matters is to identify when a SUV docked, so only the first frame in which the SUVs docked needs to be recorded in these tracks. The rest of the tracks will not be taken into account in the analysis. However, auto-tracking each SUV until it bleaches or fuses helps mark SUVs that have already been tracked. - Identify all fusing vesicles. For these, the tracks should include all frames from the first frame a SUV docked until the first frame in which fusion is evident by a sudden increase in the fluorescence of the tracked spot. The durations of these tracks are used to calculate the docking-to-fusion delays. Save all tracks. Repeat for all movies.
- For batch analysis of docking or fusion data, compile a list of trajectory files from the relevant movies and run the MATLAB programs provided with Karatekin and Rothman25. Follow instructions that are provided together with the programs.
Note: The programs plot the cumulative docking and fusion events as a function of time, based on information extracted from the trajectory files. Docking and fusion rates are estimated from the slopes of these plots. For fusion data, the docking-to-fusion delays are also calculated and their distribution plotted as a survival plot, i.e., the probability that fusion has not yet occurred by a given delay after docking.
- Lipid diffusivity
- For each fusion event, track single fluorescent lipids as they become discernible when they have diffused sufficiently away from the fusion site (Figure 6). Use SpeckleTrackerJ for tracking, and save the tracks for further analysis using MATLAB. Depending on the size of the fusing vesicle, typically 3-30 single fluorophores can be tracked. Because longer tracks are desirable for the calculation of
 , try to track single molecules as long as possible, using manual correction of trajectories if necessary.
 - Calculate the mean squared displacement (MSD) for single lipid marker trajectories that last > 40-50 frames (about ~1.5 sec). Use the MSD to calculate the lipid diffusion coefficient, . See Smith et al.26 and Stratton et al.27 for details.
- For each fusion event, track single fluorescent lipids as they become discernible when they have diffused sufficiently away from the fusion site (Figure 6). Use SpeckleTrackerJ for tracking, and save the tracks for further analysis using MATLAB. Depending on the size of the fusing vesicle, typically 3-30 single fluorophores can be tracked. Because longer tracks are desirable for the calculation of
- Single lipid dye intensity, SUV-SBL intensity reduction factor, and vesicle size
- Measure the sum of pixel values of a lipid marker in a 3 x 3 pixel (0.8 µm x 0.8 µm) area around the marker for ~15 frames before and after the marker bleaches in a single step. Subtract the background intensity averaged over the post-bleach frames from the pre-bleach intensity averaged before bleaching to obtain the intensity of the tracked lipid marker. Repeat the measurement for as many markers as practical for a given movie.
- Plot the distribution of single lipid label intensities,
 , and fit a Gaussian to estimate the mean.
 - Calculate the delay between when fusion occurred and when the trajectory of a single lipid marker released in that event ended in a single-step bleaching. Obtain the bleaching time for a fluorophore in the SBL,
 , by plotting the survivor function of the delays and fitting to an exponential.
Note: Because the polarized excitation field couples more weakly to the fluorophores on a SUV, the bleaching time of a SUV is usually much slower27. - Estimate
 , the intensity reduction factor for a lipid dye when in the SUV relative to when it is in the SBL, following Stratton27 ( is the intensity of a single dye in the SUV).
Note: If bleaching were negligible, would be equal to the docked intensity  (point (1) in Figure 3A, right panel), divided by the total intensity reached after all fluorophores are deposited into the SBL upon fusion (dashed line labeled
  in Figure 3). However, due to rapid bleaching in the SBL, is typically not reached and an accurate estimate of requires fitting the release kinetics to an expression27 that includes both (see 6.4.3) and . Separate expressions are provided in Stratton et al.27 for the cases of pore-limited and diffusion limited release kinetics; the best fit case varies from event to event (see 6.5.1 for the case of pore-limited kinetics).
 - Calculate the vesicle area for individual events from27
 , where is the docked SUV intensity, is the mean intensity of a single lipid dye in the SBL, is the intensity reduction factor for a lipid dye when it is in the SUV relative to when it is in the SBL, and
  is the known areal density of lipid dyes.
- Fusion pore properties
- Assuming release is pore-limited, fit the lipid label release kinetics to 27
 , where
  is the docked SUV intensity just before fusion and the other parameters are as defined earlier. Use the value of obtained in 6.4.3 as a fixed parameter, and extract the best fit estimates for and
  .
. - Estimate the fraction of time the pore is open, P0, assuming retardation of lipid release is due to pore flickering27:
 =
=  , where Aves is the vesicle area (section 6.4.5), b is the pore height (typically taken to be ~15 nm), rp ≈ 3 nm is the effective pore radius as seen by the diffusing lipid labels and includes half the bilayer thickness (~2 nm), is the lipid diffusivity (calculated in 6.3), and is the time for the lipids to be released from the SUV into the SBL (from 6.5.1).
 - To confirm that a nominal P0 > 1 indicates a fully open pore, P0 = 1, fit the intensity time course to equation 4 of Stratton et al.27, the predicted kinetics for a permanently open pore. This fit should be better than fitting the expression in 6.5.1 for a permanently open pore.
- Assuming release is pore-limited, fit the lipid label release kinetics to 27
Results
SBL Quality
It is crucial to verify the quality and fluidity of the SBL prior to the fusion experiment. The fluorescence at the bottom, glass side of a microfluidic channel should be uniform, without any obvious defects. If an air bubble passes though the channel, it usually leaves visible scars on the SBL. If there are such large scale scars/defects, do not use that channel. Sometimes SUVs may adhere onto the s...
Discussion
Successful implementation of the SUV-SBL fusion assay described here depends critically on several key steps, such as functional reconstitution of proteins into liposomes, obtaining good quality SBLs, and choosing the right imaging parameters to detect single molecules. Although it may take some time and effort to succeed, once the assay is implemented successfully, it provides a wealth of information about the fusion process not available from any other in vitro fusion assay discussed in Introduction. The rates...
Disclosures
The authors declare that they have no competing financial interests.
Acknowledgements
We thank Vladimir Polejaev (Yale West Campus Imaging Core) for the design and construction of the polarized TIRF microscope, David Baddeley (Yale University) for help with two-color detection instrumentation, and James E. Rothman (Yale University) and Ben O'Shaughnessy (Columbia University) and members of their groups for stimulating discussions. EK is supported by a Kavli Neuroscience Scholar Award from the Kavli Foundation and NIH grant 1R01GM108954.
Materials
| Name | Company | Catalog Number | Comments | |
| Reagents | ||||
| Milli-Q (MQ) water | Millipore | |||
| KOH | J.T. Baker | 3040-05 | ||
| Ethanol 190 Proof | Decon | |||
| Isopropanol | Fisher Chemical | A416P4 | ||
| HEPES | AmericanBio | AB00892 | ||
| Sodium Cholride (KCl) | AB01915 | |||
| Dithiothreitol | AB00490 | |||
| N-[2-hydroxyethyl] piperazine-N'-[2-ethanesulfonic acid] (HEPES) | AmericanBio | AB00892 | ||
| EGTA | Acros Organics | 409911000 | ||
| Buffers | ||||
| HEPES-KOH buffer (pH 7.4) | 25 mM HEPES-KOH, 140 mM KCl, 100 μM EGTA, 1 mM DTT | |||
| Solvents | ||||
| Chloroform | J.T. Baker | 9180-01 | in glass bottle, CAUTION, wear PPE | |
| Methanol | J.T. Baker | 9070-03 | in glass bottle, CAUTION, wear PPE | |
| Liposome preparation | ||||
| Gastight Hamilton syringe | Hamilton | var. sizes | only use glass sringe with solents (Chlorophorm/ Methanon, 2:1, v/v) | http://www.hamiltoncompany.com |
| Glass tubes Pyrex Vista 11 ml, 16x100 mm screw cap culture tube | Pyrex | 70825-16 | clean thoroughly, rinse with chloroform | http://catalog2.corning.com/LifeSciences/ |
| 1-palmitoyl-2-oleoyl-sn-glycero-3-phosphocholine, 16:0-18:1 PC (POPC) | Avanti Polar Lipids | 850457 | Lipids come dissolved in CHCl3 or as lyphilized powder in sealed vials. Aliquot upon opening. Store extra as dried lipid films under inert atmosphere at -20 °C. Keep stocks in CHCl3/MeOH (2:1, v/v) at -20 °C. let come to RT before opening | http://www.avantilipids.com/ |
| 1,2-dioleoyl-sn-glycero-3-phospho-L-serine (sodium salt), 18:1 PS (DOPS) | 840035 | |||
| 1-stearoyl-2-arachidonoyl-sn-glycero-3-phosphoethanolamine, 18:0-20:4 PE (SAPE) | 850804 | |||
| L-α-phosphatidylinositol-4,5-bisphosphate (Brain, Porcine) (ammonium salt), Brain PI(4,5)P2 | 840046 | |||
| 1,2-dioleoyl-sn-glycero-3-phosphoethanolamine-N-(7-nitro-2-1,3-benzoxadiazol-4-yl) (ammonium salt), 18:1 NBD PE | 810145 | |||
| 1,2-dioleoyl-sn-glycero-3-phosphoethanolamine-N-[methoxy(polyethylene glycol)-2000] (ammonium salt), 18:1 PEG2000 PE | 880130 | |||
| cholesterol (ovine wool, >98%) | 700000 | |||
| DiD' oil; DiIC18(5) oil (1,1'-Dioctadecyl-3,3,3',3'-Tetramethylindodicarbocyanine Perchlorate) | Molecular Probes | D-307 | https://www.thermofisher.com/ | |
| Rotavapor R-210 | Buchi | R-210 | heat bath above Tm of lipids used | http://www.buchi.com/ |
| OG n-Octyl-β-D-Glucopyranoside | Affymetrix | 0311 | store at -20°C, let come to RT before opening | https://www.anatrace.com/ |
| Shaker - Eppendorf Thermomixer R | Eppendorf | https://www.eppendorf.com/ | ||
| Slide-A-Lyze Dialysis Cassettes, 20K MWCO, 3 mL | life technologies | 66003 | https://www.lifetechnologies.com/ | |
| Bio-Beads SM-2 Adsorbents | Bio-Rad | 1523920 | http://www.bio-rad.com/ | |
| OptiPrep Density Gradient Medium | Sigma-Aldrich | D1556 | http://www.sigmaaldrich.com/ | |
| Ultracentrifugation tube, Thinwall, Ultra-Clear, 13.2 mL, 14 x 89 mm | Beckman Coulter | 41121703 | https://www.beckmancoulter.com/ | |
| Beckman SW41 Ti rotor | ||||
| SuflorhodamineB | Molecular Probes | S-1307 | https://www.thermofisher.com/ | |
| Econo-Column Chromatography Columns, 2.5 × 10 cm | Bio-Rad | 7372512 | http://www.bio-rad.com/ | |
| Sepharose CL-4B | GE Healthcare | 17-0150-01 | http://www.gelifesciences.com/ | |
| SYPRO Orange Protein Gel Stain | Molecular Probes | S-6650 | 5,000X Concentrate in DMSO | https://www.lifetechnologies.com/ |
| PDMS block | ||||
| Sylgard 184 Silicone elastomer kit, PDMS | Dow Corning | 3097358-1004 | http://www.dowcorning.com/ | |
| Pyrex glass petri dish, 150 x 20 mm, complete with cover | Corning | 3160-152 | http://catalog2.corning.com/LifeSciences/ | |
| Hole puncher - Reusable Biopsy Punch, 0.75mm | World Precision Instruments | 504529 | http://www.wpi-europe.com/ | |
| Manual Hole Punching Machine | SYNEO | MHPM-UNV | http://www.syneoco.com/ | |
| Drill .035 x .026 x 1.5 304 SS TiN coated round punch | CR0350265N20R4 | drill diameter: 0.9 mm | ||
| Tygon Microbore tubing, 0.25 mm ID, 0.76 mm OD | Cole-Parmer | 06419-00 | 0.010" ID, 0.030" OD | http://www.coleparmer.com/ |
| Silicone Tubing (0.51 mm ID, 2.1 mm OD | 95802-00 | 0.020" ID, 0.083" OD | ||
| Cover glass - cleanroom cleaned | ||||
| Schott Nexterion cover slip glass D | Schott | 1472305 | http://www.us.schott.com/ | |
| plasma cleaner | Harrick | PDC-32G | http://harrickplasma.com/ | |
| pTIRF setup and accessories | ||||
| IX81 microscope body | Olympus | IX81 | http://www.olympus-lifescience.com/en/ | |
| EM CCD camera | Andor | ixon-ultra-897 | http://www.andor.com/ | |
| Thermo Plate, heated microscope stage | Tokai Hit | MATS-U52RA26 | http://www.tokaihit.com/ | |
| 1 ml hamilton glass syringes (4x) | Hamilton | 81365 | http://www.hamiltoncompany.com | |
| syringe pump | kd Scientific | KDS-230 | http://www.kdscientific.com/ |
References
- Sudhof, T. C., Rothman, J. E. Membrane fusion: grappling with SNARE and SM proteins. Science. 323, 474-477 (2009).
- Wickner, W., Schekman, R. Membrane fusion. Nat Struct Mol Biol. 15, 658-664 (2008).
- Harrison, S. C. Viral membrane fusion. Nat Struct Mol Biol. 15, 690-698 (2008).
- Jahn, R., Scheller, R. H. SNAREs--engines for membrane fusion. Nat Rev Mol Cell Biol. 7, 631-643 (2006).
- Lindau, M., Alvarez de Toledo, G. The fusion pore. Biochim Biophys Acta. 1641, 167-173 (2003).
- Staal, R. G., Mosharov, E. V., Sulzer, D. Dopamine neurons release transmitter via a flickering fusion pore. Nat Neurosci. 7, 341-346 (2004).
- Wu, Z., et al. Nanodisc-cell fusion: Control of fusion pore nucleation and lifetimes by SNARE protein transmembrane domains. Sci. Rep. 6, 27287 (2016).
- Alabi, A. A., Tsien, R. W. Perspectives on kiss-and-run: role in exocytosis, endocytosis, and neurotransmission. Ann Rev Physiol. 75, 393-422 (2013).
- Rossetto, O., Pirazzini, M., Montecucco, C. Botulinum neurotoxins: genetic, structural and mechanistic insights. Nature Rev Microbiol. 12, 535-549 (2014).
- Weber, T., et al. SNAREpins: minimal machinery for membrane fusion. Cell. 92, 759-772 (1998).
- Nickel, W., et al. Content mixing and membrane integrity during membrane fusion driven by pairing of isolated v-SNAREs and t-SNAREs. Proc Natl Acad Sci U S A. 96, 12571-12576 (1999).
- McNew, J. A., et al. Compartmental specificity of cellular membrane fusion encoded in SNARE proteins. Nature. 407, 153-159 (2000).
- Melia, T. J., You, D. Q., Tareste, D. C., Rothman, J. E. Lipidic antagonists to SNARE-mediated fusion. J Biol Chem. 281, 29597-29605 (2006).
- Hernandez, J. M., et al. Membrane fusion intermediates via directional and full assembly of the SNARE complex. Science. 336, 1581-1584 (2012).
- Fix, M., et al. Imaging single membrane fusion events mediated by SNARE proteins. Proc Natl Acad Sci U S A. 101, 7311-7316 (2004).
- Bowen, M. E., Weninger, K., Brunger, A. T., Chu, S. Single molecule observation of liposome-bilayer fusion thermally induced by soluble N-ethyl maleimide sensitive-factor attachment protein receptors (SNAREs). Biophys J. 87, 3569-3584 (2004).
- Liu, T., Tucker, W. C., Bhalla, A., Chapman, E. R., Weisshaar, J. C. SNARE-driven, 25-millisecond vesicle fusion in vitro. Biophys J. 89, 2458-2472 (2005).
- Yoon, T. Y., Okumus, B., Zhang, F., Shin, Y. K., Ha, T. Multiple intermediates in SNARE-induced membrane fusion. Proc Natl Acad Sci U S A. 103, 19731-19736 (2006).
- Diao, J., et al. A single-vesicle content mixing assay for SNARE-mediated membrane fusion. Nat Commun. 1, 1-6 (2010).
- Kyoung, M., et al. In vitro system capable of differentiating fast Ca2+-triggered content mixing from lipid exchange for mechanistic studies of neurotransmitter release. Proc Natl Acad Sci U S A. 108, E304-E313 (2011).
- Domanska, M. K., Kiessling, V., Stein, A., Fasshauer, D., Tamm, L. K. Single vesicle millisecond fusion kinetics reveals number of SNARE complexes optimal for fast SNARE-mediated membrane fusion. J Biol Chem. 284, 32158-32166 (2009).
- Kreutzberger, A. J., Kiessling, V., Tamm, L. K. High Cholesterol Obviates a Prolonged Hemifusion Intermediate in Fast SNARE-Mediated Membrane Fusion. Biophys J. 109, 319-329 (2015).
- Schwenen, L. L., et al. Resolving single membrane fusion events on planar pore-spanning membranes. Sci Rep. 5, 12006 (2015).
- Karatekin, E., et al. A fast, single-vesicle fusion assay mimics physiological SNARE requirements. Proc Natl Acad Sci U S A. 107, 3517-3521 (2010).
- Karatekin, E., Rothman, J. E. Fusion of single proteoliposomes with planar, cushioned bilayers in microfluidic flow cells. Nat Protoc. 7, 903-920 (2012).
- Smith, M. B., et al. Interactive, computer-assisted tracking of speckle trajectories in fluorescence microscopy: application to actin polymerization and membrane fusion. Biophys J. 101, 1794-1804 (2011).
- Stratton, B. S., et al. Cholesterol Increases the Openness of SNARE-mediated Flickering Fusion Pores. Biophysical journal. 110, (2016).
- Diao, J., et al. Synaptic proteins promote calcium-triggered fast transition from point contact to full fusion. Elife. 1, e00109 (2012).
- Kiessling, V., Domanska, M. K., Tamm, L. K. Single SNARE-mediated vesicle fusion observed in vitro by polarized TIRFM. Biophys J. 99, 4047-4055 (2010).
- Blasi, J., et al. Botulinum neurotoxin A selectively cleaves the synaptic protein SNAP-25. Nature. 365, 160-163 (1993).
- Washbourne, P., et al. Genetic ablation of the t-SNARE SNAP-25 distinguishes mechanisms of neuroexocytosis. Nat Neurosci. 5, 19-26 (2002).
- Diaz, A. J., Albertorio, F., Daniel, S., Cremer, P. S. Double cushions preserve transmembrane protein mobility in supported bilayer systems. Langmuir. 24, 6820-6826 (2008).
- Floyd, D. L., Ragains, J. R., Skehel, J. J., Harrison, S. C., van Oijen, A. M. Single-particle kinetics of influenza virus membrane fusion. Proc Natl Acad Sci U S A. 105, 15382-15387 (2008).
- Albertorio, F., et al. Fluid and air-stable lipopolymer membranes for biosensor applications. Langmuir. 21, 7476-7482 (2005).
- Daniel, S., Albertorio, F., Cremer, P. S. Making lipid membranes rough, tough, and ready to hit the road. Mrs Bulletin. 31, 536-540 (2006).
- Gao, Y., et al. Single reconstituted neuronal SNARE complexes zipper in three distinct stages. Science. 337, 1340-1343 (2012).
- Kenworthy, A. K., Hristova, K., Needham, D., Mcintosh, T. J. Range and Magnitude of the Steric Pressure between Bilayers Containing Phospholipids with Covalently Attached Poly(Ethylene Glycol). Biophys J. 68, 1921-1936 (1995).
- Knoll, W., et al. Solid supported lipid membranes: New concepts for the biomimetic functionalization of solid surfaces. Biointerphases. 3, Fa125-Fa135 (2008).
- Quinn, P., Griffiths, G., Warren, G. Density of newly synthesized plasma membrane proteins in intracellular membranes II. Biochemical studies. J Cell Biol. 98, 2142-2147 (1984).
- Sund, S. E., Swanson, J. A., Axelrod, D. Cell membrane orientation visualized by polarized total internal reflection fluorescence. Biophys J. 77, 2266-2283 (1999).
- Johnson, D. S., Toledo-Crow, R., Mattheyses, A. L., Simon, S. M. Polarization-controlled TIRFM with focal drift and spatial field intensity correction. Biophys J. 106, 1008-1019 (2014).
- Anantharam, A., Onoa, B., Edwards, R. H., Holz, R. W., Axelrod, D. Localized topological changes of the plasma membrane upon exocytosis visualized by polarized TIRFM. J Cell Biol. 188, 415-428 (2010).
- Axelrod, D. Carbocyanine dye orientation in red cell membrane studied by microscopic fluorescence polarization. Biophys J. 26, 557-573 (1979).
- Wang, T., Smith, E. A., Chapman, E. R., Weisshaar, J. C. Lipid mixing and content release in single-vesicle, SNARE-driven fusion assay with 1-5 msec resolution. Biophys J. 96, 4122-4131 (2009).
- Chernomordik, L. V., Frolov, V. A., Leikina, E., Bronk, P., Zimmerberg, J. The pathway of membrane fusion catalyzed by influenza hemagglutinin: restriction of lipids, hemifusion, and lipidic fusion pore formation. J Cell Biol. 140, 1369-1382 (1998).
- Takamori, S., et al. Molecular anatomy of a trafficking organelle. Cell. 127, 831-846 (2006).
- Wilhelm, B. G., et al. Composition of isolated synaptic boutons reveals the amounts of vesicle trafficking proteins. Science. 344, 1023-1028 (2014).
- Scott, B. L., et al. Liposome fusion assay to monitor intracellular membrane fusion machines. Methods Enzymol. 372, 274-300 (2003).
- Linkert, M., et al. Metadata matters: access to image data in the real world. J Cell Biol. 189, 777-782 (2010).
- Soumpasis, D. M. Theoretical analysis of fluorescence photobleaching recovery experiments. Biophys J. 41, 95-97 (1983).
- Ohki, S. A mechanism of divalent ion-induced phosphatidylserine membrane fusion. Biochim Biophys Acta. 689, 1-11 (1982).
- Berquand, A., et al. Two-step formation of streptavidin-supported lipid bilayers by PEG-triggered vesicle fusion. Fluorescence and atomic force microscopy characterization. Langmuir. 19, 1700-1707 (2003).
- Tamm, L. K., McConnell, H. M. Supported phospholipid bilayers. Biophys J. 47, 105-113 (1985).
- Rawle, R. J., van Lengerich, B., Chung, M., Bendix, P. M., Boxer, S. G. Vesicle fusion observed by content transfer across a tethered lipid bilayer. Biophys J. 101, L37-L39 (2011).
- Wagner, M. L., Tamm, L. K. Reconstituted syntaxin1a/SNAP25 interacts with negatively charged lipids as measured by lateral diffusion in planar supported bilayers. Biophys J. 81, 266-275 (2001).
- Kalb, E., Frey, S., Tamm, L. K. Formation of Supported Planar Bilayers by Fusion of Vesicles to Supported Phospholipid Monolayers. Biochimica Et Biophysica Acta. 1103, 307-316 (1992).
Reprints and Permissions
Request permission to reuse the text or figures of this JoVE article
Request PermissionThis article has been published
Video Coming Soon
Copyright © 2025 MyJoVE Corporation. All rights reserved