Method Article
Phase Behavior of Charged Vesicles Under Symmetric and Asymmetric Solution Conditions Monitored with Fluorescence Microscopy
In This Article
Summary
Experiments on phase separated giant unilamellar vesicles (GUVs) frequently neglect physiological solution conditions. This work presents approaches to study the effect of high-salinity buffer on liquid-liquid phase separation in charged multicomponent GUVs as a function of trans-membrane solution asymmetry and temperature.
Abstract
Phase-separated giant unilamellar vesicles (GUVs) exhibiting coexisting liquid-ordered and liquid-disordered domains are a common biophysical tool to investigate the lipid raft hypothesis. Numerous studies, however, neglect the impact of physiological solution conditions. On that account, the current work presents the effect of high-salinity buffer and trans-membrane solution asymmetry on liquid-liquid phase separation in charged GUVs grown from dioleylphosphatidylglycerol, egg sphingomyelin, and cholesterol. The effects were studied under isothermal and varying temperature conditions.
We describe equipment and experimental strategies applicable for monitoring the stability of coexisting liquid domains in charged vesicles under symmetric and asymmetric high-salinity solution conditions. This includes an approach to prepare charged multicomponent GUVs in high-salinity buffer at high temperatures. The protocol entails the option to perform a partial exchange of the external solution by a simple dilution step while minimizing the vesicle dilution. An alternative approach is presented utilizing a microfluidic device that allows for a complete external solution exchange. The solution effects on phase separation were also studied under varying temperatures. To this end, we present the basic design and utility of an in-house built temperature control chamber. Furthermore, we reflect on the assessment of the GUV phase state, pitfalls associated with it and how to circumvent them.
Introduction
Ever since the observation of micron-sized domains in liquid-liquid phase-separated giant unilamellar vesicles (GUVs) by fluorescence microscopy, GUVs have been used as a model system to investigate the lipid raft hypothesis1,2,3. As the area of their free-standing bilayer lies in the range of that from biological cells, they are suitable mimics of plasma membranes featuring the hypothesized rafts. Numerous studies on such GUVs have been performed with vesicles dispersed in pure water, sucrose or low-salinity solutions4,5,6,7,8. These conditions, however, do not reflect physiologically relevant exposure of biomembranes to high-salinity environments and trans-membrane solution asymmetry as are the conditions for cells.
In this work and in a previous publication from our group9, the phase states of charged multicomponent GUVs were examined as a function of the presence of salt and solution asymmetry across the membrane. GUVs were prepared from mixtures of different ratios of dioleoylphosphatidylglycerol (DOPG), egg sphingomyelin (eSM), and cholesterol (Chol) in either sucrose solution (with osmolarity of 210 mOsm/kg) or high-salinity buffer (100 mM NaCl, 10 mM Tris, pH 7.5, 210 mOsm/kg). The lipid choice was justified by the data already obtained on the phase diagram of this mixture6,8.
A number of methods for the preparation of GUVs are available in the literature10,11,12 (note that here, we will not consider those involving transfer of lipids from an oil-based to an aqueous phase13,14 because of the inherent danger of the remaining oil residues in the membrane which may affect the phase behavior). The preparation of GUVs in high-salinity buffer is associated with specific challenges. For solutions of low ionic strength, the electroformation method15,16 presents a quick way to prepare GUVs in high yields with little defects10,17. The method is based on depositing a layer of lipids on a conductive surface (the electrode), drying them, and hydrating them with an aqueous solution while applying an AC field. However, this method requires adjustments if salt is present in the aqueous solution18,19. It is assumed that the driving force for vesicle growth by electroformation is electroosmosis16 which is hindered at high conductivities20. Hence, electroswelling of GUVs in high-salinity solutions is not a straightforward approach as it requires optimization for different salt concentrations present in the swelling solution. Gel-assisted vesicle swelling21,22 is a potential alternative to electroformation with even faster formation times. This approach builds on the enhanced lipid film hydration when a gel (agarose or polyvinyl alcohol (PVA)) is used as a substrate. These approaches, however, come with the risk of membrane contamination in the case of agarose-based swelling23 and/or temperature limits as in the case of PVA-based swelling. Similarly, a protocol to grow GUVs on a cellulose paper substrate has recently been established24. General issues of this method are the lack of control over the substrate purity as well as the usage of large amounts of lipid. In this work, we will introduce and present the advantages of the most traditional method for GUV preparation, namely the spontaneous swelling method25,26. It consists of drying a lipid layer on a lipophobic substrate, hydrating it in water-vapor atmosphere, and subsequent swelling in the desired swelling solution (see Figure 1 and details in the Protocol section). This method does not offer control over the vesicle size distribution and results in overall smaller vesicles as compared to methods where the production is assisted by electric field, polymer substrate or microfluidic means. However, the vesicle quality and size is appropriate for examining the membrane phase state as explored here.
Creating asymmetry between the solutions across the vesicle membrane is associated with certain challenges as well. One commonly used approach is the direct dilution of the vesicle suspension in the desired external solution27,28. However, this also decreases the vesicle distribution density. Another strategy is to slowly exchange the external solution around GUVs settled at the bottom of a flow-cell that allows for solution in- and outflux. To avoid disturbing or even losing the vesicles with the flow, low flow rates are applied8, which renders this approach time-inefficient. Moreover, neither of these approaches guarantees full external solution exchange. An obvious solution is to immobilize vesicles in order to avoid losing them during an external solution exchange. For instance, biotinylated GUVs can be tethered onto a streptavidin-coated surface29. However, this approach may lead to compositional variations at the adhered and hence the non-adhered membrane segments30,31.The application of magnetic or electric fields to trap vesicles results in imposing membrane tension32. Employing optical tweezers to trap a vesicle requires having a handle attached (i.e. a bead), while the use of optical stretchers may involve local heating33. Trapping of GUVs can also be accomplished by growing them on platinum wires without final detachment34. This however yields vesicles which are not isolated and which are usually connected to the wires or other vesicles by thin lipid tubes (tethers).
The presented work highlights strategies to overcome the aforementioned limitations. We first present a detailed description of the spontaneous swelling method adapted and optimized for the production of GUVs in high-salinity buffers. We then introduce two approaches to efficiently create asymmetric solution conditions by simple dilution or the utilization of a microfluidic device. Because our goal is the analysis of the membrane phase state of GUVs in different solution conditions, the subsequent sections describe criteria for successful statistical analysis and present hints for avoiding false categorization.
The analyses were performed under isothermal conditions as well as under varying temperatures. While temperature control is commonly employed, details about experimental temperature-control chambers are rarely described. Here, an in-house built setup to observe GUVs at various temperature conditions is presented.
Protocol
1. Spontaneous Swelling of GUVs
NOTE: Chloroform is a harmful substance, which is highly volatile. Perform all operations involving chloroform under a fume hood. Do not use plastic labware such as pipette tips or plastic containers for the transfer and/or storage of chloroform solutions. Chloroform dissolves plastic, which contaminates the solution. Use glass syringes and glass containers instead. Moreover, work as clean as possible to avoid the introduction of impurities as they may interact with the membranes. Note that typical lipid concentrations in final GUV preparations are in the micromolar range, thus impurities in that concentration range may have strong effect on the membrane behavior.
- Apart from the basic equipment, have the following items ready.
- Prepare a polytetrafluorethylene (PTFE, commonly known as Teflon) plate for lipid deposition of size ~1.5 cm x 1.5 cm and appropriate thickness. Roughen the plate on one side with fine sandpaper.
NOTE: PTFE is lipophobic and will not be wetted by chloroform solutions if smooth. Both sides of the PTFE plate can be roughened to avoid confusion about the correct side for lipid deposition. The plate thickness should be chosen for easy handling, e.g. that it is not too flexible and can be easily covered by the hydration solution (see Figure 1). Here we used plates of ~2 mm thickness. Once roughened, the PTFE plate can be reused for new experiments after proper cleaning (step 1.3). - Prepare a sealable glass vial of appropriate volume (~15 mL) for the final lipid film hydration and vesicle growth.
- Prepare a sealable glass container into which the ~15 mL glass vial fits; it will be used to create a water-saturated atmosphere for lipid film pre-swelling, see Figure 1.
- Prepare a polytetrafluorethylene (PTFE, commonly known as Teflon) plate for lipid deposition of size ~1.5 cm x 1.5 cm and appropriate thickness. Roughen the plate on one side with fine sandpaper.
- Prepare 4 mM lipid stocks in the desired ratio of 1,2-dioleoyl-sn-glycero-3-phospho-(1'-rac-glycerol) (sodium salt) (DOPG), egg sphingomyelin (eSM), and cholesterol (Chol), with additional 0.1 mol% 1,1′-dioctadecyl-3,3,3′,3′-tetramethylindocarbocyanine perchlorate (DiIC18) to a total lipid concentration of 4 mM. Use chloroform as a solvent. See the Table of Materials.
- Thoroughly rinse the PTFE plate and the glass container with commercial dishwashing detergent, ethanol, and chloroform in that sequence and finally dry them.
- Using a glass syringe, deposit and evenly spread 10 - 15 µL of lipid stock onto the roughened side of the PTFE plate to create a uniform lipid film. Use the syringe needle to spread the solution if needed.
- Place the PTFE plate onto a clean surface and desiccate it together with the deposited lipid film for 2 h at 60 °C to remove the chloroform. For the sake of convenience, deposit the plate into the cleaned and unsealed 15 mL glass container during desiccation.
NOTE: The high temperature ensures that the lipid film is in a homogeneous single-liquid state in this and all subsequent steps. - After desiccation, fill the pre-swelling glass container with deionized water up to a level that does not allow buoyancy to knock over the ~15 mL glass vial (~1 cm), see Figure 1.
- Put the ~15 mL glass vial with the PTFE plate into the container and cover it in order that a water-saturated atmosphere may emerge, see Figure 1B.
NOTE: Condensed water at the inner container walls gives a good indication for successful water vapor saturation. - Let the deposited lipid film pre-swell inside the closed glass container at 60 °C for 4 h. Within this time period prepare the desired swelling solution.
NOTE: For vesicle preparations which can be conducted at lower temperature, this time can be extremely shortened - down to a few minutes - if warm water-saturated nitrogen or argon is used for the pre-swelling instead.- Prepare 200 mM sucrose or 100 mM NaCl, 10 mM Tris, pH 7.5 adjusted with HCl and heat to 60 °C to make the swelling solution.
- After the pre-swelling, take the ~15 mL glass with the PTFE plate out of the container. With a syringe connected to a 0.45 µm filter, add ~5 mL of the swelling solution into the 15 mL glass vial to hydrate the lipid film.
NOTE: Fixing a needle to the filter eases the insertion of the swelling solution. Pre-warming the syringe and filter may be advisable to ensure a single-liquid phase state of the lipid film while adding the swelling solution. Filtering the solution minimizes (in-) organic contaminations of bacteria or salt precipitate etc. - Seal the ~15 mL glass vial holding the hydrated lipid film on the PTFE plate to minimize evaporation. If needed, use paraffin film to enhance the sealing. Leave the hydrated lipid film at 60 °C overnight for final GUV swelling.
2. Harvesting GUVs
NOTE: The aggregation of GUVs swollen and detached from the PTFE substrate results in a little (~1 mm) cloud-like clump visible by eye. It appears whitish when no fluorescence dye is used. Otherwise, it is colored according to the fluorophore absorption spectrum. The addition of DiIC18 renders the cloud pink (see Figure 2). The vesicles are concentrated in the aggregate and harvesting it maximizes the vesicle yield.
- Cool down the vesicles to room temperature within ~1 h. Cut ~1/10 of the pointy end of a piston pipette plastic tip for the cluster or aggregate of vesicles to fit through the orifice.
NOTE: The cooling rate is particularly important if solid-liquid phase separation is expected as it alters the size of solid domains. Here, to slow down cooling, we placed the sample in contact with a metal block of size 5 cm x 9.5 cm x 7.5 cm (H x L x W) that cooled down to room temperature within 1 h. - Pipette up the cluster together with an appropriate volume of swelling solution (see Figure 2). Re-suspend the aggregate in the swelling solution to create symmetric solution conditions, or any desired iso-osmotic solution to create asymmetric solution conditions.
NOTE: The lower limit of the volume is limited by the size of the aggregate to be harvested completely. The external solution is diluted and in order to assess the exact concentration, the volume of the vesicle solution has to be taken into account.
3. Observation of GUVs for Phase State Assessment Using Fluorescence Microscopy
NOTE: The GUVs were doped with DiIC18 as a fluorescent marker. This fluorophore preferentially partitions into the liquid-disordered (Ld) phase. This allows for the fluorescence microscopy observation of domains resulting from phase separation in the GUVs. We performed phase state assessment with epi-fluorescence microscopy. In principle, these observations are also feasible using confocal laser scanning microscopy (CLSM), which also allows for signal quantification (e.g. to determine membrane unilamellarity). However, CLSM requires more sophisticated equipment and (usually) epi-fluorescence observations before scanning are helpful in any case.
- Decide on an objective (e.g. 40X magnification with a 0.6 numerical aperture (NA) as used here) to observe the GUVs and use it consistently when comparing phase states of the same composition in different solution conditions. Use appropriate excitation and emission wavelength filters to enable fluorescence observations with the fluorophore used (e.g. excitation at 560 ± 40 nm and 630 ± 75 nm with a 585 nm beam splitter in between as used for DiIC18).
NOTE: Phase state boundaries within a phase diagram will depend on the resolution that the objective achieves as it defines the minimal size of micro-domains to be detected. - For analysis, only select GUVs which fulfill the following quality criteria.
- Ensure unilamellarity of the GUV membrane by visual observation of different vesicles and compare their intensities; vesicles with the lowest fluorescence emission intensity are most likely unilamellar.
NOTE: Spontaneous swelling may yield vesicle batches where a large fraction of giant vesicles are not unilamellar. - Perform an additional check by quantifying the fluorescence emission intensity of supposedly unilamellar giant vesicles and check the corresponding signal for scattering within the population. If no integer differences among different GUVs are observed, all of them are likely to be unilamellar.
NOTE: If vesicles are prepared from conventional lipids using an established method such as spontaneous swelling, the approach described above for the detection of unilamellar vesicles is sufficient. If establishing a new GUV preparation protocol or using unconventional lipids, more detailed studies will be required to confirm unilamellarity. For instance, the membrane fluorescence signals of labelled vesicles prepared by a new protocol could be compared to those of GUVs prepared by an established method; or the membrane pore protein α-hemolysin can be inserted into vesicle membranes24. Dye added to the outside of the vesicles would then enter their interior or not, depending on the presence of uni- or multilamellar vesicles, respectively. - Ensure that the GUV has a reasonable minimum diameter for domains to still be recognizable.
- Ensure that the GUV has (almost) no defects such as protruding or adhered parts or internal structures.
- Ensure unilamellarity of the GUV membrane by visual observation of different vesicles and compare their intensities; vesicles with the lowest fluorescence emission intensity are most likely unilamellar.
- Transfer an aliquot of GUV suspension onto a microscope slide and seal it properly. Prepare an observation chamber.
- Deposit the sample onto the microscope slide. Surround it by a silicone spacer with a central circular cutout. To avoid contamination, ensure that the spacer is not in contact with the sample. Seal the interior by placing a cover slip on top of the silicone spacer.
NOTE: Instead of the silicone spacer one can use silicone grease or homemade polydimethysiloxane (PDMS) spacers. Sealing the chamber ensures minimum evaporation of the sample and maintains iso-osmolar conditions. - Leave the sample for ~5 min for re-equilibration of possible domains.
NOTE: The mechanical stress from pipetting may mix the membrane domains, which need time to reform. - Place the microscope slide with the sample onto the microscope stage and analyze the phase state of the GUV batch in a statistical approach. Observe more than 30 GUVs per batch and determine their phase state according to the following criteria for GUV phase state assessment with DiIC18 (Figure 3).
NOTE: After their growth, vesicles may change their individual compositions due to (for example) domain budding off or exchange of membrane material via nanotubes. GUVs therefore exhibit compositional variations within the same batch35.- Single-liquid phase being either liquid-ordered (Lo) or liquid-disordered (Ld): Ensure that the overall GUV shape is spherical and smooth and DiIC18 is homogeneously distributed in the membrane (first images in upper and bottom panels in Figure 3).
- Two-phase Lo+Ld coexistence state: Ensure that the vesicles exhibit domains that appear circular with smooth boundaries; according to the DiIC18 partitioning behavior domains are bright red (Ld) or dark red/black (Lo) (second images in upper and bottom panels in Figure 3, in false color). Check that the domains are free to diffuse on the vesicle surface and can coalesce.
- Two-phase solid (S)+liquid (S+Lo or S+Ld) coexistence state: Ensure that the domains may appear finger-like or roundish but with angular boundaries (third images in upper and bottom panels in Figure 3). Observe liquid domains (red) on a solid (black) background that will not display diffusion. Contrary, solid (black) domains will be free to diffuse on a liquid background (red).
- Three-phase S+Lo+Ld coexistence: Observe three types of domains appearing: (i) angular black domains (S), embedded in (ii) dim (Lo) and (iii) bright (Ld) red domains.
- Ascribe the population of GUVs to the phase state that has been determined to be dominant among a random sample, as in the following examples:
- If 20 single-liquid GUVs and 15 Lo+Ld GUVs are observed, consider the batch to be a single-liquid phase.
- If 10 S+L GUVs, 30 Lo+Ld GUVs, and 25 single-liquid GUVs are observed, consider the batch to be a Lo+Ld.
4. GUV Observation in Microfluidic Device
NOTE: First fabricate the microfluidic device; details of the microfluidic device design and assembly have been given elsewhere36,37; see Figure 4 for a brief description.
- Prepare fresh GUV swelling solution (either salt or sucrose according to step 1.8.1) and filter it through a 0.45 µm filter.
NOTE: Any impurities in the flowing solutions may clog the microfluidic device. - Cut 200 µL piston pipette plastic tips and place them into the holes in the PDMS part of the device. Add 100 µL and 5 µL of the fresh and filtered swelling solution to the reservoir (see Figure 5A) and each of the cut pipette tips, respectively. Centrifuge the whole device at 900 x g for 10 min in a swing rotor centrifuge to pre-fill the device and remove air.
- Pre-fill the 1 mL glass syringe and attached tubing with the swelling solution and move the plunger position to 0 mL.
- Place the tubing into the fluidic outlet of the device and place the syringe into the syringe pump.
NOTE: The choice of syringe and syringe pump brand is not important. However, glass syringes are more precise and the pump should be able to operate in the µL/min flow range. - Connect a custom pressure control unit to the 8 inlets of the microfluidic control layer (see Figure 5A). Set the pressure to the pressure control unit to 3 bar (air, nitrogen or argon), but set the valves to the microfluidic device to the closed position.
- Place the microfluidic device, now connected to the syringe pump and pressure control unit, on an inverted confocal microscope stage.
- Use an objective with the same magnification and NA as during the bulk observations. Control if the phase state statistics as explained in step 3.7 remain the same if another objective is used to avoid observation artifacts which are based on differing resolutions.
- Load the GUVs into the device.
- First, pipette away all but 25 to 50 µL of the solution that has remained in the reservoir. Add 150 µL of the GUV solution (in either sucrose or salt according to step 1.8.1, but matching the solution used to pre-fill the device in step 4.1) to the reservoir and mix by gentle pipetting. Set the syringe to 10 µL/min flow rate in withdraw mode for approximately 20 min or until more than 90% of the traps are occupied.
NOTE: The reservoir should not be allowed to run dry. If this happens, air bubbles will enter the micro-channels. Add more GUV solution to the reservoir during loading but take care not to introduce air bubbles when pipetting into the device.
- First, pipette away all but 25 to 50 µL of the solution that has remained in the reservoir. Add 150 µL of the GUV solution (in either sucrose or salt according to step 1.8.1, but matching the solution used to pre-fill the device in step 4.1) to the reservoir and mix by gentle pipetting. Set the syringe to 10 µL/min flow rate in withdraw mode for approximately 20 min or until more than 90% of the traps are occupied.
- Open all of the pressure control unit valves to close the microfluidic ring-valves around the traps/GUVs. Set the syringe pump to 0 µL/min. After 1 h, observe the GUVs and record confocal images. Excite and detect the GUVs according to the fluorophore used (e.g. excitation at 561 nm and detection between 580 - 620 nm as for DiIC18). Use the same selection criteria from step 3.6, and take care to note the location of each GUV (i.e. the column and row number, see Figure 4)
- Exchange the solution surrounding the GUVs.
- Set the syringe pump to 0 µL/min and pipette away all but 25 to 50 µL of the GUV solution from the reservoir. Add 150 µL of the 2nd solution (in either sucrose or salt according to step 1.8.1, depending on the desired solution outside the GUVs) to the reservoir and mix by gentle pipetting. Pipette away all but 25 to 50 µL of the buffer solution from the reservoir.
NOTE: This solution has to be filtered using a 0.45 µm filter too.
- Set the syringe pump to 0 µL/min and pipette away all but 25 to 50 µL of the GUV solution from the reservoir. Add 150 µL of the 2nd solution (in either sucrose or salt according to step 1.8.1, depending on the desired solution outside the GUVs) to the reservoir and mix by gentle pipetting. Pipette away all but 25 to 50 µL of the buffer solution from the reservoir.
- Repeat previous step at least 5 times to thoroughly replace the solution in the reservoir. Set the syringe to 10 µL/min flow rate in withdraw mode for ~10 min to replace the solution in the micro-channels.
- Reduce the flow rate to 1 µL/min. Open the 8 pressure control unit valves for 2 s and close again (resulting in opening and closing of the microfluidic ring valves). Set the flow rate to 0 µL/min again.
- After 1 h, observe the GUVs and record confocal images. Again, take care to note the column and row of the micro-chamber where each GUV is located to allow comparisons of the same GUV before and after external buffer exchange.
5. Design and Calibration of the Temperature-control Chamber
NOTE: A suitable chamber for temperature control can be either obtained commercially or home-built. Temperature control is usually achieved by thermal coupling of the chamber with the GUV sample to a water bath or a Peltier element. Here, we describe the design and characterization of a home-built temperature-control chamber operating with an external water thermostat. Such thermostats are available in many laboratories or can be salvaged from old equipment such as lasers or spectrometers.
- Assemble a heat-flow chamber, here, made out of an aluminum block, with connectors to a water bath as shown in Figure 6. Seal the openings at top and bottom and enable bright field observation of the sample by gluing cover glasses to the block.
- Flip the flow chamber on the side where the sample will be placed and pipette a droplet of about 100 µL of the solution used in experiments according to step 1.8.1. Optionally, insert a fiber optic temperature probe (e.g. FISO FTI-10) or add a temperature-sensitive dye in an appropriate concentration, e.g. 500 µM Rhodamine B.
- Assemble the GUV observation chamber using silicone grease deposited in ring shape or some other spacer (PTFE or rubber) and seal it with a 0.17 µm cover glass. Ensure that the drop is not in contact with the sealing agent or the spacer to avoid the introduction of impurities.
- Slowly turn the assembly upside-down and connect the external water thermostat with appropriate tubing to it. Pay special attention to any water leaks.
- Set the lowest desired temperature on the external water thermostat and let the system equilibrate until the reading of the temperature sensor is stable; the time needed for equilibration will give an estimate of the minimal response time of the system.
- Perform control experiments at least once before starting to use the chamber.
- Measure the solution temperature (e.g. with a glass fiber probe) and compare it to the reading of the thermostat over the temperature range of interest.
- Check for a minimal offset from the thermostat reading and linearity of the measured temperatures.
- Check for a temperature gradient inside the observation chamber using a temperature sensitive dye. Measure the solution temperature via fluorescence intensity or fluorescence lifetime imaging microscopy (FLIM) for different distances from the bottom cover slip40. Additionally check if there is any temperature gradient in the region of GUV observation, as shown in Figure 7.
6. GUV Observations at Varying Temperatures
NOTE: Typically, for GUVs whose membranes potentially phase-separate and that appear to be homogenous at observation temperature Tobs, phase separation will be induced below Tobs (whether that is observed depends on the temperature range investigated). Vice versa, phase separated vesicles should become homogenous at a temperature higher than Tobs. However, this does not need to be the case for a particular (complex) lipid composition and it might be interesting to always scan the whole accessible temperature range38. The protocol for observation and evaluation of phase transition temperatures does not rely on the specific method used for temperature control.
- Assemble the temperature observation chamber according to section 5, omitting the fiber optic temperature probe or the temperature-sensitive fluorophore.
- Set the external water bath to room temperature (23 °C) and let the system equilibrate for 10-15 min.
- Count the number of phase separated vesicles using the criteria from step 3.6; the overall phase state of the GUV population will give a hint about the region of the transition temperature of the system. If the phase state across the vesicle population is rather heterogeneous go directly to step 6.5.
- Increase (if the majority of vesicles are phase-separated) or decrease (if the majority of vesicles are homogenous) the temperature in coarse intervals (e.g. 1 - 2 °C) and let the system equilibrate for about 2 min. Re-evaluate the phase state of the GUV population by means of a random sample and vary the temperature until the vesicle population shows a heterogeneous phase state.
- Once the population is near the point of phase transition (i.e. the phase states among individual GUVs are rather heterogeneous), decrease the temperature interval (e.g. 0.5 °C) to increase resolution. Let the system equilibrate for ~2 min and re-evaluate the phase state of the GUV population by means of a random sample.
- Once the point of phase transition is passed, keep varying the temperature until all GUVs are now homogenous or phase-separated, respectively.
- Check for hysteresis to evaluate whether the equilibration times are sufficient.
- Change the direction of the temperature scan, i.e. if the scan was done for increasing temperature, do the scan by decreasing the temperature.
- Choose at least a subset of temperatures to assess the GUV population phase state ratio (e.g. 80% phase-separated).
- If substantial deviations between both directions in the phase state ratio indicate hysteresis, reduce the temperature step size and/or increase the equilibration time in steps 6.4 and 6.5.
- If there is no hysteresis indicated by equal ratios, consider increasing the step size and/or equilibration time.
- Plot the phase state ratios against the temperature. For quantification, fit the data to an appropriate model (Figure 8).
NOTE: Phase transition curves commonly feature a sigmoidal trajectory and the sigmoidal Boltzmann model provides an appropriate set of fitting parameters:

y: fraction of uniform/phase-separated GUVs
A1: the initial fraction value
A2: the final fraction value
T: temperature
Tmix: temperature at half-maximal y
As y is the fraction of homogenous GUVs, A1 and A2 should be fixed to 0 and 1, respectively. As the miscibility transition is assumed to be sigmoidal, once the fraction value is measured to be 0 at a certain temperature all fraction values of the temperature range below are considered to be 0. Vice versa, once the fraction value is 1 at a particular temperature, all fraction values of the temperature range above are assumed to be 1.
Results
GUV swelling
With the spontaneous swelling approach described here, GUVs composed of DOPG, eSM, and Chol were grown overnight in 210 mM sucrose or 100 mM NaCl, 10 mM Tris, pH 7.5 forming a visible aggregate. Harvesting the aggregate ensures high vesicle yields. The resuspension in the swelling solution resulted in symmetric trans-membrane solution conditions. To create asymmetric conditions, the aggregate was resuspended in an iso-osmolar sucrose or high-salinity solution, respectively (Figure 2). The resulting dilution corresponds to a quasi-external solution exchange while minimizing the dilution of the number of GUVs.
Phase diagram mapping of GUVs using fluorescence microscopy
The presence of 0.1 mol% of the phase-specific DiIC18 in the GUVs allowed for the observation of their phase states via wide-field fluorescence microscopy. Vesicles exhibiting S+L phase separation were observed through a 63x/1.2NA to be able to resolve finely structured finger-like domains. For all remaining cases, a 40x/0.6 NA objective was used. To avoid artifacts during the visual inspection of GUVs and to maximize reproducibility, certain criteria were set that determined which vesicles to consider for the phase state analysis (protocol step 3.6).
GUVs prepared from ternary DOPG/eSM/Chol mixtures of a broad range of ratios swollen in sucrose or high-salinity solution and observed at room temperature exhibited homogenous Lo or Ld phases, Lo+Ld, and S+L phase separation, see Figure 3. Figure 9 shows exemplarily defective vesicles, which should not be included in the data analysis and also shows how to identify multilamellar vesicles.
Due to their unknown history, GUVs are likely to exhibit within-batch compositional variation35. Hence, the overall phase state of a particular composition was determined in a statistical approach. GUV populations of a certain lipid composition were ascribed to the phase state that was observed to be dominant in a random sample (protocol step 3.6). Yet, compositions close to the Lo+Ld coexistence region often yielded batches where the dominant phase state made up a narrow majority. For such vague cases, the visual inspection was repeated with at least three independent samples. The fraction of vesicles with identical phase state (e.g. exhibiting Lo+Ld phase separation) present within the random samples was averaged over the number of trials which was taken as the final result (Figure 10).
The described protocols resulted in sufficient GUV growth over a broad range of different ratios of DOPG, eSM, and Chol in high-salinity and sucrose solutions. Extensive regions within the ternary phase diagram could be mapped under symmetric as well as asymmetric high-salinity solution conditions (Figure 11). The differences in the vesicle phase behavior observed under different solution conditions were discussed elsewhere in detail9.
Observations of phase behavior after complete buffer exchange using the microfluidic method
The creation of asymmetric solution conditions by dilution results in residues of the swelling solution outside. Our microfluidic approach allows for a complete external solution exchange. Figure 5A shows the microfluidic device fully assembled on the confocal microscope stage together with fluidic outlet and pressure control inlets. Tubes are connected via 90 ° metal pipes to allow space for transmitted light imaging from above.
For observation within the microfluidic device, a confocal microscope with a 63x/1.2NA water immersion objective lens was implemented. As with the previous observations in bulk, DiIC18 was used to stain the membrane. When making observations of the phase state of GUVs trapped in the device, care must be taken not to misinterpret the data. Due to the close proximity of the GUVs to the posts, the excitation and emission light paths may be partially blocked by the PDMS leading to the false appearance of domains (Figure 12). Here, the transmitted light detection is useful to check for the position of the GUVs at the posts. This unwanted effect is particularly prominent for small GUVs of less than 10 µm in diameter. In these cases, the data were rejected. The confocal image in Figure 13A shows a planar vesicle section that crosses an Lo domain present on the GUV vesicle. In this case, planar cross-section scans further above or below the section would have not showed the domain due to its small size compared to that of the GUV, which is why it would have been missed and the vesicle considered to be in a homogeneous phase state. Hence, a confocal z-stack should be used to inspect the entire GUV surface. For wide-field microscopy, this might not be an issue because the whole vesicle can be imaged at once.
Finally, examples are given of GUVs before and after exchange of the outer solution where it is clear what the phase states of the membranes are (Figure 14). Each device has 60 chambers (each with a pair of posts to trap a single GUV), allowing tens of experiments per device (see Figure 4). However, some GUVs may get lost during the external solution exchange. This can be minimized by the following steps: 1) Using bovine serum albumin (BSA) coating to prevent GUV adhesion/rupture at the posts; coating is done by exposing the chamber walls to 20 mg/mL BSA for 60 min and subsequent rinsing with the working buffer. Another adhesive molecule that could be used is poly(L-lysine)-graft-poly(ethylene glycol)39. 2) Careful osmotic matching of the inner and outer solutions to avoid flaccid GUVs, which could pass through the center of the posts or bursting of GUVs. 3) Optimizing the GUV preparation procedure to obtain vesicles bigger than ~8 µm in diameter to prevent passage through the center of the posts.
Design and characterization of temperature-controlled chamber for observation of GUV phase states
We designed a simple flow chamber, which features connections to the external water thermostat (Figure 6). We obtained the chamber by milling of an aluminum block. In general, the chamber material does not need to be heat conductive, as the sample is coupled to the water bath by the lower cover glass as shown in Figure 6B and 6C.
Independently of the exact design, the performance of the chamber should be evaluated. Specifically we checked for the linearity of the sample temperature with the externally-set temperature, any systematic temperature offset, and a temperature gradient within the chamber. The first two points were addressed by direct temperature measurement within the chamber by a fiber optic temperature probe (e.g. FISO FTI-10). We also checked for a temperature gradient within the GUV suspension. Such a gradient could stem from heat flow to the outside of the chamber. Spatially resolved temperature measurements can be obtained by a temperature sensitive fluorophore40, see Figure 7.
Data plotting and fitting to obtain Tmix of phase-separated GUVs
Plotting the fraction of homogenous GUVs over the observed temperature range resulted in a sigmoidally shaped data point trajectory. We fit the data to the Boltzmann model (protocol section 6.8) from which the Tmix could be deduced (Figure 8).
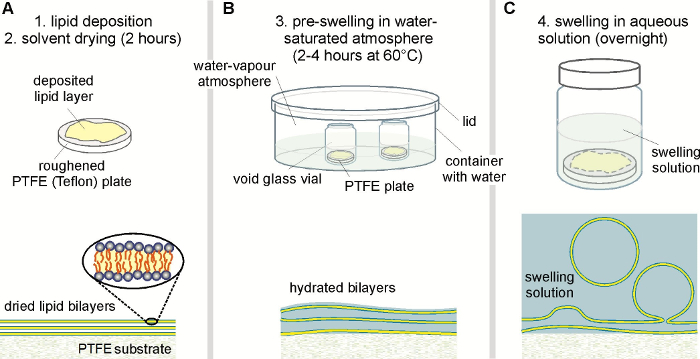
Figure 1: Experimental steps during the spontaneous swelling protocol (top panel) with the corresponding stage of vesicle growth (lower panel). (A) A homogenous lipid film is spread onto a roughened PTFE plate and dried from any solvent. (B) The dried lipid film is then pre-swollen in a water-saturated atmosphere inside a closed container with water to facilitate the bilayer hydration. The void glass vial contains the PTFE plate and remains open during this hydration step. (C) The pre-swollen lipid film finally becomes fully hydrated by the addition of the desired swelling solution onto the lipid-coated PTFE plate inside the glass vial. To avoid evaporation, the glass vial is sealed properly during the overnight incubation. To minimize compositional variations within a batch, all steps need to be performed at a temperature where the lipid mixture is fully miscible. Please click here to view a larger version of this figure.
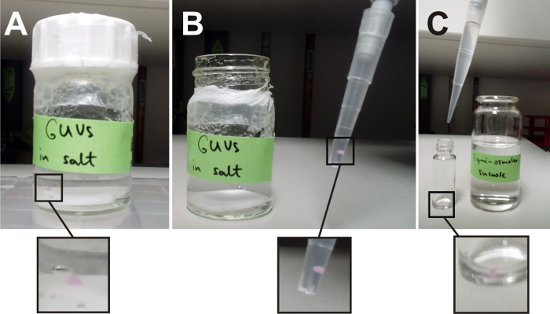
Figure 2: GUV harvesting. (A) A deposited lipid film consisting of DOPG/eSM/Chol at molar ratios of 20/60/20 with 0.1 mol% DiIC18 was swollen in high-salinity buffer composed of 100 mM NaCl, 10 mM Tris, pH 7.5. The lid of the glass container was additionally sealed with paraffin film. The magnified region of interest contains the resulting GUV aggregate. Its red appearance is a consequence of the presence of DiIC18. (B) The GUVs were harvested with a truncated pipette tip. In this image, the aggregate was pipetted up together with 50 µL of swelling solution, which were transferred into a fresh vial. (C) To create asymmetric trans-membrane solution conditions, the aggregate was diluted in another isotonic external solution. Here, the aggregate together with the 50 µL swelling solution was resuspended in 950 µL sucrose solution resulting in a 20x dilution of the swelling solution. Please click here to view a larger version of this figure.
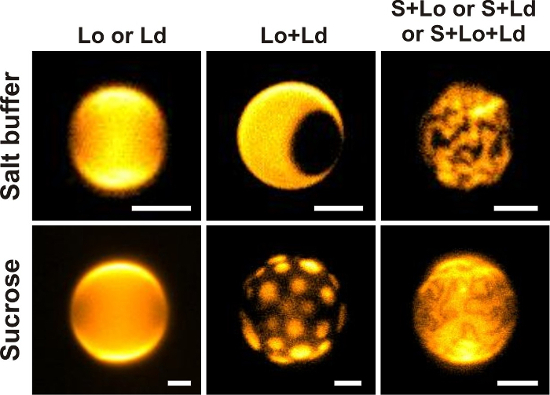
Figure 3: GUV imaging. Wide field fluorescence images of GUVs doped with 0.1 mol% DiIC18 prepared and observed in symmetric salt or sucrose solutions consisting of different ratios of DOPG, eSM, and Chol (in salt buffer, from left to right: 40/20/40; 50/20/30; 30/60/10; in sucrose, from left to right: 30/30/40; 20/60/20; 40/50/10). The images depict GUVs in different (coexisting) phase states assessed according to the criteria in protocol step 3.6. Here, vesicles were imaged through a 40X/0.6 NA objective. Scale bars = 5 µm. Please click here to view a larger version of this figure.

Figure 4: Layout of microfluidic channel design. GUVs enter the lower fluidic layer (outlined channels) via the inlet below a reservoir. A filter blocks unwanted debris from the device. They then enter an array of 60 chambers (8 rows and 15 columns) each containing posts for single GUV capture (see insert). Each chamber can be isolated within a ring valve actuated by a control layer (filled black channels) above the fluidic layer. Please click here to view a larger version of this figure.
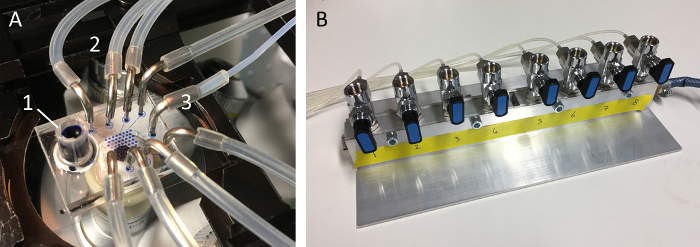
Figure 5: Microfluidic device. (A) Photograph of a microfluidic device used to trap single GUVs and fully exchange the outer solution. Labels indicate the reservoir to add solutions (1), the 8 x pressure inlets connected to the pressure control unit (2), and the fluidic outlet connected to the syringe and pump (3). Panel (B) shows the pressure control unit featuring 8 valves each regulating 1 tube connected to the microfluidic device. Here valves #1 and #2 are open and hence the corresponding ring valves are closed. Please click here to view a larger version of this figure.
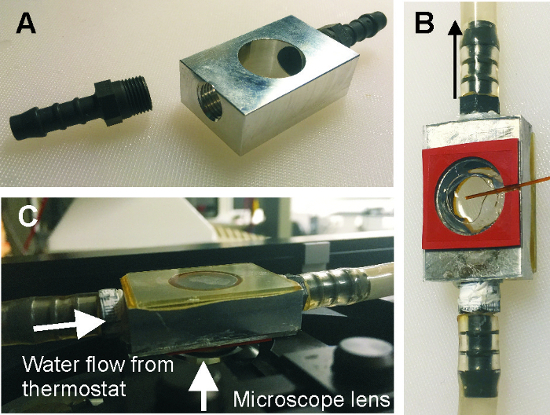
Figure 6: Temperature control chamber. (A) Chamber before the assembly. (B) Assembled chamber (facing upwards) with 2 mm cover glasses glued to the top and bottom. The orange rubber spacer measures 0.5 mm in height and is sealed with a 0.17 mm cover slip for observation of the enclosed GUV suspension. In this image a temperature probe is inserted for calibration purposes (brown fiber exiting the chamber on the right). (C) Final assembly on the stage of an inverted microscope without the temperature probe. The orange rubber spacer is now facing downwards. The rubber is adhesive enough to hold the sample in place. Note that light can be transmitted through the sample enabling both epi-fluorescence and bright field observations. Please click here to view a larger version of this figure.
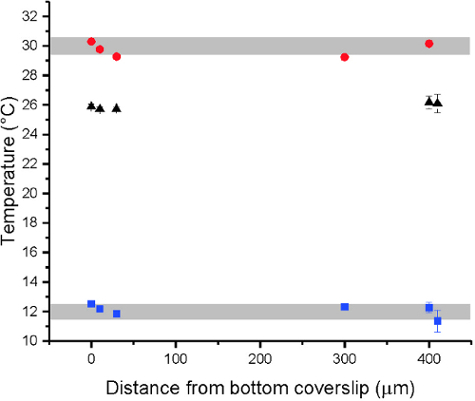
Figure 7: Spatially resolved temperature data inside the observation chamber obtained by FLIM measurements of a temperature sensitive dye (here: 500 µM Rhodamine B)40. Data points obtained at 0, 10, 30, 300, and 400 µm above the bottom cover slip. The red and blue data points were measured for temperature of the water bath set at 30 °C and 12 °C, respectively. The black data points indicate the water bath left to equilibrate to room temperature. Small temperature variations throughout the chamber were observed but stayed below 0.5 °C (gray bars). The total chamber height is about 500 µm according to the spacer thickness (see above). The error bars indicate standard deviations. Please click here to view a larger version of this figure.
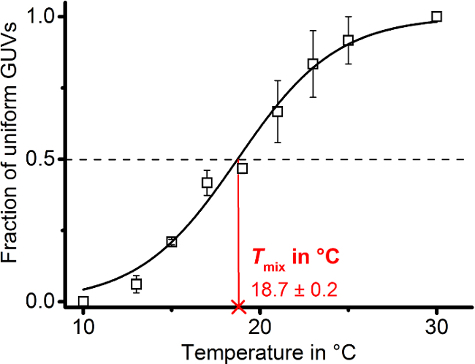
Figure 8: Locating the miscibility temperature. The graph shows individual data points of homogeneous (single-liquid state) the fraction of GUVs prepared from DOPG/eSM/Chol in a ratio 30/40/30 doped with 0.1 mol% DiIC18 from three independent random samples (N = 20 - 40). Error bars represent standard error of means. Data points were fitted to the Boltzmann model described in step 6.8 (continuous black line) from which the domain mixing temperature Tmix was deduced (follow red continuous line to abscissa) according to the half maximum of the sigmoidal curve on the ordinate (dashed black line). Initial and final values (A1 and A2) were fixed to 0 and 1, respectively. Please click here to view a larger version of this figure.
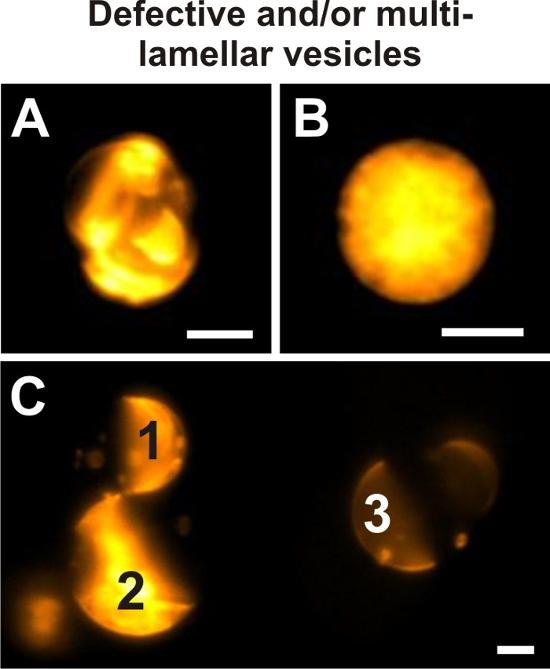
Figure 9: Defective vesicles. Examples of giant vesicles prepared from 20/60/20 DOPG/eSM/Chol and doped with 0.1 mol% if DiIC18 that do not meet the criteria set in step 4.2 imaged by wide-field fluorescence microscopy. Intensity display ranges of individual images were optimized for the fluorescence intensity of the depicted vesicle each time. Due to the presence of additional membrane material and encapsulated smaller vesicles, the phase state of the vesicle in (A) cannot be clearly defined. The appearance of this giant vesicle does not allow for any reliable visual inspection for lamellarity. Panel (B) depicts a vesicle of which the interior is crowded with membrane material. As a consequence, the fluorescence signal of the exterior vesicle membrane is superimposed with its internal signal, rendering a visualization of lamellarity and potential domains impossible. (C) The fluorescence intensities of three different giant vesicles are shown in direct comparison within the same display intensity range. This image shows that giant multilamellar vesicles (1, 2) can be identified by their increased fluorescence signal compared to the GUV (3). Here, multilamellar as well as unilamellar giant vesicles exhibit Lo+Ld phase separation. Vesicles in all images were imaged through a 40x/0.6 NA objective. Scale bars = 5 µm. Please click here to view a larger version of this figure.
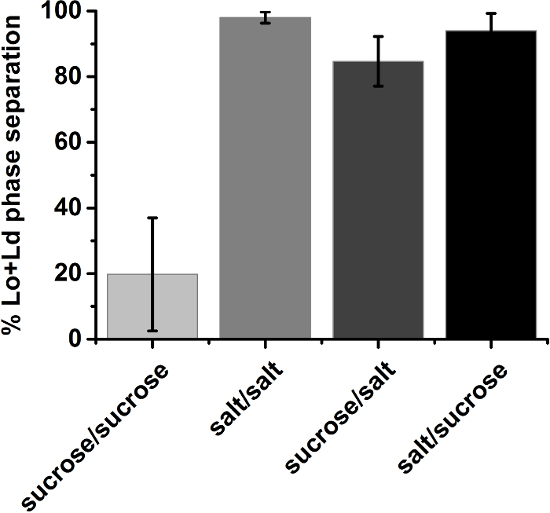
Figure 10: Fraction of Lo+Ld phase separated GUVs averaged over at least three independent samples. Vesicles were composed of 30/40/30 DOPG/eSM/Chol close to the border of the Lo+Ld coexistence region. The error bars for symmetric sucrose conditions illustrate the batch-to-batch scattering. The label of the ordinate describes solutions inside/outside the vesicles; sucrose: 210 mM sucrose; salt: 100 mM NaCl, 10 mM Tris, pH 7.5; Error bars indicate standard deviations. Please click here to view a larger version of this figure.

Figure 11: Phase diagram of GUVs prepared from DOPG, eSM, and Chol mapped under different solution conditions using 210 mM sucrose (sucrose) and 100 mM NaCl, 10 mM Tris, pH 7.5 (salt). GUV phase states were explored in sucrose/sucrose (A; upper section), sucrose/salt (in/out) (A; lower polygonal section), salt/salt (B; upper section), and salt/sucrose (B; lower polygonal section). The cartoons illustrate the dominant domain pattern within the highlighted sections and the corresponding solution conditions. Vesicle phase states represented in the lower polygonal sections were observed under asymmetric solution conditions upon 20x GUV dilution. Adapted from reference9. Please click here to view a larger version of this figure.
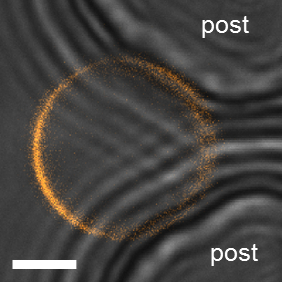
Figure 12: Artifacts in trapped GUVs. Example of a small GUV where a false domain can be seen due to the close proximity with the posts (DOPG/eSM/Chol 60/20/20). The bright-field transmitted light image showing the posts (grey) is overlaid with the confocal fluorescence image of the GUV (orange). The posts are seen to create an interference pattern in the bright-field image. The fluorescence signal close the posts (right) is reduced giving the appearance of phase separation. Scale bar = 5 µm.
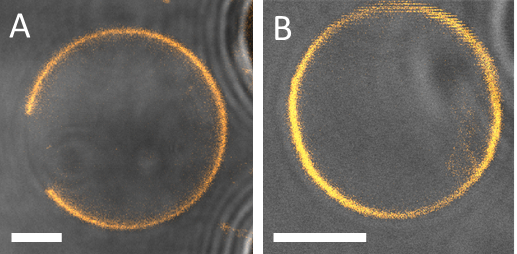
Figure 13: Examples of two different GUVs captured by the PDMS posts where the phase states are clearly visible. (A) Lo + Ld phase separated vesicle made of DOPG/eSM/Chol 60/20/20. (B) A vesicle made of 40/30/30 exhibiting Ld or Lo single phase. A confocal z-stack of the whole vesicle was examined to confirm that no (out-of-focus) domains were present. The edges of the posts are seen on the right hand side of the images (grey). Scale bar = 5 µm.
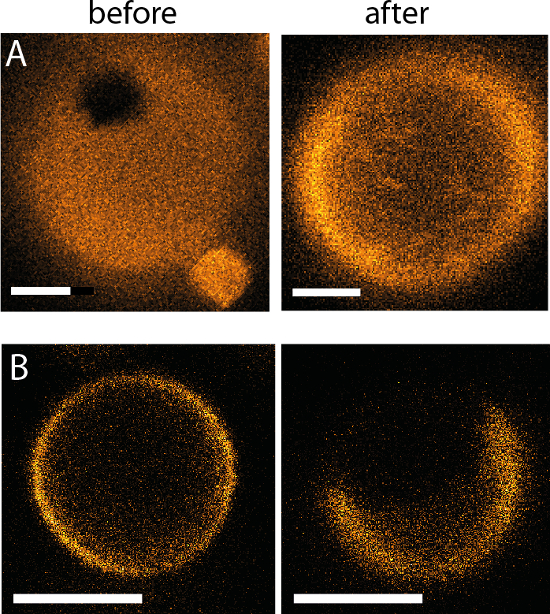
Figure 14: Resulting phase behavior after a complete fluidic exchange using the microfluidic device. The same GUV is shown both before and after solution exchange for (A) symmetric salt/salt (in/out) to salt/sucrose (in/out) (DOPG/eSM/Chol 60/20/20, scale bar is 2 µm) and (B) symmetric sucrose/sucrose (in/out) to sucrose/salt (in/out) (DOPG/eSM/Chol 30/40/30, scale bar = 3 µm). Adapted from reference9.
Discussion
Successful production of GUVs for phase state observations under symmetric and asymmetric high-salinity conditions
The protocols presented here introduces a strategy to assess the influence of high-salinity buffer and solution asymmetry on the membrane phase state of charged GUVs over a broad range of compositions. One of the major challenges towards achieving this goal was the production of charged GUVs in high-salinity buffers.
We successfully produced GUVs in sucrose solution and high-saline buffer by a simple spontaneous swelling approach, which includes a pre-hydration step of the deposited lipid film and an overnight final hydration step for vesicle growth. It is important to note that the lipid deposition should be done on a roughened PTFE plate to ensure even lipid spreading to yield unilamellar vesicles. Moreover, it is essential to perform every step during vesicle preparation at a temperature where the lipid film is in a homogenous and fluid phase state. Else, the vesicle population may be polydisperse in composition and bias the final population phase state analysis. The specific protocol for the spontaneous swelling of GUVs yields a vesicle clump which on the one hand offers the possibility to re-suspend it in small volumes to obtain highly concentrated vesicle dispersions, and on the other hand provides asymmetric solution conditions across the membrane while minimizing the dilution of vesicles8,28. It is essential that during vesicle dilution or external solution exchange, the inside and outside osmolarities remain matched as morphology changes caused by osmolarity mismatches may induce or prevent Lo+Ld phase separation41 or, in case of hypotonic conditions, may lead to vesicle bursting.
Here, attempts to optimize electroformation protocols in high-salinity solution resulted in the production of no GUVs while PVA-assisted swelling yielded multilamellar vesicles. Even though it requires longer preparation times and results in vesicle batches of lower quality10,17, the successful production of charged vesicles by spontaneous swelling comes with additional advantages. It demands minimal effort while resulting in sufficient yields for statistical batch analyses and, unlike electroformation, no sophisticated equipment or optimization were required. Moreover, no contaminations by lipid oxidation have been observed42,43. According to the literature there are no differences between the lipid compositions of vesicles and the corresponding stocks from which they were grown7,17. Furthermore, the vesicle formation on a PTFE substrate does not prompt the inclusion of any contaminations in contrast to gel-assisted swelling methods where foreign molecules may be introduced by the substrate23. Electroformation comes with further drawbacks related to excessive vesicle dilution when creating asymmetric solution conditions. GUVs produced by electroformation are usually present as a homogeneous dispersion (in contrast to the highly concentrated vesicle suspension in the form of a clump formed during spontaneous swelling). Any dilution of the external solution would substantially dilute the number of vesicles as well. Furthermore, over the course of this work it was observed that DOPG/eSM/Chol GUVs produced by electroformation in sucrose became unstable if diluted in high-salinity buffer. Fluorescence from lipid patches on the microscope slide indicated that vesicles would burst before their visual inspection was possible. Such instability may be ascribed to an elevated membrane tension of vesicles prepared by electroformation as compared to those obtained by spontaneous swelling10.
Although the vesicle dilution is an easy and quick approach to create asymmetric GUV solution conditions, it only accomplishes a partial external solution exchange, albeit to a high fraction (here: 95 %, Figure 2), as upon dilution, traces of the swelling solution will remain. The choice of the degree of the external solution exchange is a trade-off between pipetting up the vesicle clump together with the swelling solution (section 2) and not diluting it too much. Hence, we introduced an alternative microfluidic approach discussed elsewhere in detail37 that allows for a quick and complete external solution exchange during GUV phase state observations to verify the phase state observations made for diluted vesicles. The observations of phase state variations when changing from symmetric to asymmetric solution conditions were indeed observed to be in agreement. Additionally, both methods to generate asymmetric solution conditions shown here are comparably quick (compare Ref.8) and come with no known risks of local composition alterations (compare references30,31), increase in membrane tension (compare reference32), or local heating (compare reference33), as for the alternative methods discussed in the Introduction. During the microfluidic trapping, an osmotic balance between the vesicle interior and exterior is not only essential to avoid phase state artifacts as mentioned above but also deflation caused by hypertonic solution conditions might cause the trapped GUVs to slip through the posts after an external solution exchange.
Even though spontaneous swelling has been successfully applied to grow uncharged vesicles from a DOPC/eSM/Chol system, in other cases, the absence of charges may impair GUV swelling due to the resulting lack of repulsion between the individual bilayers44. Extending the pre-swelling period or introducing bulky lipid headgroups may counter this issue45. Furthermore, the vesicle stability after their dilution in solutions different from the one used for swelling may differ for different lipid compositions and dilution media, which we have not investigated here. We also have not explored the possibility of tuning the average GUV diameter with the preparation method presented here. But parameters such as vesicle composition and swelling solution are likely to influence the results. The application of alternative methods46 may yield larger vesicles for the lipids and solutions used here, however, they may come with other drawbacks associated with the method. The above-described approach to produce GUVs in symmetric and asymmetric high-salinity conditions provides a potential tool for further studies of vesicles made up of different lipid compositions and dispersed in different media. As we have not explored those possibilities, future trials will show how generally the GUV preparation and dilution methods may be applied.
Observing phase separation at varying temperatures
Different experimental setups suitable to study GUVs at varying temperatures exist. While these setups are not commonly described in detail within the literature, the current work presents a basic assembly applicable for such studies.
Control measurements show that the temperature of this in-house designed and built chamber is precisely controlled by a thermostat and temperature gradients inside the chamber are within the experimental temperature resolution. It is ensured that the experimental thermal conditions are consistent with the reading of the thermostat.
During the assessment of GUV phase states over a broad temperature range, it is important that the observed vesicles are well equilibrated after the temperature has been changed. One possible way to ensure this is to check for hysteresis. If hysteresis is present, the temperature steps should be decreased and/or equilibration times increased. As temperature control in this work is established by a water-based thermostat, the range of working temperatures is ideally limited to 0 - 100 °C. This range can be expanded by using other temperature control liquids such as oil or by employing other setups, e.g. a Peltier device. In practice, the working temperature is also limited by possible condensation or evaporation. In addition, for temperatures far away from room temperature, the occurrence of a steady state temperature gradient across the observation chamber becomes more likely. Also, the imaging equipment may be harmed at extreme temperatures. For typical temperature ranges appropriate for lipid vesicle studies (~10 - 50 °C7,9) damage to the observation equipment should be considered but is typically not expected.
Vesicle domain observation artifacts
There are a number of sources for observation artifacts using wide-field fluorescence microscopy. First of all, one should be aware that the maximum resolution r of the object applied for the visual inspection of vesicle phase states determines the detection limit of lipid domains according to:

where λ is the emission wavelength, and NA is the numeric aperture of the objective. A typical objective with a 40x magnification and an NA of 0.6 which detects green emission light around 560 nm would reach an optical resolution of ~0.6 µm. Hence, studies that compare phase states of vesicles made from particular lipid mixtures among different conditions should use the same objective for the same lipid mixture.
Another artifact is the occurrence of lipid domains as a consequence of lipid photo-oxidation due to an extended exposure to excitation light41. Photo-damage occurs preferentially on unsaturated hydrocarbon lipid moieties. In fact, for some lipid compositions, such domain formation of initially homogeneous vesicles was observed here after an extended period of excitation light exposure (~30 s). To counter that issue, the excitation light was kept focused at one field of view for only a few seconds for the phase state assessment. Hence, DiIC18 was suitable for our purposes. Other dyes, however, may be much more sensitive and may need to be handled at lower excitation intensities and with shorter excitation light exposure times.
Mechanical shear stress from the pipette transfer of the vesicles potentially mixes domains temporarily, thereby distorting the apparent vesicle phase behavior. For some batches, different vesicles showed different phase behaviors 0 min and 5 min after pipette transfer onto the microscope coverslip. Also the shear stress induced by the fluid flow in the microfluidic device has been shown to result in domain mixing47. Vesicles should be left undisturbed for a sufficient amount of time for equilibration before observation. Within this study, vesicles trapped on the microfluidic device were left undisturbed for 1 h after vesicle loading and solution exchanges before observation.
To avoid some of the above-mentioned difficulties as well as the restriction imposed by the light diffraction limit, alternative methods such as nuclear magnetic resonance spectroscopy48 or super resolution microscopy techniques49 could be employed.
Conclusion and outlook
The presented work demonstrates a set of methods that allows for the analysis of the influence of high-salinity symmetric and asymmetric solution conditions on membrane phase separation. All of the presented methods are suitable for other applications. The microfluidic device for example provides a platform to study the kinetics of domain formation and disappearance upon the induction of solution asymmetry. Also, domain appearance as a function of salt concentration could be examined that way. All methods could also be used to look at the influence on the phase behavior using any other solutions of interest.
Disclosures
The authors have nothing to disclose.
Acknowledgements
This work is part of the MaxSynBio consortium, which is jointly funded by the Federal Ministry of Education and Research of Germany and the Max Planck Society.
Materials
| Name | Company | Catalog Number | Comments |
| 1,2-dioleoyl-sn-glycero-3-phospho-(1'-rac-glycerol), sodium salt | Avanti Polar Lipids | 840475C | abbreviated as DOPG in the text |
| chicken egg sphingomyelin | Avanti Polar Lipids | 860061 | abbreviated as eSM |
| cholesterol (ovine wool, > 98 %) | Avanti Polar Lipids | 700000 | abbreviated as Chol |
| 1,1'-dioctadecyl-3,3,3',3'-tetramethylindocarbocyanine perchlorate | Molecular Probes | D-282 | abbreviated as DiIC18 |
| Chloroform, HPLC grade (≥ 99.8 %) | Merck | ||
| NaCl (> 99.8 %) | Roth | ||
| HCl (37 %) | Roth | ||
| Tris (≥ 99.9 %) | Roth | ||
| Sucrose (≥ 99.5 %) | Sigma Aldrich | ||
| Parafilm | |||
| Threaded vial 45x27 mm, 15 mL | Kimble | Soda flat bottom, white screw cap | |
| pH meter | Mettler Toledo | MP220 | |
| Osmometer | Gonotec | Osmomat030 | |
| Epi-fluorescence microscope | Zeiss | Axio Observer D1 | |
| Confocal laser scanning microscope | Leica | TCS SP5 | |
| Objective 40x, 0.6 NA | Zeiss | LD Achroplan | |
| Objective 40x, 0.75 NA | Leica | 506174 | |
| Objective 63x, 0.9 NA | Leica | 506148 | |
| Microscope slide, 56x26 mm, 0.17 ± 0.01 mm | Menzel-Gläser | ||
| Cover slip, 22x22 mm, 0.17 ± 0.01 mm | Menzel-Gläaser | ||
| Parafilm "M" | Bremix Flexible Packaging | ||
| Syringes, 5 mL, 10 mL | Braun | ||
| 0.45 µm syringe filter | GVS North America | Cameo 25AS, 1213723 | Acetate, sterile |
References
- Dietrich, C., et al. Lipid rafts reconstituted in model membranes. Biophys J. 80 (3), 1417-1428 (2001).
- Bagatolli, L. A. To see or not to see: lateral organization of biological membranes and fluorescence microscopy. Biochim Biophys Acta. 1758 (10), 1541-1556 (2006).
- Carquin, M., D'Auria, L., Pollet, H., Bongarzone, E. R., Tyteca, D. Recent progress on lipid lateral heterogeneity in plasma membranes: From rafts to submicrometric domains. Prog Lipid Res. 62, 1-24 (2016).
- Baumgart, T., Hess, S. T., Webb, W. W. Imaging coexisting fluid domains in biomembrane models coupling curvature and line tension. Nature. 425 (6960), 821-824 (2003).
- Bacia, K., Schwille, P., Kurzchalia, T. Sterol structure determines the separation of phases and the curvature of the liquid-ordered phase in model membranes. Proc Natl Acad Sci U S A. 102 (9), 3272-3277 (2005).
- Vequi-Suplicy, C. C., Riske, K. A., Knorr, R. L., Dimova, R. Vesicles with charged domains. Biochim Biophys Acta. 1798 (7), 1338-1347 (2010).
- Blosser, M. C., Starr, J. B., Turtle, C. W., Ashcraft, J., Keller, S. L. Minimal effect of lipid charge on membrane miscibility phase behavior in three ternary systems. Biophys J. 104 (12), 2629-2638 (2013).
- Pataraia, S., Liu, Y., Lipowsky, R., Dimova, R. Effect of cytochrome c on the phase behavior of charged multicomponent lipid membranes. Biochim Biophys Acta. 1838 (8), 2036-2045 (2014).
- Kubsch, B., Robinson, T., Lipowsky, R., Dimova, R. Solution Asymmetry and Salt Expand Fluid-Fluid Coexistence Regions of Charged Membranes. Biophys J. 110 (12), 2581-2584 (2016).
- Dimova, R., et al. A practical guide to giant vesicles. Probing the membrane nanoregime via optical microscopy. J Phys Condens Matter. 18 (28), S1151-S1176 (2006).
- Liu, A. P., Fletcher, D. A. Biology under construction: in vitro reconstitution of cellular function. Nat Rev Mol Cell Biol. 10 (9), 644-650 (2009).
- Walde, P., Cosentino, K., Engel, H., Stano, P. Giant Vesicles: Preparations and Applications. Chembiochem. 11 (7), 848-865 (2010).
- van Swaay, D., deMello, A. Microfluidic methods for forming liposomes. Lab Chip. 13 (5), 752-767 (2013).
- Stein, H., Spindler, S., Bonakdar, N., Wang, C., Sandoghdar, V. Production of Isolated Giant Unilamellar Vesicles under High Salt Concentrations. Front Physiol. 8, 63 (2017).
- Angelova, M. I., Dimitrov, D. S. Liposome Electroformation. Faraday Discuss. 81, 303-311 (1986).
- Dimitrov, D. S., Angelova, M. I. Lipid swelling and liposome formation mediated by electric fields. Bioelectrochemistry and Bioenergetics. 19, 323-336 (1988).
- Rodriguez, N., Pincet, F., Cribier, S. Giant vesicles formed by gentle hydration and electroformation: a comparison by fluorescence microscopy. Colloids Surf B Biointerfaces. 42 (2), 125-130 (2005).
- Montes, L. R., Alonso, A., Goni, F. M., Bagatolli, L. A. Giant unilamellar vesicles electroformed from native membranes and organic lipid mixtures under physiological conditions. Biophys J. 93 (10), 3548-3554 (2007).
- Pott, T., Bouvrais, H., Meleard, P. Giant unilamellar vesicle formation under physiologically relevant conditions. Chem Phys Lipids. 154 (2), 115-119 (2008).
- Green, N. G., Ramos, A., Gonzalez, A., Morgan, H., Castellanos, A. Fluid flow induced by nonuniform ac electric fields in electrolytes on microelectrodes. I. Experimental measurements. Phys Rev E Stat Phys Plasmas Fluids Relat Interdiscip Topics. 61 (4 Pt B), 4011-4018 (2000).
- Horger, K. S., Estes, D. J., Capone, R., Mayer, M. Films of Agarose Enable Rapid Formation of Giant Liposomes in Solutions of Physiologic Ionic Strength. J Am Chem Soc. 131 (5), 1810-1819 (2009).
- Weinberger, A., et al. Gel-Assisted Formation of Giant Unilamellar Vesicles. Biophys J. 105 (1), 154-164 (2013).
- Lira, R. B., Dimova, R., Riske, K. A. Giant Unilamellar Vesicles Formed by Hybrid Films of Agarose and Lipids Display Altered Mechanical Properties. Biophys J. 107 (7), 1609-1619 (2014).
- Kresse, K. M., Xu, M., Pazzi, J., Garcia-Ojeda, M., Subramaniam, A. B. Novel Application of Cellulose Paper As a Platform for the Macromolecular Self-Assembly of Biomimetic Giant Liposomes. ACS Appl Mater Interfaces. 8 (47), 32102-32107 (2016).
- Reeves, J. P., Dowben, R. M. Formation and properties of thin-walled phospholipid vesicles. J Cell Physiol. 73 (1), 49-60 (1969).
- Needham, D., Evans, E. Structure and Mechanical-Properties of Giant Lipid (DMPC) Vesicle Bilayers from 20-Degrees-C Below to 10-Degrees-C above the Liquid-Crystal Crystalline Phase-Transition at 24-Degrees-C. Biochemistry. 27 (21), 8261-8269 (1988).
- Manneville, J. B., et al. COPI coat assembly occurs on liquid-disordered domains and the associated membrane deformations are limited by membrane tension. Proc Natl Acad Sci U S A. 105 (44), 16946-16951 (2008).
- Wollert, T., Wunder, C., Lippincott-Schwartz, J., Hurley, J. H. Membrane scission by the ESCRT-III complex. Nature. 458 (7235), 172 (2009).
- Kuhn, P., et al. A facile protocol for the immobilisation of vesicles, virus particles, bacteria, and yeast cells. Integr Biol (Camb). 4 (12), 1550-1555 (2012).
- Sarmento, M. J., Prieto, M., Fernandes, F. Reorganization of lipid domain distribution in giant unilamellar vesicles upon immobilization with different membrane tethers. Biochim Biophys Acta. 1818 (11), 2605-2615 (2012).
- Lipowsky, R., Rouhiparkouhi, T., Discher, D. E., Weikl, T. R. Domain formation in cholesterol-phospholipid membranes exposed to adhesive surfaces or environments. Soft Matter. 9 (35), 8438 (2013).
- Korlach, J., Reichle, C., Muller, T., Schnelle, T., Webb, W. W. Trapping, deformation, and rotation of giant unilamellar vesicles in octode dielectrophoretic field cages. Biophys J. 89 (1), 554-562 (2005).
- Delabre, U., et al. Deformation of phospholipid vesicles in an optical stretcher. Soft Matter. 11 (30), 6075-6088 (2015).
- Fidorra, M., Garcia, A., Ipsen, J. H., Hartel, S., Bagatolli, L. A. Lipid domains in giant unilamellar vesicles and their correspondence with equilibrium thermodynamic phases: a quantitative fluorescence microscopy imaging approach. Biochim Biophys Acta. 1788 (10), 2142-2149 (2009).
- Bezlyepkina, N., Gracia, R. S., Shchelokovskyy, P., Lipowsky, R., Dimova, R. Phase diagram and tie-line determination for the ternary mixture DOPC/eSM/cholesterol. Biophys J. 104 (7), 1456-1464 (2013).
- Eyer, K., Kuhn, P., Stratz, S., Dittrich, P. S. A microfluidic chip for the versatile chemical analysis of single cells. J Vis Exp. (80), e50618 (2013).
- Robinson, T., Kuhn, P., Eyer, K., Dittrich, P. S. Microfluidic trapping of giant unilamellar vesicles to study transport through a membrane pore. Biomicrofluidics. 7 (4), 44105 (2013).
- Veatch, S. L., Gawrisch, K., Keller, S. L. Closed-loop miscibility gap and quantitative tie-lines in ternary membranes containing diphytanoyl PC. Biophys J. 90 (12), 4428-4436 (2006).
- Kolesinska, B., et al. Interaction of beta(3) /beta(2) -peptides, consisting of Val-Ala-Leu segments, with POPC giant unilamellar vesicles (GUVs) and white blood cancer cells (U937)--a new type of cell-penetrating peptides, and a surprising chain-length dependence of their vesicle- and cell-lysing activity. Chem Biodivers. 12 (5), 697-732 (2015).
- Robinson, T., et al. Removal of background signals from fluorescence thermometry measurements in PDMS microchannels using fluorescence lifetime imaging. Lab Chip. 9 (23), 3437-3441 (2009).
- Morales-Penningston, N. F., et al. GUV preparation and imaging: minimizing artifacts. Biochim Biophys Acta. 1798 (7), 1324-1332 (2010).
- Zhou, Y., Berry, C. K., Storer, P. A., Raphael, R. M. Peroxidation of polyunsaturated phosphatidyl-choline lipids during electroformation. Biomaterials. 28 (6), 1298-1306 (2007).
- Breton, M., Amirkavei, M., Mir, L. M. Optimization of the Electroformation of Giant Unilamellar Vesicles (GUVs) with Unsaturated Phospholipids. J Membr Biol. 248 (5), 827-835 (2015).
- Lasic, D. D., Needham, D. The "stealth" liposome: a prototypical biomaterial. Chemical Reviews. 95, 2601-2628 (1995).
- Needham, D., McIntosh, T. J., Lasic, D. D. Repulsive interactions and mechanical stability of polymer-grafted lipid membranes. Biochim Biophys Acta. 1108 (1), 40-48 (1992).
- Akashi, K., Miyata, H., Itoh, H., Kinosita, K. Preparation of giant liposomes in physiological conditions and their characterization under an optical microscope. Biophys J. 71 (6), 3242-3250 (1996).
- Sturzenegger, F., Robinson, T., Hess, D., Dittrich, P. S. Membranes under shear stress: visualization of non-equilibrium domain patterns and domain fusion in a microfluidic device. Soft Matter. 12 (23), 5072-5076 (2016).
- Veatch, S. L., Polozov, I. V., Gawrisch, K., Keller, S. L. Liquid domains in vesicles investigated by NMR and fluorescence microscopy. Biophys J. 86 (5), 2910-2922 (2004).
- Owen, D. M., Magenau, A., Williamson, D., Gaus, K. The lipid raft hypothesis revisited--new insights on raft composition and function from super-resolution fluorescence microscopy. Bioessays. 34 (9), 739-747 (2012).
Reprints and Permissions
Request permission to reuse the text or figures of this JoVE article
Request PermissionThis article has been published
Video Coming Soon
Copyright © 2025 MyJoVE Corporation. All rights reserved