Method Article
Quantification of Plasmid-Mediated Antibiotic Resistance in an Experimental Evolution Approach
* These authors contributed equally
In This Article
Summary
Our experimental approach provides a strategy to follow plasmid abundance and antibiotic resistance over time in bacterial populations.
Abstract
Plasmids play a major role in microbial ecology and evolution as vehicles of lateral gene transfer and reservoirs of accessory gene functions in microbial populations. This is especially the case under rapidly changing environments such as fluctuating antibiotics exposure. We recently showed that plasmids maintain antibiotic resistance genes in Escherichia coli without positive selection for the plasmid presence. Here we describe an experimental system that allows following both the plasmid genotype and phenotype in long-term evolution experiments. We use molecular techniques to design a model plasmid that is subsequently introduced to an experimental evolution batch system approach in an E. coli host. We follow the plasmid frequency over time by applying replica plating of the E. coli populations while quantifying the antibiotic resistance persistence. In addition, we monitor the conformation of plasmids in host cells by analyzing the extent of plasmid multimer formation by plasmid nicking and agarose gel electrophoresis. Such an approach allows us to visualize not only the genome size of evolving plasmids but also their topological conformation-a factor highly important for plasmid inheritance. Our system combines molecular strategies with traditional microbiology approaches and provides a set-up to follow plasmids in bacterial populations over a long time. The presented approach can be applied to study a wide range of mobile genetic elements in the future.
Introduction
Plasmids are circular, self-replicating genetic elements that are ubiquitous in prokaryotes. They are agents of lateral gene transfer, as they can transfer traits between microbial populations, and thus are considered to play a major role in microbial evolution. Plasmids are drivers of rapid adaptation to growth-limiting conditions over a short time (e.g., in the presence of antibiotics or pesticides1) and are responsible for long-term transition to other lifestyle modes (e.g., emergence of pathogenicity2). The most striking examples for the impact of plasmids on transfer of genes are documented in ecosystems exposed to fluctuating levels of antibiotics, such as medical clinics or in industrial farms3. Due to strong positive selection, many plasmids encode for antimicrobial resistance genes and are often found to confer multiresistance to their bacterial host. Plasmids enable migration between populations or bacterial species, resulting in a rapid propagation of multiple antimicrobial resistance. Under nonselective conditions plasmids are not essential to the cell and are often even referred to as parasitic elements. Nonetheless, plasmids are ubiquitous in nature and their evolution is highly intertwined with that of bacterial chromosomes. Plasmid persistence in natural environments (fluctuating and nonselective) remains poorly understood, yet it is of high importance for our understanding of the persistence of antibiotic resistance genes in nature.
Experimental evolution is a powerful tool for the study of microbial populations4. Experimental evolution demonstrated that imposing strong selection for plasmid maintenance leads to compensatory (i.e., adaptive) evolution of the plasmid or host chromosome that reduces the plasmid fitness cost and, in turn, facilitates plasmid abundance (i.e., plasmid persistence)5,6,7. Thus, following the plasmid-host interaction over time may reveal important mechanisms of adaptation of both elements. Furthermore, experimental evolution enables one to quantify the abundance of plasmid-carrying cells over time under various conditions8,9,10.
Plasmid persistence in evolution experiments can be monitored by several strategies including flow cytometry by fluorescent activated cell sorting (FACS)11, quantitative PCR (qPCR)11, or in cultivation-based methods. Flow cytometry requires a FACS machine and the introduction of a detectable (fluorescent) marker gene, such as the green fluorescent protein (GFP), on the plasmid. However, GFP expression may alter several cellular properties and furthermore influence the plasmid location in the cell12, which in turn may influence plasmid inheritance during cell division. A qPCR approach to measure plasmid abundance may be highly biased by the plasmid copy number, which can vary greatly along bacterial growth phase and over time13. Lastly, a culture-based and plating approach requires the introduction of a selectable marker gene. This may be an antibiotic resistance gene, which is often encoded on natural plasmids; thus, no genetic manipulation is necessary. Antibiotic resistance may be followed by a traditional replica plating approach. Thus, to study natural plasmid dynamics, replica plating is well-suited to monitor plasmid-encoded antibiotic resisitance14.
To visualize plasmid molecules (e.g., to evaluate plasmid size) several methods may be applied. Whole plasmids can be amplified using a PCR-based approach. However, this requires the design of specific primers, which may be challenging during an evolution experiment, because the plasmid sequence may change over time. In addition, it is difficult to amplify plasmid multimers in a PCR-based approach due to multiple binding sites for the PCR primers. Multimeric plasmid molecules can appear following plasmid replication termination or through recombination of plasmid molecules and are mostly oriented head-to-tail15. Another approach of plasmid visualization combines enzymatic digestion of plasmid molecules by DNA endonucleases that either cleave or nick a plasmid DNA strand with agarose gel electrophoresis analysis. The same plasmid of different sizes (e.g., monomers vs. multimers) results in different gel mobilities that can be observed when visualizing the plasmid molecules. This approach enables visualization and quantification of different plasmid conformations (i.e., multimerization states). The plasmid conformation may be used as an indicator of plasmid stability, as plasmid multimers are frequently lost during cell division16.
In a recent work, we followed plasmid persistence in conditions that were not selective for plasmid abundance (i.e., without antibiotic selection). We compared plasmid persistence at two different temperatures (20 °C and 37 °C) and three population sizes (i.e., dilution rates). Applying various dilution rates, or population bottlenecks, allows for the investigation of the influence of population size on bacterial and plasmid evolution. Based on our results, we propose that plasmids can be neutral to their bacterial host and may evolve stability without any selection pressure8. The evolved plasmid stability is conferred by the reduction of plasmid multimer formation8.
Here, we present a protocol for the quantification of plasmid persistence and investigation of plasmid evolution in regard to the maintenance of antibiotic resistance genes. The method has several steps, including the insertion of an antibiotic resistance gene to a model plasmid (which can be omitted when using a natural resistance plasmid), followed by the use of experimental evolution to assess the potential of the plasmid to persist under nonselective conditions while determining the plasmid frequency dynamics over time using replica plating, and the analysis of the plasmid genome by visualization. The protocol described here was designed to investigate the evolution and persistence of plasmids, but it may also be applied to follow the evolution of chromosomal resistance genes (or other marker genes) over time.
Protocol
1. Construction of a model plasmid carrying an antibiotic resistance gene
NOTE: The strain Escherichia coli K-12 MG1655 was used as the model organism in all experiments (DSM No. 18039, German Collection of Microorganisms and Cell Cultures, DSMZ). The strain E. coli DH5α17 was used during plasmid construction.
- PCR amplify the plasmid backbone of your choice and amplify the resistance gene including the promoter region by PCR (Figure 1).
- PCR amplify the plasmid backbone using a high-fidelity polymerase and the oligonucleotides pBBR1_for (5'-GCGGCCACCGGCTGGCT-3') and pBBR1_rev (5'-TACCGGCGCGGCAGCGTGACCC-3') on the plasmid template pLC (GenBank acc. no. MH238456)18.
- PCR amplify the resistance gene nptII including the native Tn5 promoter19 using a high-fidelity polymerase and oligonucleotides nptII_gib_for (5'-GCGCCGGTAGATCTGCTCATGTTTGAAGCTTCACGCTGCCGCA-3') and nptII_gib_rev (5'-CGGTGGCCGCCAAAAAGGCCATCCGTCAGGTCAGAAGAACTCGT-3'). The nptII gene encodes for a neomycin phosphotransferase and confers resistance to kanamycin.
NOTE: Design the primers for the resistance gene with approximately 20 bp of complementary sequence to the plasmid backbone that it will be fused to.
- Clean both PCR fragments using a kit of your choice.
- Join the purified antibiotic resistance gene PCR product (including its promoter region) to the purified plasmid backbone and fuse the homologous regions using isothermal assembly20, at 50 °C for 60 min.
- Electroporate the fused product into the strain E. coli DH5α.
- Introduce 2 µL of the product from step 1.3 into 40 µL of electrocompetent cells in 2 mm cuvettes at 4 °C and 2.5 kV. Resuspend cells in 1 mL of lysogeny broth (LB) medium.
- Transfer the total volume to a microfuge tube and incubate 1 h at 37 °C shaking at 250 rpm in an orbital shaker to allow for the expression of the resistance marker on the plasmid.
- Plate 100 µL of the cells on LB agar plates containing the appropriate antibiotic (kanamycin 25 µg/mL) to select for the antibiotic resistance gene and thus select for plasmid-carrying cells. Spin down the rest, remove the supernatant, resuspend the cells in 100 µL LB and plate on a selective agar plate. Incubate the plates at 37 °C for 24 h.
- In order to verify clones, extract the constructed plasmids via alkaline lysis using a commercial mini-prep kit.
- Harvest 5 mL of the stationary overnight culture by centrifuging at 12,000 x g at room temperature. Resuspend the cells in resuspension solution, then lyse and neutralize the cell solution. Centrifuge for 5 min at 12,000 x g.
- Transfer the supernatant to the DNA binding column provided in the kit and wash the column twice with 500 µL washing solution centrifuging 2x before eluting the column membrane with elution buffer.
- Perform Sanger sequencing of the plasmid to confirm that the sequence is correct.
- Once the plasmid validity is verified, electroporate the plasmid (now pCON) into the strain E. coli MG1655 as described above. This yields strain E. coli MG1655 pCON.
2. Monitoring plasmid-carrying bacteria under various conditions over time
NOTE: The evolution experiment is conducted with plasmid-carrying strains under nonselective conditions (LB media) in two temperatures (37 °C and 20 °C) and three population bottleneck sizes. The experimental design is used to study plasmid persistence under various conditions.
- Design of an evolution experiment to follow plasmid frequency over time (Figure 2)
- Plate the constructed plasmid-carrying strain (E. coli MG1655 pCON) on LB agar plates supplemented with antibiotics (kanamycin 25 µg/mL) and incubate overnight at 37 °C.
- Prepare 96 deep-well plates with 1 mL of LB medium in each well. As the bacterial ancestors, pick eight random isolated colonies from the agar plate in independent wells. Incubate the plates at 37 °C and 450 rpm on a plate shaker for 24 h. Prepare a frozen glycerol stock of the ancestral clones.
- The next day transfer the eight replicate populations into new deep-well plates according to the experimental design (Figure 2). The cultures are diluted 1:100 (large bottleneck, L), 1:1,000 (medium bottleneck, M), or 1:10,000 (small bottleneck, S) in a total volume of 1 mL LB using PBS for dilution. The diluted cultures are both incubated at 37 °C and 20 °C.
NOTE: It is highly important to control for cross-contamination in the 96-deep-well plate. Thus, use a checkerboard plate design by intercalating inoculated wells with bacteria-free LB medium. Use this pattern through the entire evolution experiment. - The cultures incubated at 37 °C are transferred every 12 h while cultures at 20 °C are transferred every 24 h.
NOTE: During every transfer event the bottleneck size treatment is applied and the serial transfer is repeated over a total of 98 transfers. The number of transfers will depend on the readers' experimental design. - Prepare a frozen glycerol stock of all the populations regularly, 2x a week.
- Monitoring the plasmid frequency by replica plating (Figure 3)
NOTE: During the evolution experiment, the frequency of plasmid-carrying cells in the population is estimated from the proportion of hosts. The replica plating protocol is shown in Figure 3.- To determine the plasmid frequency in the population during the evolution experiment, stationary cultures are serially diluted and plated on nonselective LB agar plates. Adjust the dilution according to a yield of 250-500 colonies per plate.
NOTE: Prepare thick LB agar plates prior to the plating (~30 mL agar). - The plated populations are incubated for overnight growth according to their growth temperature in the experiment.
NOTE: The colonies need to be small, thus incubate <24 h at 37 °C. - After overnight growth, count all colonies using a manual or automated colony count station and calculate the total bacterial population size in the cultures.
NOTE: Colonies at the edge of the agar plate should not be included in the total bacterial cell count. - Sterilize square pieces (~20 x 20 cm) of cotton velvet by autoclaving.
NOTE: The velvet cloth needs to be 100% cotton to be autoclavable. It is important to dry the cloth after sterilization. - After sterilization of the velvet cloth, place the cloth on a round block and fix it with a metal ring. It is crucial to avoid wrinkles. Carefully place the plate with the grown colonies (agar facing down) on the fixed velvet cloth surface. Make sure that all colonies touch the velvet surface by carefully tapping on the Petri dish in a circular manner.
- Carefully remove the LB agar plate and place a selective plate supplemented with antibiotics (kanamycin 25 µg/mL) onto the velvet cloth. Make sure the plate is touching all the velvet by carefully tapping on the Petri dish as described before. Afterwards, remove the plate. Leave the plates at room temperature for overnight growth.
- The next day, evaluate both the LB agar plate and the selective plate. Colonies that grow on the selective media are counted as plasmid hosts (i.e., antibiotic resistant), while colony-free spots are colonies that were plasmid-free and are thus not resistant to the antibiotic (i.e., lost the plasmid). This is done by placing the plates over each other and comparing the growth (i.e., mark any missing colonies) and counting the colony number on both plates. This yields the number of cells that lost the plasmid during the evolution experiment.
- Repeat this procedure along the whole evolution experiment in a regular manner (e.g., every 14 transfers).
- To determine the plasmid frequency in the population during the evolution experiment, stationary cultures are serially diluted and plated on nonselective LB agar plates. Adjust the dilution according to a yield of 250-500 colonies per plate.
3. Visualization of plasmid multimers using gel electrophoresis
NOTE: Plasmid extraction of low-copy plasmids often leads to contamination with host chromosomal DNA that needs to be enzymatically digested prior to visualization.
- Extract plasmid DNA from a 5 mL stationary overnight cell culture using alkaline lysis as described in step 1.5.
- Afterwards, treat the extracted plasmid DNA with an ATP-dependent DNase that only cuts chromosomal DNA to remove chromosomal DNA contamination (see Table of Materials). Incubate at 37 °C for 30 min. Afterwards, clean the DNA using a kit of your choice.
- To create open circle molecules of all plasmid conformations (monomers or multimers), incubate the plasmid DNA samples with a nicking enzyme (Nb.BsrDI) and incubate for 30 min at 65 °C.
- In parallel, to create linear plasmid molecules (i.e., for plasmid size comparison), use a restriction enzyme of your choice (e.g., HindIII) that cleaves the plasmid once.
NOTE: This results in linear DNA plasmid monomers. Open circle molecules do not migrate in a linear manner. - To visualize the plasmid size and conformation, electrophorese the nicked and linear plasmid DNA samples for 120 min at 4.3 V/cm in a 1% (w/v) agarose gel and 1× TAE buffer. The samples are stained with Midori green and the gel is visualized on a gel imaging system (see Table of Materials). Use a 1 kbp ladder.
Results
Here, we present an approach to study plasmid evolution by quantifying plasmid persistence in a population. First, we show how to build the plasmid carrying E. coli strain MG1655 pCON that is subsequently introduced to an evolution experiment. Second, we present a straightforward method to follow plasmid abundance in the evolving bacterial populations. Finally, we show how to visualize plasmid molecule size and conformation.
In our previous work8 using the presented approach we conducted an evolution experiment following the persistence of antibiotic resistance plasmids in E. coli in the absence of antibiotics (Figure 4). Our representative results show the evolution of populations at 37 °C and a dilution rate of 10-4. Following the abundance of plasmid-carrying cells, we observed a decrease in the frequency plasmid-carrying host cells over time (Figure 4). Our approach enabled us to discover that the plasmid loss was a result of the condensed plasmid genome architecture, which led to plasmid instability caused by conflicts introduced by transcription of the resistance gene and replication of the plasmid itself. Visualizing the plasmid molecules enabled us to discover that these conflicts led to an unstable plasmid conformation (i.e., plasmid multimer formation, Figure 5). Nonetheless, we observed plasmid stability evolution without the exposure to antibiotics (Figure 4). The evolved stability was conferred by a plasmid intrinsic duplication that abolished the transcription-replication conflicts and led to the formation of stably inherited plasmids. Our results thus demonstrate the importance of recombination and genome amplification in adaptive evolution of genetic elements.
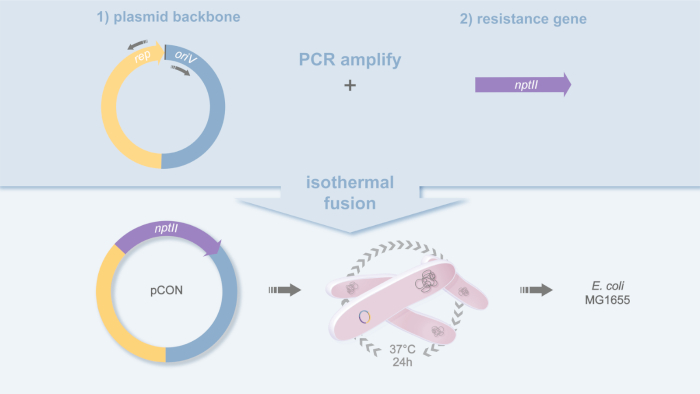
Figure 1: Plasmid design of pCON. Schematic representation of the cloning strategy used to build the plasmid pCON. The plasmid backbone (pBBR1) and antibiotic resistance gene (nptII) are PCR amplified and fused by isothermal fusion20. This yields the plasmid pCON and the strain MG1655 pCON. Please click here to view a larger version of this figure.
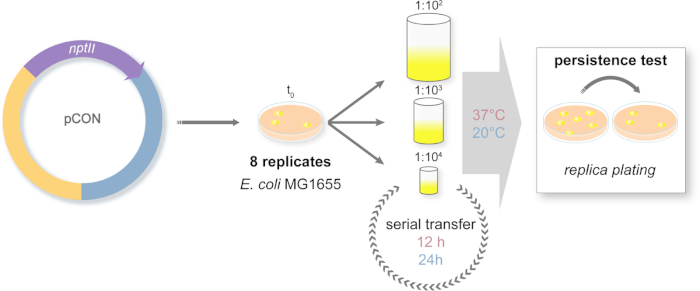
Figure 2: Design of the long-term evolution experiment. Schematic representation of the serial transfer experiment. The plasmid-carrying (pCON) populations are plated on selective media. Ancestral colonies are randomly chosen from the plate and introduced to a serial transfer system. The transfers are conducted with three different dilution approaches to simulate population bottlenecks of different sizes. The dilutions are serially repeated. The experiment is conducted in two temperature regimes. The plasmid-host frequency is measured along the experiment via replica plating. Please click here to view a larger version of this figure.
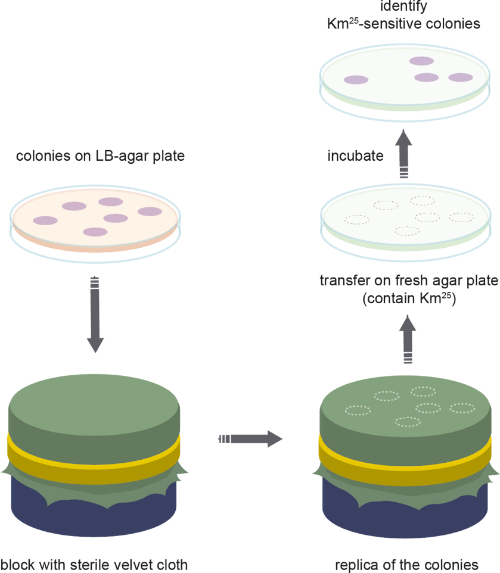
Figure 3: Replica plating. Schematic representation of the steps used in replica plating of bacterial populations. Please click here to view a larger version of this figure.
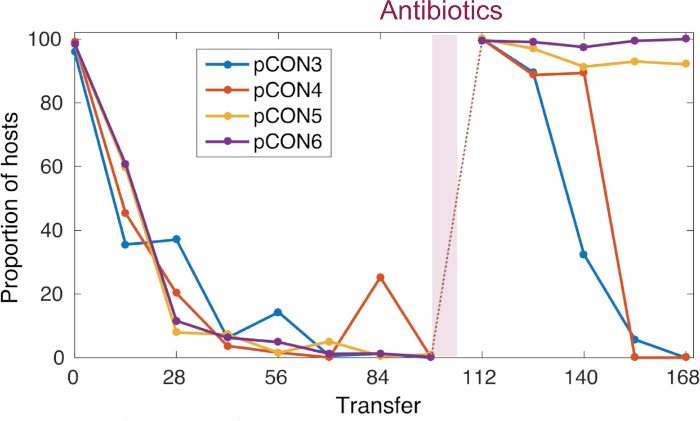
Figure 4: Representative pCON frequency over time. pCON persistence is shown as the proportion of hosts (representative replicate populations) during the evolution experiment. For 98 transfers, pCON plasmid populations evolved under nonselective conditions with a dilution factor of 10-4. All replicates carrying the plasmid pCON decreased in the population. Afterwards, the populations were exposed to antibiotics for overnight incubation and were cultivated again under nonselective conditions to test for plasmid stability evolution. This figure has been modified from Wein et al.8 Please click here to view a larger version of this figure.
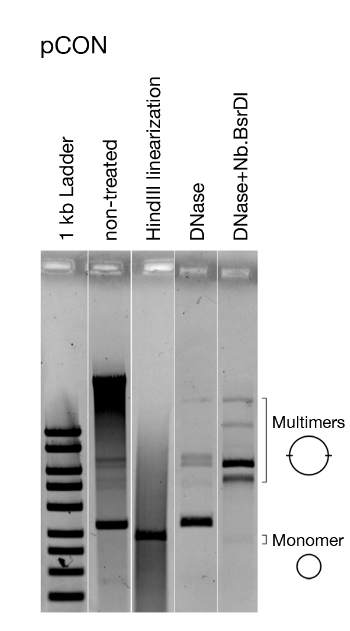
Figure 5: Representative analysis of the plasmid conformation. Visualization of the model plasmid pCON. Visualized is the untreated plasmid DNA directly after extracting, linearized plasmid DNA, and treated with DNase that only cuts chromosomal DNA as well as enzymatically nicked DNA (i.e., open circle plasmid DNA). Linearizing the plasmid shows that all plasmids are of the same size. Removing chromosomal DNA and nicking pCON reveals the presence of dimers and other multimers. This figure has been modified from Wein et al.8. Please click here to view a larger version of this figure.
Discussion
In this protocol, we present an approach that combines techniques in molecular biology, experimental evolution, and DNA visualization to investigate the role of plasmid evolution for the persistence of antibiotic resistance in bacteria. Although the presented approach combines methods from different research areas, all the applied techniques are straightforward and can be performed in a standard microbiology laboratory.
The most critical steps in the protocol include the construction of the model system strain that includes the genetic validation of the plasmid-carrying genotype. Notably, many plasmids naturally encode antibiotic resistance genes. Thus, the reader may omit step 1 of the protocol and directly proceed with step 2. Next, the evolution experiments should include a random design of replicate populations so that the results are not biased by the position of the replicate populations in the deep-well plate. In addition, it is especially important to carefully conduct the serial transfer and dilution steps in the evolution experiment as contamination would falsify the results. Lastly, replica plating should be conducted with great care. Large colony size may be an issue, but it can be avoided by incubating the plates for less than 24 h. Similarly, the number of colonies on one plate might bias replica plating results. Therefore, populations need to be diluted prior to plating and replication.
One of the biggest advantages of our approach is that is can be easily reproduced without the need for heavy equipment. In addition, another advantage of replica plating to follow marker genes is that only live cells are evaluated, in contrast to flow cytometry or qPCR in which dead cells may be evaluated as alive. Thus, replica plating introduces less bias to the counting of plasmid-carrying cells. Nonetheless, one limitation of replica plating may be the population size (i.e., cell number) that is possible to evaluate in one experimental run.
Using our approach, we have recently shown that plasmid stability evolution potentiates the persistence of antibiotic resistance genes in bacteria. Thus, we developed an approach as a tool to follow plasmid-mediated resistance persistence that is of high importance to follow resistance over time especially under conditions without the presence of antibiotics.
Disclosures
The authors have nothing to disclose.
Acknowledgements
We thank Gor Margaryan for creative support and technical assistance. This work was supported by the ZMB Young Scientist Grant 2017/2018 (awarded to TW) and the DFG focus program 1819 (Grant No. DA1202/2-1 awarded to TD).
Materials
| Name | Company | Catalog Number | Comments |
| 96-deep-well plates | Starlab | ||
| 96-deep-well plates | Roth | EN07.1 | 2 ml, square |
| 96-deep-well plates (cryo) | Starlab | E1702-8400 | Micro-Dilution Tube System |
| Colony counter | Stuart | SC6+ | |
| Cotton velvet | drapery shop | 100 % cotton required | |
| Electrophoresis chamber | BioRad | Agarose gel electrophoresis | |
| Electrophoresis power supply | BioRad | 1645070 | Agarose gel electrophoresis |
| Electroporation cuvettes | BioRad | 1652089 | 0.1 cm |
| Electroporator | BioRad | 1652660 | |
| GeneJet Gel Extraction kit | Thermo Fisher Scientific | K0832 | PCR fragment clean-up |
| GeneJet Plasmid Miniprep kit | Thermo Fisher Scientific | K0503 | Plasmid extraction kit |
| Gibson Assembly | New England Biolabs | E2611S | |
| Incubator | Thermo Fisher Scientific | 50125852 | |
| Incubator (plate shaker) | Heidolph | 1000 | |
| Incubator (shaker) | New Brunswick Scientific | Innova 44 | |
| Inoculating loops | Sigma-Aldrich | ||
| Multi-channel pippetes | Eppendorf | 3125000052, 3125000028 | |
| Multi-channel pippetes | Capp | ME8-1250R | |
| NanoDrop 2000/2000c | Thermo Fisher Scientific | ND2000 | |
| Oligonucleotides | Eurofines | ||
| Petri dishes | Sigma-Aldrich | ||
| Phusion Polymerase | Thermo Fisher Scientific | F533S | |
| Pipettes | Eppendorf | 3123000012, 3123000098, 3123000055, 3123000063, | |
| PlasmidSafe enzyme | Epicentre | 10059400 | |
| Reaction tubes | Eppendorf | 30125150 | |
| Replica block & metal ring | VWR | 601-3401 | PVC cylinder 69 mm; ring 102cm |
| Resctriction enzymes | New England Biolabs | ||
| Thermocycler | BioRad | T100 |
References
- San Millan, A. Evolution of plasmid-mediated antibiotic resistance in the clinical context. Trends in Microbiology. 26 (12), 978-985 (2018).
- Bruto, M., James, A., et al. Vibrio crassostreae, a benign oyster colonizer turned into a pathogen after plasmid acquisition. The ISME Journal. 11 (4), 1043-1052 (2017).
- von Wintersdorff, C. J. H., et al. Dissemination of antimicrobial resistance in microbial ecosystems through horizontal gene transfer. Frontiers in Microbiology. 7 (110), 305-310 (2016).
- Lenski, R. E. Experimental evolution and the dynamics of adaptation and genome evolution in microbial populations. ISME Journal. 11 (10), 2181-2194 (2017).
- De Gelder, L., Williams, J. J., Ponciano, J. E. M., Sota, M., Top, E. M. Adaptive plasmid evolution results in host-range expansion of a broad-host-range plasmid. Genetics. 178 (4), 2179-2190 (2008).
- Harrison, E., Guymer, D., Spiers, A. J., Paterson, S., Brockhurst, M. A. Parallel compensatory evolution stabilizes plasmids across the parasitism-mutualism continuum. Current Biology. 25 (15), 2034-2039 (2015).
- Bouma, J. E., Lenski, R. E. Evolution of a bacteria/plasmid association. Nature. 335 (6188), 351-352 (1988).
- Wein, T., Hülter, N. F., Mizrahi, I., Dagan, T. Emergence of plasmid stability under nonselective conditions maintains antibiotic resistance. Nature Communications. 10 (1), 2595(2019).
- Loftie-Eaton, W., et al. Compensatory mutations improve general permissiveness to antibiotic resistance plasmids. Nature Ecology & Evolution. 1 (9), 1354-1363 (2017).
- Millan, A. S., et al. Positive selection and compensatory adaptation interact to stabilize non-transmissible plasmids. Nature Communications. 5 (1), 1-11 (2014).
- Loftie-Eaton, W., Tucker, A., Norton, A., Top, E. M. Flow cytometry and real-time quantitative PCR as tools for assessing plasmid persistence. Applied and Environmental Microbiology. 80 (17), 5439-5446 (2014).
- Münch, K. M., et al. Polar fixation of plasmids during recombinant protein production in Bacillus megaterium results in population heterogeneity. Applied and Environmental Microbiology. 81 (17), 5976-5986 (2015).
- Jahn, M., Vorpahl, C., Hübschmann, T., Harms, H., Müller, S. Copy number variability of expression plasmids determined by cell sorting and Droplet Digital PCR. Microbial Cell Factories. 15 (1), 211(2016).
- Lederberg, J., Lederberg, M. E. Replica plating and indirect selection of bacterial mutants. Journal of Bacteriology. 63, 399-406 (1952).
- Summers, D. K., Sherratt, D. J. Multimerization of high copy number plasmids causes instability: ColE1 encodes a determinant essential for plasmid monomerization and stability. Cell. 36 (4), 1097-1103 (1984).
- Summers, D. K., Beton, C. W., Withers, H. L. Multicopy plasmid instability: the dimer catastrophe hypothesis. Molecular Microbiology. 8 (6), 1031-1038 (1993).
- Hanahan, D. Studies on transformation of Escherichia coli with plasmids. Journal of Molecular Biology. 166 (4), 557-580 (1983).
- Ilhan, J., et al. Segregational drift and the interplay between plasmid copy number and evolvability. Molecular Biology and Evolution. 36 (3), 472-486 (2019).
- Beck, E., Ludwig, G., Auerswald, E. A., Reiss, B., Schaller, H. Nucleotide sequence and exact localization of the neomycin phosphotransferase gene from transposon Tn5. Gene. 19 (3), 327-336 (1982).
- Gibson, D. G., et al. Enzymatic assembly of DNA molecules up to several hundred kilobases. Nature Methods. 6 (5), 343-345 (2009).
Reprints and Permissions
Request permission to reuse the text or figures of this JoVE article
Request PermissionExplore More Articles
This article has been published
Video Coming Soon
Copyright © 2025 MyJoVE Corporation. All rights reserved