
A subscription to JoVE is required to view this content. Sign in or start your free trial.
Method Article
Quantification of Macronutrients Intake in a Thermogenetic Neuronal Screen using Drosophila Larvae
In This Article
Erratum Notice
Summary
Described here is a protocol that enables the colorimetric quantification of the amount of food eaten within a defined interval of time by Drosophila melanogaster larvae exposed to diets of different macronutrient quality. These assays are conducted in the context of a neuronal thermogenetic screen.
Abstract
Foraging and feeding behaviors allow animals to access sources of energy and nutrients essential for their development, health, and fitness. Investigating the neuronal regulation of these behaviors is essential for the understanding of the physiological and molecular mechanisms underlying nutritional homeostasis. The use of genetically tractable animal models such as worms, flies, and fish greatly facilitates these types of studies. In the last decade, the fruit fly Drosophila melanogaster has been used as a powerful animal model by neurobiologists investigating the neuronal control of feeding and foraging behaviors. While undoubtedly valuable, most studies examine adult flies. Here, we describe a protocol that takes advantage of the simpler larval nervous system to investigate neuronal substrates controlling feeding behaviors when larvae are exposed to diets differing in their protein and carbohydrates content. Our methods are based on a quantitative colorimetric no-choice feeding assay, performed in the context of a neuronal thermogenetic-activation screen. As a read-out, the amount of food eaten by larvae over a 1 h interval was used when exposed to one of the three dye-labeled diets that differ in their protein to carbohydrates (P:C) ratios. The efficacy of this protocol is demonstrated in the context of a neurogenetic screen in larval Drosophila, by identifying candidate neuronal populations regulating the amount of food eaten in diets of different macronutrient quality. We were also able to classify and group the genotypes tested into phenotypic classes. Besides a brief review of the currently available methods in the literature, the advantages and limitations of these methods are discussed and, also, some suggestions are provided about how this protocol might be adapted to other specific experiments.
Introduction
All animals depend on a balanced diet to acquire the necessary amounts of nutrients for survival, growth, and reproduction1. The choice of what and how much to eat is influenced by a multitude of interacting factors related to the internal state of the animal, like the satiety level, and environmental conditions, such as food quality2,3,4,5. Protein and carbohydrates are two major macronutrients and its balanced intake is essential to sustain animals’ physiological processes. Therefore, the understanding of the neural mechanisms controlling feeding behaviors and sustaining a balanced intake of these macronutrients is extremely relevant. This is because life history traits like lifespan, fecundity, and metabolic health are directly affected by the levels of protein intake intake6,7,8,9,10.
The use of simpler more tractable organisms that exhibit evolutionarily conserved feeding habits with complex animals, including mammals, is essential to this type of studies. Importantly, these simpler animal models provide a good opportunity to dissect complex biological questions in a costly, ethically and technically more effective context. In the last decades, Drosophila, with its powerful genetic toolkit, intricate and stereotypical behavior and conserved architecture of peripheral and nutrient-sensing mechanisms with mammals, has been a fruitful model for behavioral neurobiologists11. Ultimately, the hope is that by understanding how food intake is regulated in this animal, with a simpler nervous system, we can then begin to untangle neuronal malfunctions underlying human eating disorders.
The study of neuronal substrates for feeding behaviors is deeply dependent on being able to simultaneously measure animals’ food intake while manipulating their neuronal activity. Due to the minimal quantities of food ingested, quantifying the amount of food eaten by flies is extremely challenging, and all methods currently available present significant limitations. Thus, the gold standard is to use a combination of complementary methodologies12. Adult flies have been historically favored as a genetic and behavioral model. Nevertheless, Drosophila larvae, also offer opportunities to investigate neuronal substrates encoding feeding behavior. The larval central nervous system (CNS), with around 12,000 neurons, is significantly less complex than that of the adult, which contains approximately 150,000 neurons. This lower complexity is not only numerical but also functional, since larval behaviors rely on simpler locomotive functions and sensory systems. Despite the apparent simplicity of their nervous systems, larvae still exhibit complete feeding behaviors, and some methods to quantify food ingestion in Drosophila larvae have been described5,13,14,15. By pairing with manipulations of neuronal activity, Drosophila larvae can constitute a highly tractable model for understanding the neural regulation of food intake.
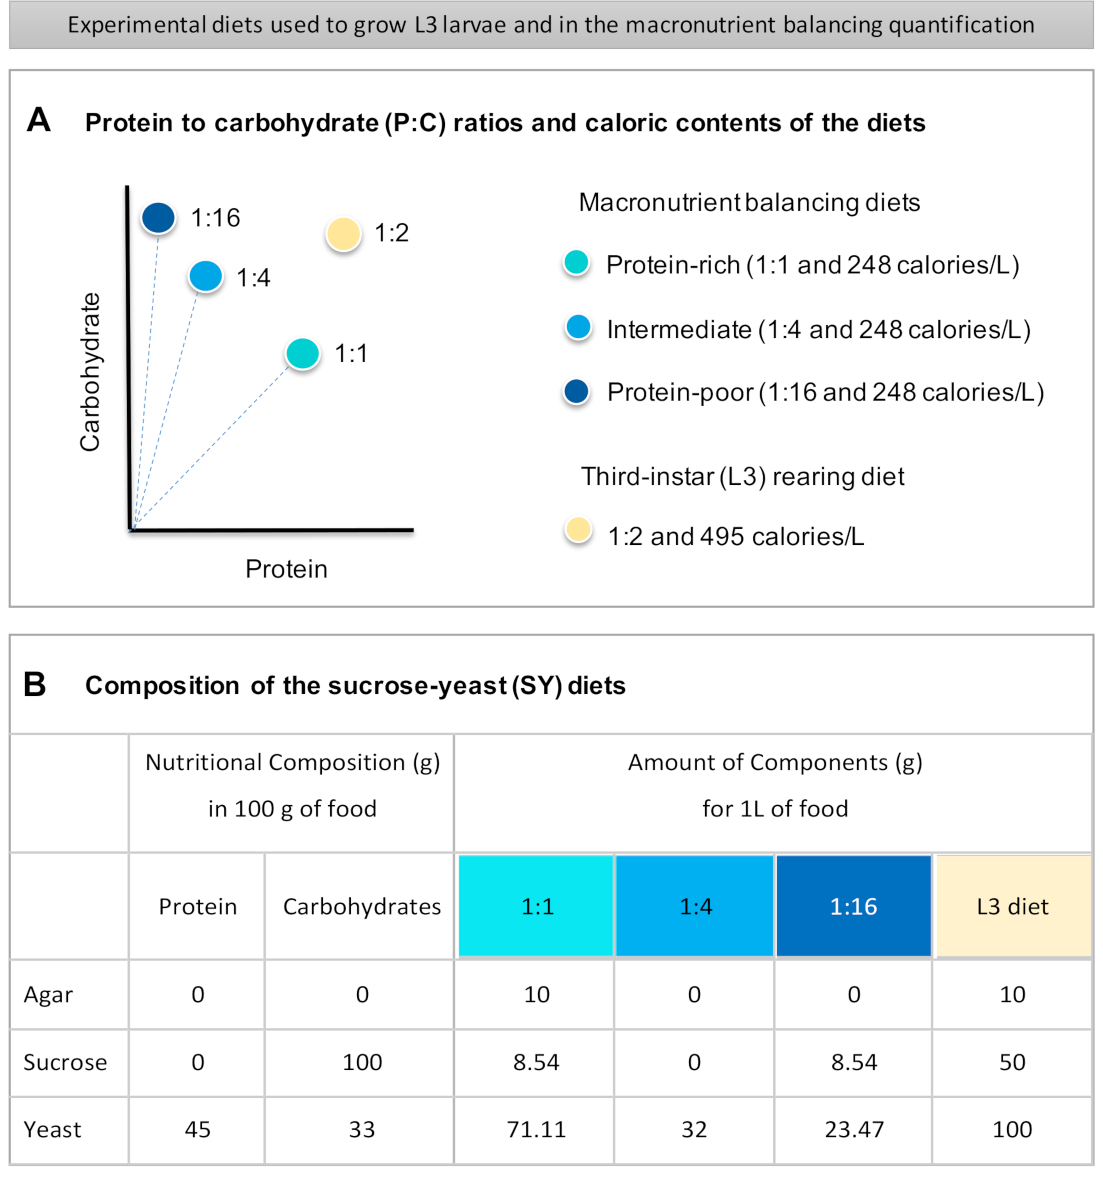
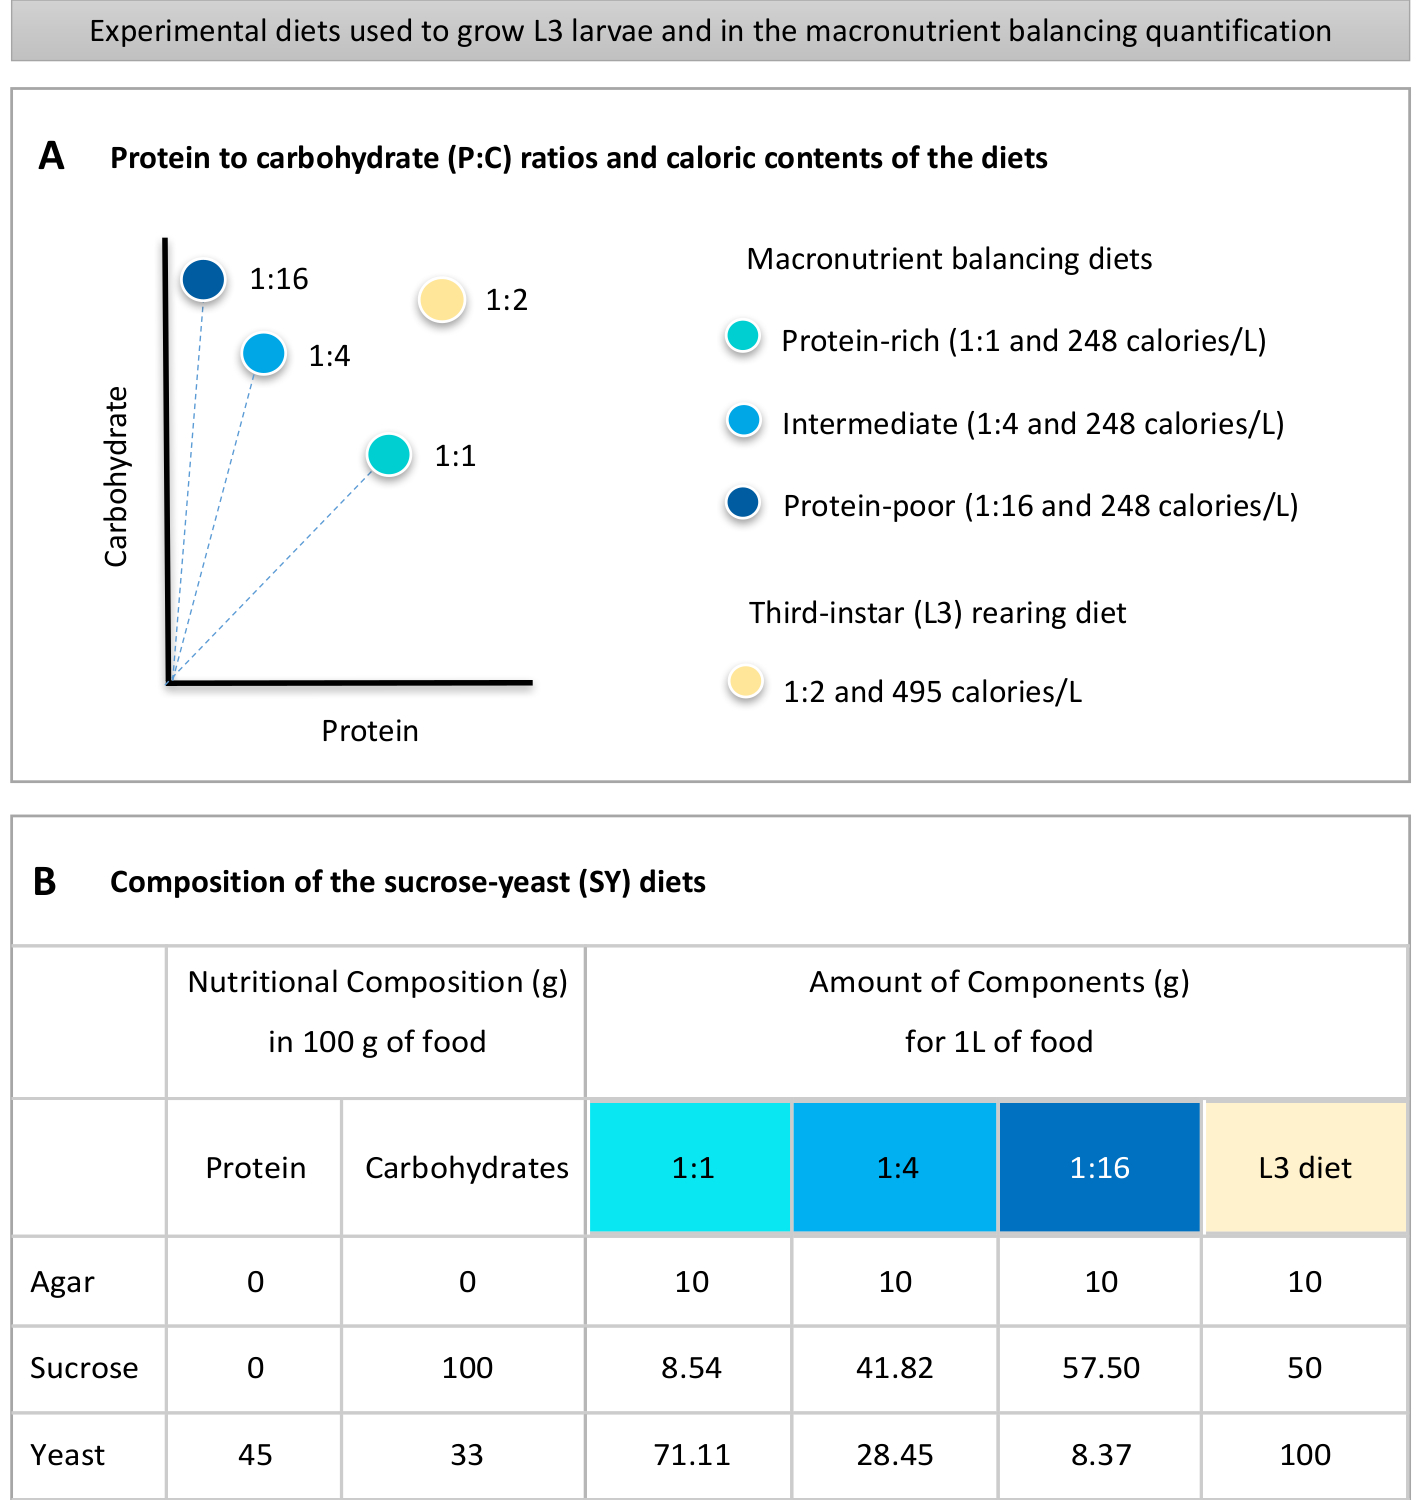
Provided here is a detailed protocol to quantify food intake in larvae exposed to diets of different macronutrient quality. The diets, so-called macronutrient balancing diets, differed in the protein and carbohydrates contents, specifically with respect to the protein to carbohydrate (P:C) ratios: 1:1 (protein-rich diet), 1:4 (intermediate diet), and 1:16 (protein-poor diet), as shown in Figure 1A. Briefly, a quantitative no-choice feeding assay was established using these three isocaloric sucrose-yeast (SY)-based diets dyed with a blue food dye. Because yeast extract and sucrose were used as protein and carbohydrate sources, and both contain carbohydrates, variation in the P:C ratios was obtained by changing the balance of these two components, as previously described16 and as indicated in Figure 1B. A schematic overview of the protocol, showing the main experimental steps, is available in Figure 2.
This protocol was established with the aim of investigating the role of specific neuronal populations on the regulation of larval feeding levels in diets of different P:C ratios and in the context of a thermogenetic neuronal screen. A well-characterized neurogenetic tool was used from the Transient Receptor Potential (TRP) family: Drosophila Transient Receptor Potential channel (dTRPA1), which is a temperature and voltage-gated cation channel, allowing the firing of action potentials when ambient temperatures rise above 25 ˚C17. To express the dTRPA1 transgene, we took advantage of the Gal4 lines based on cis-regulatory regions from the Drosophila genome, established in the Rubin laboratory, in the context of the FlyLight project at Janelia Research Campus18,19.
Although the protocol, here described, has been established in the context of an activation screen, it can be easily adapted by the experimenter to other specific needs or interests, namely to perform a suppression screen using the temperature sensitive neuronal silencer ShibireTS20, in alternative to dTRPA1. This and other adaptions are discussed in the protocol and discussion sections.
Access restricted. Please log in or start a trial to view this content.
Protocol
1. Preparation of the sucrose-yeast (SY) diets
- Weigh all the dry ingredients (agar, yeast, sucrose) for the macronutrient balancing and L3 rearing diets. The amounts in grams for each of the ingredients needed to prepare 1 L of food are indicated in Figure 1B.
NOTE: Take into account that approximately 13 mL of food is needed to fill a 60-mm Petri dish. - Dissolve all ingredients in sterile distilled water (use approximately 50% of the total volume of water needed to prepare the food) and stir the medium for 5-10 min.
- Autoclave for 50 min.
- After allowing the mediums to cool down, add nipagin and propionic acid solutions to the diets, at a final concentration (v/v) of 3% and 0.3%, respectively. To the macronutrient balancing diets, add blue food dye to a final concentration (v/v) of 1%. Complete the total volumes with distilled water.
- Carefully pour the food diets to 60 mm Petri dishes, so that the quantity of food poured is approximately the same in each one of the plates. Label the plates with the P:C ratios of the diets.
NOTE: Prepare the macronutrient balancing diets on the day of the feeding assay. If not possible, store the prepared diets at 4 ˚C, in a sealed container, for a maximum duration of 3 days. Longer storage periods render the diet too dry and hard, and the larvae cannot burrow into the medium.
2. Genetic cross of parental lines
NOTE: Use the Gal4/UAS system21 to set up the genetic crosses. In this protocol, in order to activate neuronal function in specific neuronal populations, female virgins of the UAS dTRPA1 line17 were used and crossed to males from the Janelia Gal4 lines (Figure 2A). The genetic control used was the progeny of a cross between the dTRPA1 line and an “empty GAL4” line, which carries Gal4 in the vector used to generate the Rubin Gal4 collection but with no regulatory fragment present (attP2)22. To promote the neuronal suppression, a UAS line encoding ShibireTS20 can be used, instead of dTRPA1.
- Set up 60 mm embryo collection cages with L3 rearing diet plates, supplemented with some active yeast paste.
- Transfer the adult UAS dTRPA1 female virgins and Janelia Gal4 males, aged 5-8 days, to the embryo collection cages and allow the mating to occur for 24-48 h, at 25 °C, with 60% humidity and a 12:12 light-dark cycle (Figure 2A). For 60 mm embryo collection cages, use around 100 virgin females and 30 males per cross.
- In the end of the mating period, remove and discard the L3 rearing diet plates used in the genetic crosses. Substitute them for fresh L3 rearing diet plates, in order to perform the egg lays and larval staging.
3. Preparation of third-instar larvae (L3)
- Transfer the mated adult flies to fresh L3 rearing diet plates and allow the egg-laying to occur for 3-4 h, at 25 °C (Figure 2B). Make sure that all the plates are labeled with the genotype, P:C ratio of the diet and date of the egg lay.
NOTE: To save time, perform the egg-laying directly into the L3 rearing diet, which avoids extra handling of the eggs. In the case of small-scale genetic screenings, optimization of the egg-laying can be obtained by using apple juice agar plates. - In the end of the egg laying period, remove the plates from the cages and cover them with plastic lids. In case yeast extract is used to supplement the L3 rearing plates, make sure to remove all the residual yeast in the end of the egg laying. This is important to avoid non-uniform feeding during the larval growth.
NOTE: The mated adults can be transferred to fresh L3 rearing diet plates, so more egg lays are performed, and more experimental larvae can be obtained. Consecutive egg-lays can be performed with the same adults during one entire working week. - Estimate the number of eggs per plate and keep the larval density to a maximum of 200 embryos per plate. This estimation can be done by counting the number of embryos in one quarter of the plate.
NOTE: An overcrowded plate will delay larval development and affect larval feeding behaviors. - Incubate the L3 rearing plates at 18 ˚C (permissive temperature), 60% humidity and a 12:12 light-dark cycle, and allow the larvae to grow for 9 days (Figure 2B).
- On the ninth day after egg laying (AEL), collect three groups of 10 L3 from each of the genotypes (and for the replicates) to be tested. Additionally, collect groups of 10 L3 for the “zero-dye food” control. Ensure that the larvae collection is done during equivalent time periods of the day used to do the egg lay (e.g., if the egg laying occurred between 10am-2pm, collect the larvae during the same period of time 9 days AEL) and is performed, as gently as possible, by using forceps #5 or a featherweight forceps. Directly transfer the larvae as indicated in next step (3.6).
NOTE: The "zero-dye food" control animals are larvae that in the feeding assay are given food without blue-dye. This control is imperative to remove the background absorbance of th larval extracts. - Transfer the collected experimental larvae to plastic dish weight boats containing 1 mL of water. Make sure L3 are collected, and not L2, by following the directions given in Figure 3.
NOTE: The collection of L3 to plastic boats containing water or 1x Phosphate-buffered saline (PBS), is important to keep larvae well hydrated before the start of the feeding assay. This is especially important if several experimental L3 groups from different genotypes are being collected at the same time. Keep track of the collection order for each group, so differences in the duration of food-deprivation for each group are minimized. The use of plastic boats in this step facilitates the optional step 4.3 as it enables larvae to float directly into the water bath.
4. Thermogenetic activation and no-choice feeding assay
NOTE: It is recommended to perform the feeding assays at approximately the same time of the day to minimize possible variations related to the circadian rhythms. Also, always run the control experiments (the progeny of the “empty Gal4” line crossed to UAS dTRPA1 and the “zero-dye food” larvae), in parallel with the genotypes of interest.
- Set up an incubator to 30 ˚C (non-permissive temperature) and keep high levels of humidity (at least 65%) to avoid larval dehydration during the assay.
- Before starting the feeding assay, equilibrate the assay plates’ temperature by warming them at 30 ˚C for 30 min.
- (Optional) Heat-shock the experimental larvae for 2 min in a 37 ˚ C water bath. Perform this step with the animals in the plastic weight boats containing some water.
NOTE: The aim of this step is to intensify the neuronal activation by promoting the firing of the neurons since the beginning of the feeding assay. - Keep multiple timers set for 1 h ready. The number of timers to be used depends on the number of experimental groups being tested and on the experimenter’s skillfulness level on handling larvae.
NOTE: The use of multiple timers is critical to keep the duration of the assay consistent for all the genotypes. - Carefully drain the water from the plastic boats and, using a moistened soft brush, gently transfer the L3 groups from the boats to the center of the assay plates. Put the plates’ lids back and start a timer for each plate (or group of plates) to maintain accurate 1-h feeding sessions.
- Allow the larvae to feed for 1 h, at 30 ˚C, in the dark (Figure 2C).
NOTE: The performance of the assay in the dark is important to control for differences in the visual cues across diets, as the diets will differ in tones, even though they contain the same dye concentration. - Stop the feeding assay by transferring the plates to an ice bath. Press down the ice as much as possible to provide a stable surface for the plates.
NOTE: Cold temperatures will promote the end of the feeding by inhibiting burrowing and digging behaviors. Most of the larvae will surface the food plates after some minutes, facilitating their recovery in the following steps.
5. Food dye extraction
- Prepare 2 mL microtubes for each group of 10 L3 tested, containing approximately the same amounts of 0.5 mm-glass beads (enough to fill the bottom portion of the microtube) and 300 μL of ice-cold methanol. Keep the microtubes in the cold, using a bench cooler.
CAUTION: Methanol is highly flammable and toxic. Follow all safety procedures recommended for handling this reagent, including working in a well-ventilated area and wearing nitrile gloves.
NOTE: The use of methanol is important to fix the larval samples and avoid melanization reactions in the cuticle. - Using #5 or featherweight-forceps, carefully recover the groups of 10 L3 from the feeding assay plates and transfer them to the lids of the assay plates containing some water. Rinse the larvae to remove any food debris on their bodies while gently handling the larvae to avoid any injuries. Keep a record of the number of larvae recovered for each genotype per replicate, so that the mean amount of food intake per larva can be quantified.
NOTE: Injured larvae should be discarded as they will have melanized cuticle, being unsuitable for colorimetric quantification. - Transfer the L3 groups to the 2 mL microtubes prepared in 5.1.
- Lyse the larval tissues to extract the food dye from the guts by a mechanical lysis method using a tissue lyzer and glass beads added in step 5.1. (if a tissue lyzer is not available, use a homogenizing pestle). Preferentially, perform this step at 4 °C (Figure 2D).
NOTE: The duration of this step will depend on the equipment used. Using a conventional tissue lyser, 1 min extraction is sufficient. In case of time constrictions, the protocol can be paused in the end of this step and proceeded later. Store the samples at -20 °C. - Transfer the extracts to clean 1.5 mL microtubes, by directly inverting the 2 mL microtubes onto the new 1.5 mL microtubes. If performed gently, most of the glass beads will stay at the bottom of the 2 mL microtube.
- Clear the cellular debris by centrifuging the extracts, at a maximum speed for 10 min, at 4 °C.
- Collect the supernatants to clean 1.5 mL microtubes. If cellular debris are still visible in the supernatants, repeat steps 5.6 and 5.7.
6. Colorimetric quantification of food consumption
- Prepare standard solutions, to generate a calibration curve, by performing serial 1:2 dilutions in methanol of a starting blue dye solution. As blank, use methanol only. The concentration of the standards is dependent on the animals’ levels of food intake.
NOTE: In the case of the pilot screen presented here, as the dye concentrations obtained for the larval extracts ranged from 0.02 to 1.93 μL/mL, it was used a standard curve obtained by measuring the absorbances of 8 serial dilutions of a 2 μL/mL blue-dye solution in methanol. If needed, increase or decrease the concentration of these solutions, depending on the dye concentration of the experimental samples. - Transfer 100 μL of the experimental samples (obtained in step 5.7), standards and blank (step 6.1) to the wells of a 96-well microplate and measure the absorbance at 600 nm, using a plate reader (Figure 2E). To remove the background absorbance, measure the absorbance of extracts obtained from larvae fed on food without blue-dye as a “zero” for the larval extracts (“zero-dye food control).
- Generate a standard curve and correlate the absorbance values obtained for the samples from each experimental larval group with the amount of food intake (volume in mL). Find the average food consumption per larva by taking into account the number of larvae collected for each group in the step 5.2
Access restricted. Please log in or start a trial to view this content.
Results
Drosophila larvae regulate their protein intake at the cost of ingesting excess carbohydrates23 (schematic plot in Figure 2E). Actually, this prioritization of protein intake has been observed in many other animals and is called the protein leveraging24,25.
Taking advantage of this robust feeding behavioral response, a behavior-based screen was designed aiming to identify n...
Access restricted. Please log in or start a trial to view this content.
Discussion
With this protocol, one could test the ability of larvae under thermogenetic-activation of specific neuronal populations to regulate the intake levels of protein and carbohydrates, two major macronutrients, when exposed to diets of different P:C composition. This method was tested in the context of a larval preliminary screening aiming to identify neuronal populations associated with the control of food intake across diets of different macronutrient quality. This work also contributes to demonstrating that Drosophila...
Access restricted. Please log in or start a trial to view this content.
Disclosures
The authors have nothing to disclose.
Acknowledgements
We would like to thank to Instituto Gulbenkian de Ciência (IGC) for providing us access to part of the experimental equipment described in this protocol. This work was supported by Portuguese Foundation for Science and Technology (FCT), LISBOA-01-0145-FEDER-007660, PTDC/NEU- NMC/2459/2014, IF/00697/2014 and La Caixa HR17-00595 to PMD and by an Australian Research Council Future Fellowship (FT170100259) to CKM.
Access restricted. Please log in or start a trial to view this content.
Materials
| Name | Company | Catalog Number | Comments |
| 1.5 mL microtubes | Sarstedt AG & Co. | 72.690.001 | |
| 10xPBS | Nytech | MB18201 | |
| 2.0 mL microtubes | Sarstedt AG & Co. | 72.695.500 | |
| 60 mm petri dishes | Greiner Bio-one, Austria | 628161 | |
| 96 well microplates | Santa Cruz Biotechnology | SC-204453 | |
| Agar | Pró-vida, Portugal | ||
| Bench cooler | Nalgene, USA | Labtop Cooler 5115-0032 | |
| Blue food dye | Rayner, Billingshurst, UK | ||
| Cell disruption media | Scientific Industries, Inc. | 888-850-6208 | (0.5 mm glass beads) |
| Dish weight boats | Santa Cruz Biotechnology | SC-201606 | |
| Embryo collection cage for 60 mm petri dishes | Flystuff, Scientific Laboratory Supplies, UK | FLY1212 (59-100) | |
| Featherweight forceps | BioQuip Products, USA | 4750 | |
| Fly food for stocks maintenance | 1 L food contains: 10 g Agar, 100 g Yeast Extract, 50 g Sucrose, 30 mL Nipagin, 3 mL propionic acid | ||
| Forceps #5 | Dumont | 0108-5-PS | Standard tips, INOX, 11cm |
| Incubator | LMS Ltd, UK | Series 2, Model 230 | For thermogenetic feeding assay (30?C) |
| Incubator | Percival Scientific, USA | DR36NL | To stage larvae (19?C) |
| Janelia lines | Janelia Research Campus | Detailed information in Table 2 | |
| Macronutrient balancing diets | Composition and nutritional information in Figure 1 | ||
| Methanol | VWR | CAS number: 67-56-1 | |
| Nipagin (Methyl 4-hydroxybenzoate) | Sigma-Aldrich | H5501 | |
| Nitrile gloves | VWR, USA | ||
| Refrigerated centrifuge | Eppendorf, Germany | 5804 R / Serial number: 5805CI364293 | |
| Rubin Gal4 ines | Janelia Research Campus | Stoks available at Bloomington Drosophila Stock Center | |
| ShibireTS UAS line | Bloomington Drosophila Stock Center | BDSC number: 66600 | Provided by Carlos Ribeiro Group |
| Soft brushes | For sorting anaesthetised fruit flies | ||
| Spectrophotometer plate reader | Thermo Fisher Scientific | Multiskan Go 51119300 | |
| Stereo microscope | Nikon | 1016625 | |
| Sucrose | Sidul, Portugal | ||
| Third-instar larvae (L3) rearing diet | Composition and nutritional information in Figure 1 | ||
| Timer | |||
| Tissue lyzer / bead beater | MP Biomedicals, USA | FastPrep-24 6004500 | |
| TRPA1 UAS line | Bloomington Drosophila Stock Center | BDSC number: 26264 | Expresses TrpA1 under UAS control; may be used to activate neurons experimentally at 25 ?C |
| Water bath | Sheldon Manufacturing Inc., USA | W20M-2 / 03068308 / 9021195 | |
| Yeast extract | Pró-vida, Portugal | 51% Protein, 15% Carbohydrate |
References
- Raubenheimer, D. Nature of nutrition - a unifying framework from animal adaptation to human. , (2012).
- Carvahlo, M. J. a, Mirth, C. K. Coordinating morphology with behavior during development: an integrative approach from a fly perspective. Frontiers in Ecology and Evolution. , (2015).
- Steck, K., et al. Internal amino acid state modulates yeast taste neurons to support protein homeostasis in Drosophila. Elife. 7, 31625(2018).
- Itskov, P. M., Ribeiro, C. The dilemmas of the gourmet fly: the molecular and neuronal mechanisms of feeding and nutrient decision making in Drosophila. Frontiers in Neuroscience. 7, 12(2013).
- Bjordal, M., Arquier, N., Kniazeff, J., Pin, J. P., Leopold, P. Sensing of amino acids in a dopaminergic circuitry promotes rejection of an incomplete diet in Drosophila. Cell. 156 (3), 510-521 (2014).
- Grandison, R. C., Piper, M. D., Partridge, L. Amino-acid imbalance explains extension of lifespan by dietary restriction in Drosophila. Nature. 462 (7276), 1061-1064 (2009).
- Lee, K. P., et al. Lifespan and reproduction in Drosophila: New insights from nutritional geometry. Proceedings of the National Academy of Sciences of the United States of America. 105 (7), 2498-2503 (2008).
- Levine, M. E., et al. Low protein intake is associated with a major reduction in IGF-1, cancer, and overall mortality in the 65 and younger but not older population. Cell Metabolism. 19 (3), 407-417 (2014).
- Solon-Biet, S. M., et al. The ratio of macronutrients, not caloric intake, dictates cardiometabolic health, aging, and longevity in ad libitum-fed mice. Cell Metabolism. 19 (3), 418-430 (2014).
- Piper, M. D., et al. A holidic medium for Drosophila melanogaster. Nature Methods. 11 (1), 100-105 (2014).
- Jones, W. D. The expanding reach of the GAL4/UAS system into the behavioral neurobiology of Drosophila. BMB Reports. 42 (11), 705-712 (2009).
- Deshpande, S. A., et al. Quantifying Drosophila food intake: comparative analysis of current methodology. Nature Methods. 11 (5), 535-540 (2014).
- Neckameyer, W. S. A trophic role for serotonin in the development of a simple feeding circuit. Developmental Neuroscience. 32 (3), 217-237 (2010).
- Gasque, G., Conway, S., Huang, J., Rao, Y., Vosshall, L. B. Small molecule drug screening in Drosophila identifies the 5HT2A receptor as a feeding modulation target. Scientific Reports. 3, (2013).
- Schoofs, A., et al. Selection of motor programs for suppressing food intake and inducing locomotion in the Drosophila brain. PLoS Biology. 12 (6), 1001893(2014).
- Pocas, G. M., Crosbie, A. E., Mirth, C. K. When does diet matter? The roles of larval and adult nutrition in regulating adult size traits in Drosophila melanogaster. Journal of Insect Physiology. , 104051(2020).
- Hamada, F. N., et al. An internal thermal sensor controlling temperature preference in Drosophila. Nature. 454 (7201), 217-220 (2008).
- Pfeiffer, B. D., et al. Tools for neuroanatomy and neurogenetics in Drosophila. Proceedings of the National Academy of Sciences of the United States of America. 105 (28), 9715-9720 (2008).
- Jenett, A., et al. A GAL4-driver line resource for Drosophila neurobiology. Cell Reports. 2 (4), 991-1001 (2012).
- Kitamoto, T. Conditional modification of behavior in Drosophila by targeted expression of a temperature-sensitive shibire allele in defined neurons. Journal of Neurobiology. 47 (2), 81-92 (2001).
- Brand, A. H., Perrimon, N. Targeted gene expression as a means of altering cell fates and generating dominant phenotypes. Development. 118 (2), 401-415 (1993).
- Shirangi, T. R., Stern, D. L., Truman, J. W. Motor control of Drosophila courtship song. Cell Reports. 5 (3), 678-686 (2013).
- Mirth, C. M. J. Food intake and food choice are altered by the developmental transition at critical weight in Drosophila melanogaster. Animal Behaviour. 126, 195-208 (2017).
- Simpson, S. J., Raubenheimer, D. Obesity: the protein leverage hypothesis. Obesity Reviews. 6 (2), 133-142 (2005).
- Raubenheimer, D., Simpson, S. J. Integrative models of nutrient balancing: application to insects and vertebrates. Nutrition Research Reviews. 10 (1), 151-179 (1997).
- Li, H. H., et al. A GAL4 driver resource for developmental and behavioral studies on the larval CNS of Drosophila. Cell Reports. 8 (3), 897-908 (2014).
- Bhatt, P. K., Neckameyer, W. S. Functional analysis of the larval feeding circuit in Drosophila. Journal of Visualized Experiments. (81), e51062(2013).
- Wong, R., Piper, M. D. W., Blanc, E., Partridge, L. Pitfalls of measuring feeding rate in the fruit fly Drosophila melanogaster. Nature Methods. 5 (3), 214-215 (2008).
- Almeida-Carvalho, M. J., et al. The Ol1mpiad: concordance of behavioural faculties of stage 1 and stage 3 Drosophila larvae. Journal of Experimental Biology. 220, Pt 13 2452-2475 (2017).
- Rodrigues, M. A., et al. Drosophila melanogaster larvae make nutritional choices that minimize developmental time. Journal of Insect Physiology. 81, 69-80 (2015).
- Wong, R., Piper, M. D., Wertheim, B., Partridge, L. Quantification of food intake in Drosophila. PLoS One. 4 (6), 6063(2009).
- Wu, Q., et al. Developmental control of foraging and social behavior by the Drosophila neuropeptide Y-like system. Neuron. 39 (1), 147-161 (2003).
- Wu, Q., Zhang, Y., Xu, J., Shen, P. Regulation of hunger-driven behaviors by neural ribosomal S6 kinase in Drosophila. Proceedings of the National Academy of Sciences of the United States of America. 102 (37), 13289-13294 (2005).
- Lingo, P. R., Zhao, Z., Shen, P. Co-regulation of cold-resistant food acquisition by insulin- and neuropeptide Y-like systems in Drosophila melanogaster. Neuroscience. 148 (2), 371-374 (2007).
Access restricted. Please log in or start a trial to view this content.
Erratum
Formal Correction: Erratum: Quantification of Macronutrients Intake in a Thermogenetic Neuronal Screen using Drosophila Larvae
Posted by JoVE Editors on 10/06/2020. Citeable Link.
An erratum was issued for: Quantification of Macronutrients Intake in a Thermogenetic Neuronal Screen using Drosophila Larvae. A figure was updated.
Figure 1 was updated from:
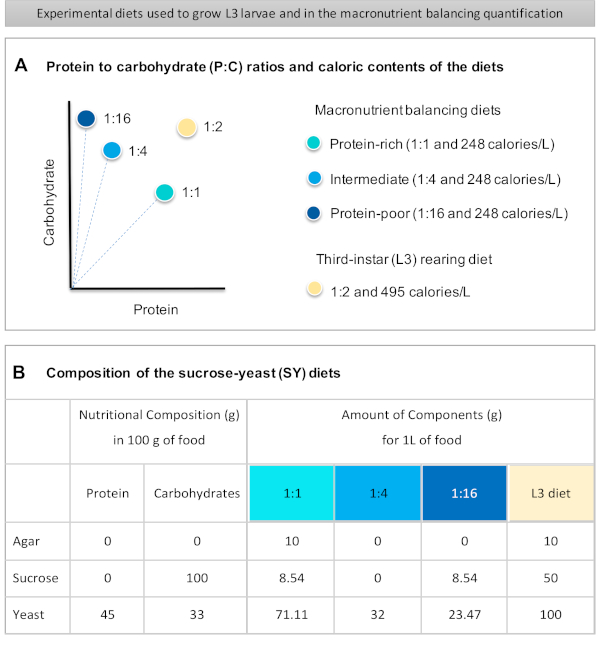
Figure 1: The sucrose-yeast (SY) diets used in our protocol. (A) The blue dots represent the isocaloric (248 calories/L) macronutrient balancing diets used in the feeding assay, which differ in the protein to carbohydrate (P:C) ratios: 1:1, 1:4 and 1:16. The beige dot represents the diet used to rear the experimental third-instar larvae (L3), which contained a P:C ratio of 1:2 and a caloric density of 495 calories/L. (B) Detailed composition and nutritional information of the sucrose-yeast (SY) based diets. The components are the same for all the diets: agar, sucrose and yeast. The amount in grams of the components needed to prepare 1 L of diet is shown. Note that 1% (v/v) of blue dye must be added to the macronutrient balancing diets and to the L3 rearing diet nipagin and propionic acid solutions must be added to a final concentration (v/v) of 3% and 0.3%, respectively. Please click here to view a larger version of this figure.
to:
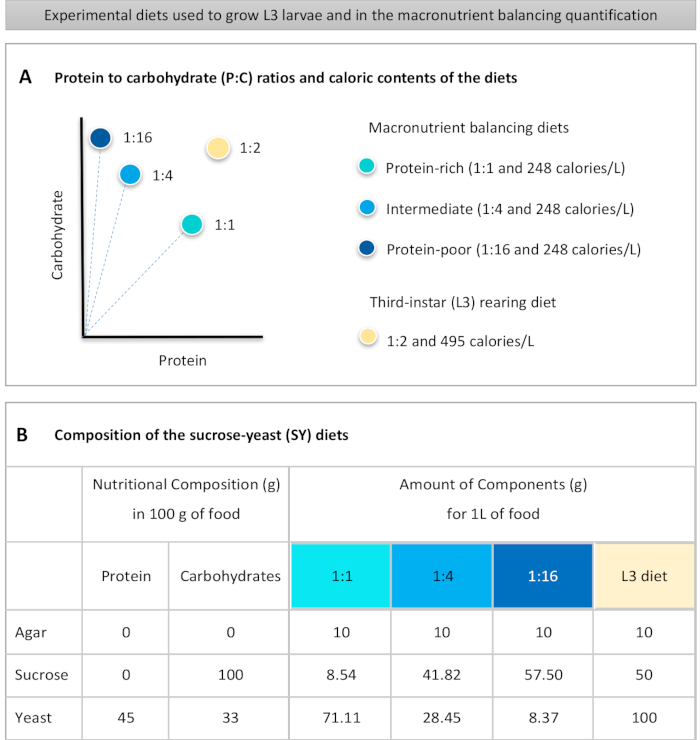
Figure 1: The sucrose-yeast (SY) diets used in our protocol. (A) The blue dots represent the isocaloric (248 calories/L) macronutrient balancing diets used in the feeding assay, which differ in the protein to carbohydrate (P:C) ratios: 1:1, 1:4 and 1:16. The beige dot represents the diet used to rear the experimental third-instar larvae (L3), which contained a P:C ratio of 1:2 and a caloric density of 495 calories/L. (B) Detailed composition and nutritional information of the sucrose-yeast (SY) based diets. The components are the same for all the diets: agar, sucrose and yeast. The amount in grams of the components needed to prepare 1 L of diet is shown. Note that 1% (v/v) of blue dye must be added to the macronutrient balancing diets and to the L3 rearing diet nipagin and propionic acid solutions must be added to a final concentration (v/v) of 3% and 0.3%, respectively. Please click here to view a larger version of this figure.
Reprints and Permissions
Request permission to reuse the text or figures of this JoVE article
Request PermissionThis article has been published
Video Coming Soon
Copyright © 2025 MyJoVE Corporation. All rights reserved