
A subscription to JoVE is required to view this content. Sign in or start your free trial.
Method Article
Improving Reproducibility to Meet Minimal Information for Studies of Extracellular Vesicles 2018 Guidelines in Nanoparticle Tracking Analysis
In This Article
Summary
Nanoparticle tracking analysis (NTA) is a widely used method to characterize extracellular vesicles. This paper highlights NTA experimental parameters and controls plus a uniform method of analysis and characterization of samples and diluents necessary to supplement the guidelines proposed by MISEV2018 and EV-TRACK for reproducibility between laboratories.
Abstract
Nanoparticle tracking analysis (NTA) has been one of several characterization methods used for extracellular vesicle (EV) research since 2006. Many consider that NTA instruments and their software packages can be easily utilized following minimal training and that size calibration is feasible in-house. As both NTA acquisition and software analysis constitute EV characterization, they are addressed in Minimal Information for Studies of Extracellular Vesicles 2018 (MISEV2018). In addition, they have been monitored by Transparent Reporting and Centralizing Knowledge in Extracellular Vesicle Research (EV-TRACK) to improve the robustness of EV experiments (e.g., minimize experimental variation due to uncontrolled factors).
Despite efforts to encourage the reporting of methods and controls, many published research papers fail to report critical settings needed to reproduce the original NTA observations. Few papers report the NTA characterization of negative controls or diluents, evidently assuming that commercially available products, such as phosphate-buffered saline or ultrapure distilled water, are particulate-free. Similarly, positive controls or size standards are seldom reported by researchers to verify particle sizing. The Stokes-Einstein equation incorporates sample viscosity and temperature variables to determine particle displacement. Reporting the stable laser chamber temperature during the entire sample video collection is, therefore, an essential control measure for accurate replication. The filtration of samples or diluents is also not routinely reported, and if so, the specifics of the filter (manufacturer, membrane material, pore size) and storage conditions are seldom included. The International Society for Extracellular Vesicle (ISEV)'s minimal standards of acceptable experimental detail should include a well-documented NTA protocol for the characterization of EVs. The following experiment provides evidence that an NTA analysis protocol needs to be established by the individual researcher and included in the methods of publications that use NTA characterization as one of the options to fulfill MISEV2018 requirements for single vesicle characterization.
Introduction
Accurate and repeatable analysis of EVs and other nanometer-scaled particles presents numerous challenges across research and industry. Replication of EV research has been difficult, in part, due to the lack of uniformity in reporting necessary parameters associated with data collection. To address these deficiencies, the ISEV proposed industry guidelines as a minimal set of biochemical, biophysical, and functional standards for EV researchers and published them as a position statement, commonly referred to as MISEV20141. The accelerating pace of EV research required an updated guideline, and the "MISEV2018: a position statement of the ISEV" expanded the MISEV2014 guidelines2. The MISEV2018 paper included tables, outlines of suggested protocols, and steps to follow to document specific EV-associated characterization. As a further measure to facilitate interpretation and replication of experiments, EV-TRACK was developed as a crowd-sourcing knowledgebase (http://evtrack.org) to enable more transparent reporting of EV biology and the methodology used for published results3. Despite these recommendations for standardized reporting of methods, the field continues to suffer regarding replicating and confirming published results.
Fitting with the National Institutes of Health's and National Science Foundation's effort for quality assessment tools, this paper suggests that ISEV requires standardized reporting of methods and details so that data assessment tools might be applied with the goal of replicating results between laboratories. Reporting cell sources, cell culture procedures, and EV isolation methods are important factors to define the qualities of the EV population. Among NTA instruments, factors such as detection settings, the refractive index of carrier fluid, heterogeneous particle populations contributing to polydispersity, lack of standardized reporting requirements, and absent intra- and inter-observer measurement results make NTA comparison between labs difficult or impossible.
In use since 2006, NTA is a popular method for nanoparticle size and concentration determination that is currently used by approximately 80% of EV researchers4. The MISEV2018 Guidelines require two forms of single-vesicle analysis, of which NTA is one of the popular options. NTA continues to be in common use for EV characterization due to its wide accessibility, low cost per sample, and its straightforward founding theory (the Stokes-Einstein equation). EV assessment by NTA generates a particle size distribution and concentration estimate using laser light scattering and Brownian motion analysis, with the lower limit of detection determined by the refractive index of the EV. When using a fluid sample of known viscosity and temperature, the trajectories of the EVs are tracked to determine their mean-square displacement in two dimensions. This allows the particle diffusion coefficient to be calculated and converted into a sphere-equivalent hydrodynamic diameter by a modified Stokes-Einstein equation5,6,7. NTA's particle-to-particle analysis has less interference by agglomerates or larger particles in a heterogeneous population of EVs than other methods of characterization7. While a few larger particles have minimal impact on sizing accuracy, the presence of even minute amounts of large, high light-scattering particles results in a notable reduction in the detection of smaller particles due to reduced software EV detection and tracking8. As a measurement technique, NTA is generally considered not to be biased toward larger particles or aggregates of particles but can resolve multiple-sized populations through individual particle analysis9. Because of the use of light-scattering by particles, one of the limitations of NTA analysis is that any particulate such as dust, plastic, or powder with similar refraction and size attributes compared to EVs cannot be differentiated from actual EVs by this method of characterization.
The NanoSight LM10 (nanoparticle size analyzer) and LM14 (laser module) have been sold since 2006, and although newer models of this instrument have been developed, this particular model is found in many core facilities and is considered a reliable workhorse. Training is needed to properly optimize the NTA settings for high-resolution measurements of size and concentration. The two important settings needed for optimum video recordings are (1) the camera level and (2) the detection threshold. These must be set by the operator based on the sample's characteristics. One of the major constraints of NTA analysis is the recommendation of sample concentrations between 107 and 109 particles/mL, to achieve this sample dilution may be required10. Solutions used for dilution, such as phosphate-buffered saline, 0.15 M saline, or ultrapure water, are rarely free of particles less than 220 µm in size, which may affect the NTA measurements. NTA characterization of the solutions used for dilution should be performed at the same camera level and detection threshold as the nanoparticle samples that are being analyzed.The size and concentration of nanoparticles present in diluents used for EV sample dilutions are seldom included in publications involving NTA analysis of EVs.
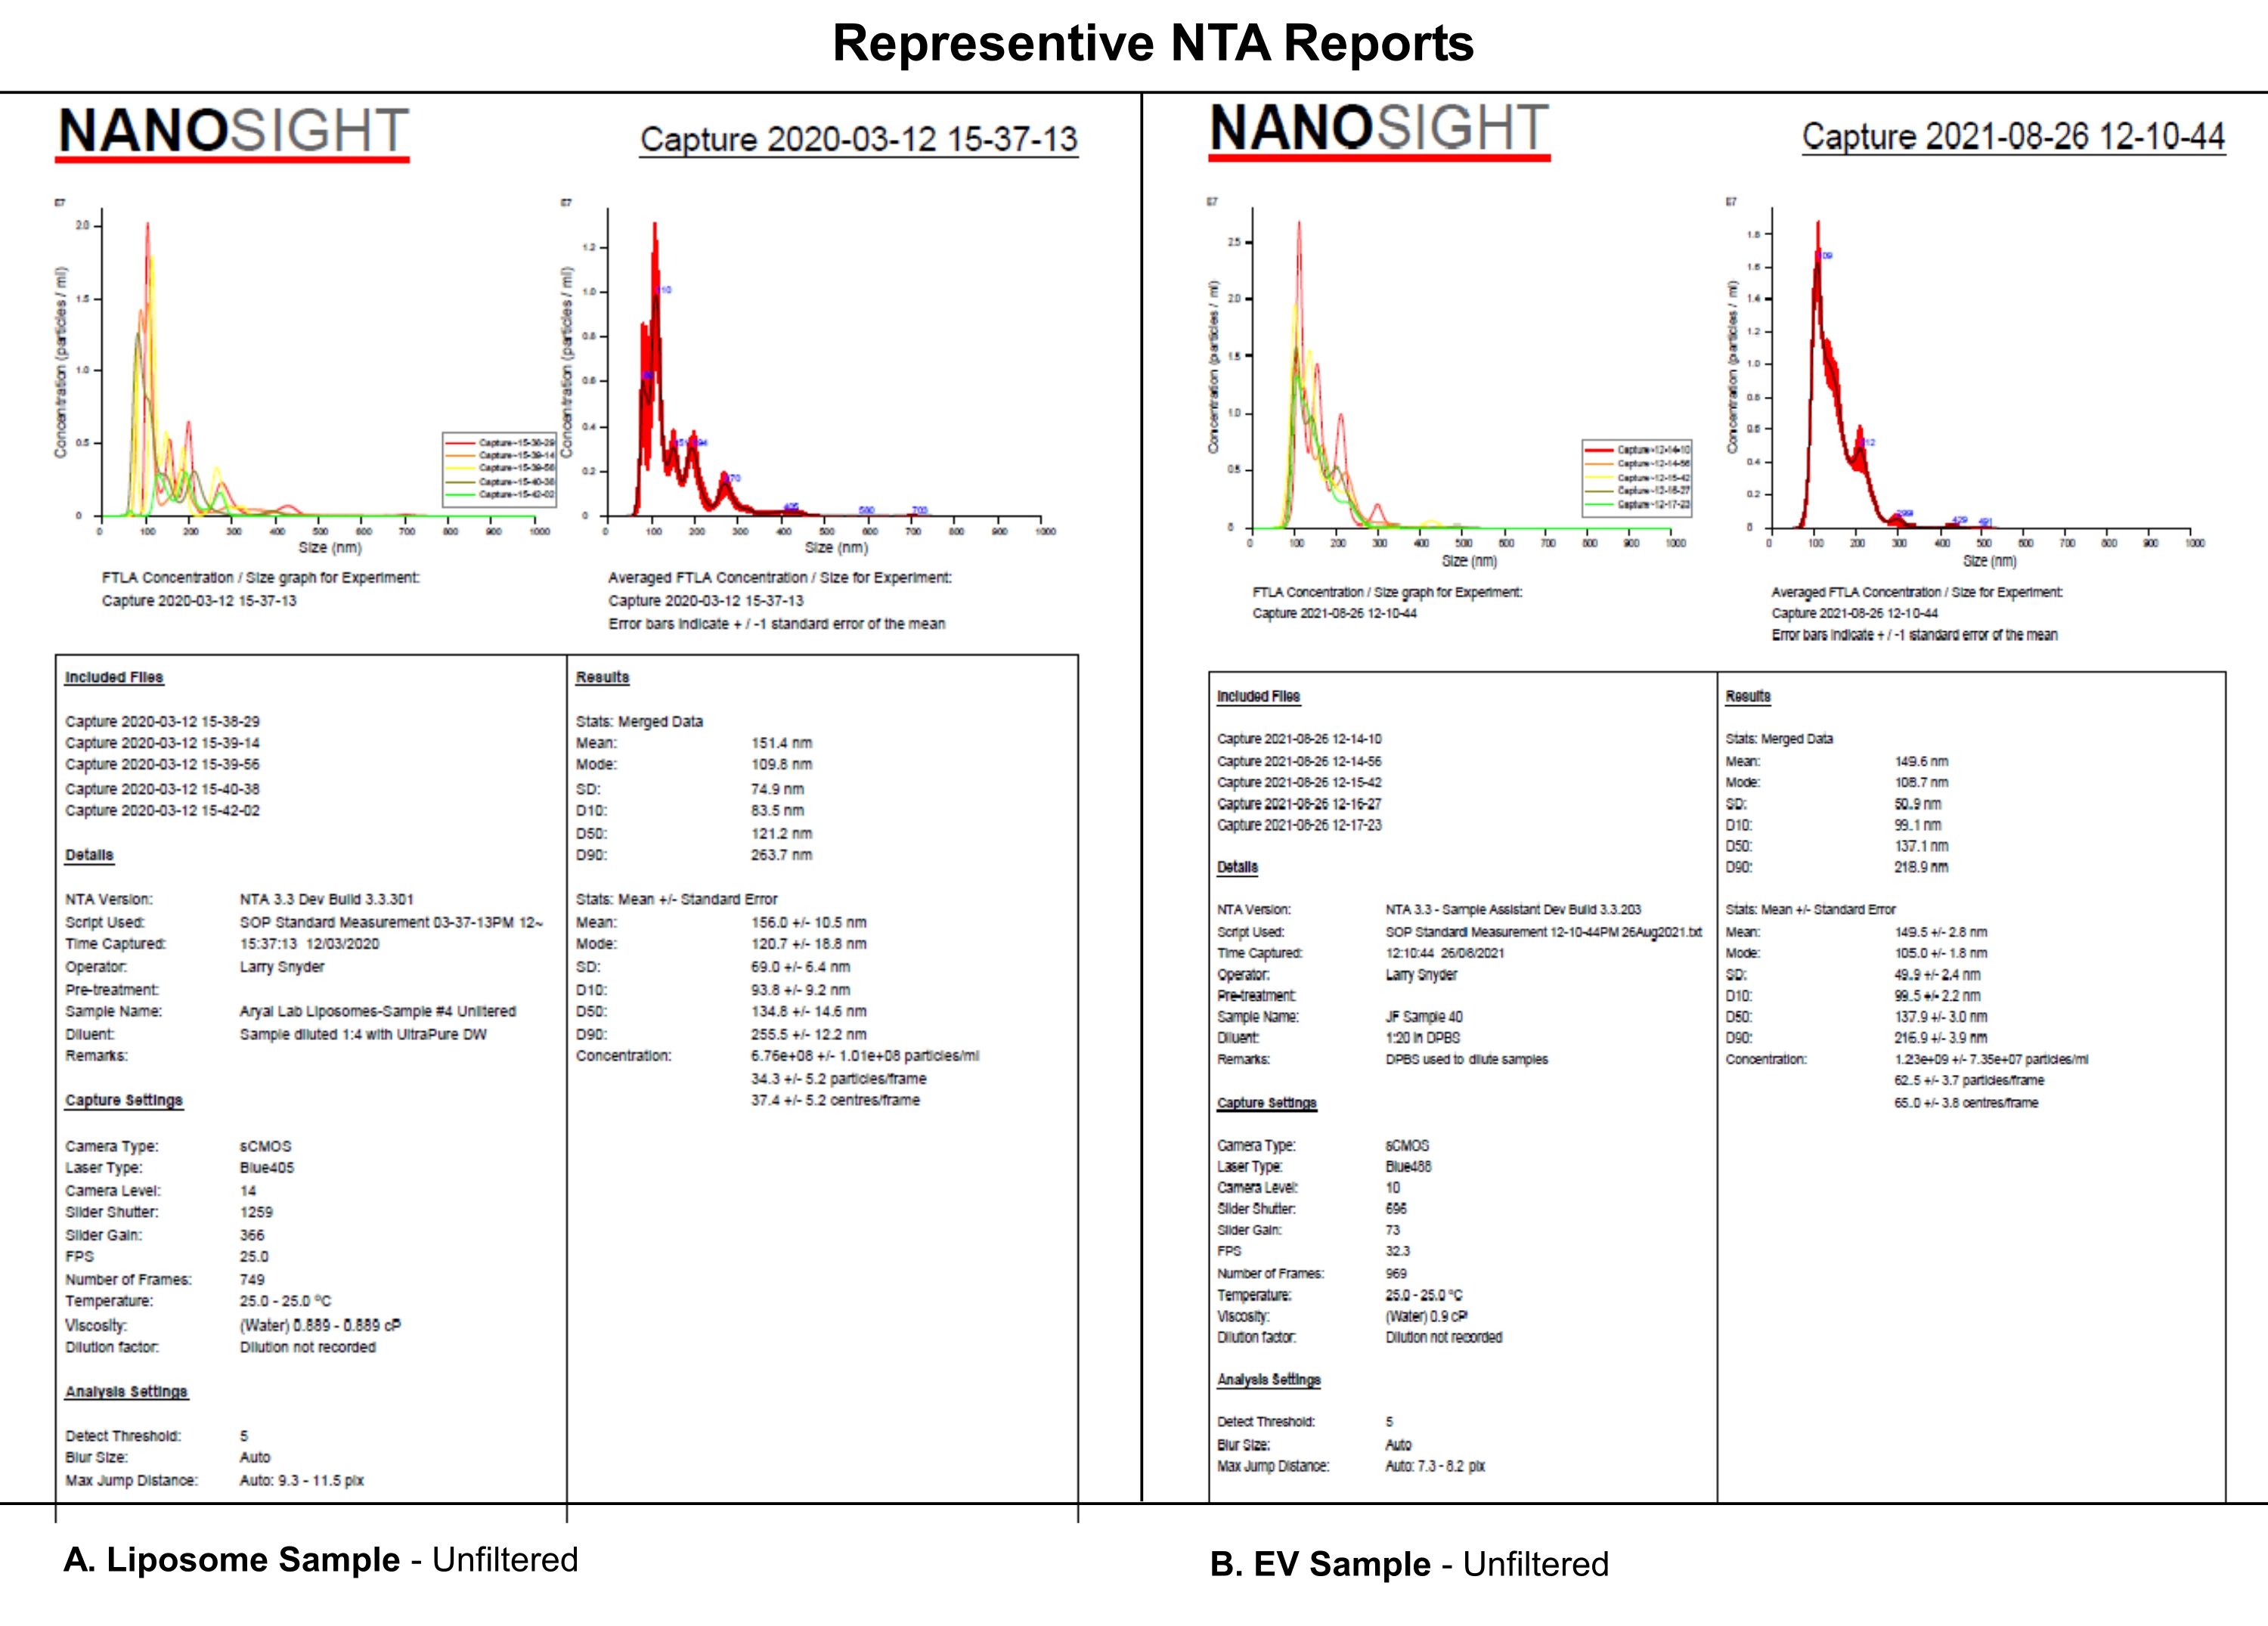
This protocol uses NTA analysis of synthetic EV-like liposomes evaluated using selected camera levels, detection thresholds, and mechanical filtering of the samples to analyze the systematic effects of camera level, detection threshold, or sample filtration on the NTA dataset. Liposomes were synthesized as described in Supplemental File S1. Synthetic liposomes were used in this experiment because of their size uniformity, physical characteristics, and stability in storage at 4 °C. Although actual samples of EVs could have been used, the heterogenicity and stability of EVs during storage may have complicated this study and its interpretation. Similarities in the NTA reports from (A) liposomes and (B) EVs indicate that the systematic effects revealed for liposomes in this paper will likely also apply to EV characterization (Figure 1). Together, these findings support the notion that complete reporting of critical software settings and the description of sample processing, such as diluent, dilution, and filtration, impact the reproducibility of NTA data.
The purpose of this paper is to demonstrate that varying the NTA settings (temperature, camera level, and detection threshold) and sample preparation changes the results collected: systematic, significant differences in size and concentration were obtained. As NTA is one of the popular options to fulfill the MISEV2018 characterization specification, these results demonstrate the importance of reporting sample preparation and NTA settings to ensure reproducibility.

Figure 1: Representative NTA reports to compare liposomes to EVs. (A) Liposomes: unfiltered sample characterized on NTA on 12 March 2020. (B) EVs: unfiltered sample characterized on NTA on 26 August 2021. Abbreviations: NTA = Nanoparticle tracking analysis; EVs = extracellular vesicles. Please click here to view a larger version of this figure.
Access restricted. Please log in or start a trial to view this content.
Protocol
1. General protocol guidelines
- Maintain the microscope on an air table or at a minimum on a vibration-free table. Ensure that extraneous vibrations (e.g., foot tapping on the floor, touching the table, door closures, laboratory traffic) are kept to a minimum.
- Set and maintain the temperature of the laser module at a constant temperature for all video recordings.
NOTE: The temperature chosen was 25 °C because the nanoparticle size analyzer was calibrated at that temperature. Therefore, it is important that all users of the instrument know and use the calibrated temperature. Room temperature is not an acceptable setting because it can vary. - Ensure that all diluents, also called negative controls (e.g., Dulbecco's Phosphate-buffered Saline (DPBS), ultrapure distilled water [DW]), are all NTA-characterized using the same camera level and detection threshold as the nanoparticle samples being measured. Use characterized DPBS for the flushing of the laser module and dilution of samples. Factor contaminants in the negative control DPBS into sample results if their levels are significant.
- Store samples at 4 °C prior to evaluation and never freeze them as this would degrade the liposome sample. Warm samples/standards/diluents to room temperature for 30 min prior to analysis.
NOTE: Sample handling was specific to the material being examined. - Evaluate sample and standards using Quick measurement to establish an appropriate dilution to obtain 107 to 109 particles/mL (approximately 50 to 100 particles/NTA video screen) determined to be optimal for NTA analyses.
NOTE: The authors have found that particle concentrations at the higher end of this range produce more consistent and reproducible results. - Fill in all applicable fields within the Capture box of the SOP tab for both Quick and Standard measurements, including the dilution and diluent used.
2. Preparation of 50 nm and 100 nm size calibration standards
NOTE: See the Table of Materials.
- 50 nm size Transfer Standards diluted 1:5,000
- Add 2 µL of the 50 nm standards to 9,998 µL of 0.22 µm-filtered 10 mM potassium chloride (KCl)/0.03% Tween 20 in ultrapure DW into a twice-rinsed 15 mL conical tube. Store the diluted 50 nm standard at 4 °C for up to a year.
- 100 nm size Transfer Standards diluted 1:333
- Add 30 µL of the 100 nm standards to 9,970 µL of 0.22 µm-filtered 10 mM KCl/0.03% Tween 20 in ultrapure DW into a twice-rinsed 15 mL conical tube. Store the diluted 100 nm standard at 4 °C for up to a year.
3. Cleaning and assembly of the laser module
- Visually inspect the laser module and flow-cell cover windows for scratches or imperfections.
NOTE: If either glass surface is scratched, imaging may be affected. - Clean both glass surfaces gently with a good quality lens cleaner and lens paper. Do not use tissue wipes or paper towels on glass surfaces.
- Ensure that the O-ring seal is properly seated in the groove of the flow-cell cover prior to assembly.
- Place the flow-cell cover on the laser module, ensuring the electrical contacts are in the proper orientation. Place the 4 spring-loaded thumbscrews through the flow-cell plate and engage the threads of the laser module but do not tighten individually.
- Putting uniform pressure down on the flow-cell cover, uniformly tighten the thumbscrews in an alternating diagonal manner until snug. Only tighten the thumbscrews until finger-tight. Do not overtighten.
NOTE: Uneven tightening of the thumbscrews can crack the laser module surface. Newer-designed thumbscrews will "bottom out" at the proper pressure, avoiding possible overtightening.
4. Flushing procedure for the laser module prior to and between samples
- Use a newly opened container of DPBS and aliquot into triple-rinsed 15 mL polypropylene tubes. Ensure that products used to flush or dilute samples are NTA-characterized prior to use (see step 1.3).
- Flush two 1 mL tuberculin syringes with slip lock adaptors 3 times with 1 mL of DPBS to remove any particulate residues. Use either port as the input but use it consistently during the experiment. Do not use larger syringes due to the danger of breaking syringe ports from the increased weight and size of the syringe.
- Remove and discard the plunger from the 1st tuberculin syringe and insert it into the remaining port to serve as a voided diluent/sample reservoir.
NOTE: Failure to remove the plunger will cause increased pressure in the sample chamber and leakage around the seal. - Fill the 2nd syringe with 1 mL of DPBS and attach it to the inlet port of the flow-cell cover.
- Hold the laser module tilted with the outlet syringe port elevated to allow air to be purged from the chamber as the DPBS is injected slowly into the laser module.
- Flush the remaining DPBS from the laser module by injecting 1 mL of air into the inlet port. Repeat flushing 2 more times.
- Empty the laser module as completely as possible after the last flush.
NOTE: Thorough, careful flushing is necessary following NTA analysis of the 50 nm standard, as these particles persist in the laser module. The laser module is now ready to be used.
5. Placement of the laser module on the microscope stage
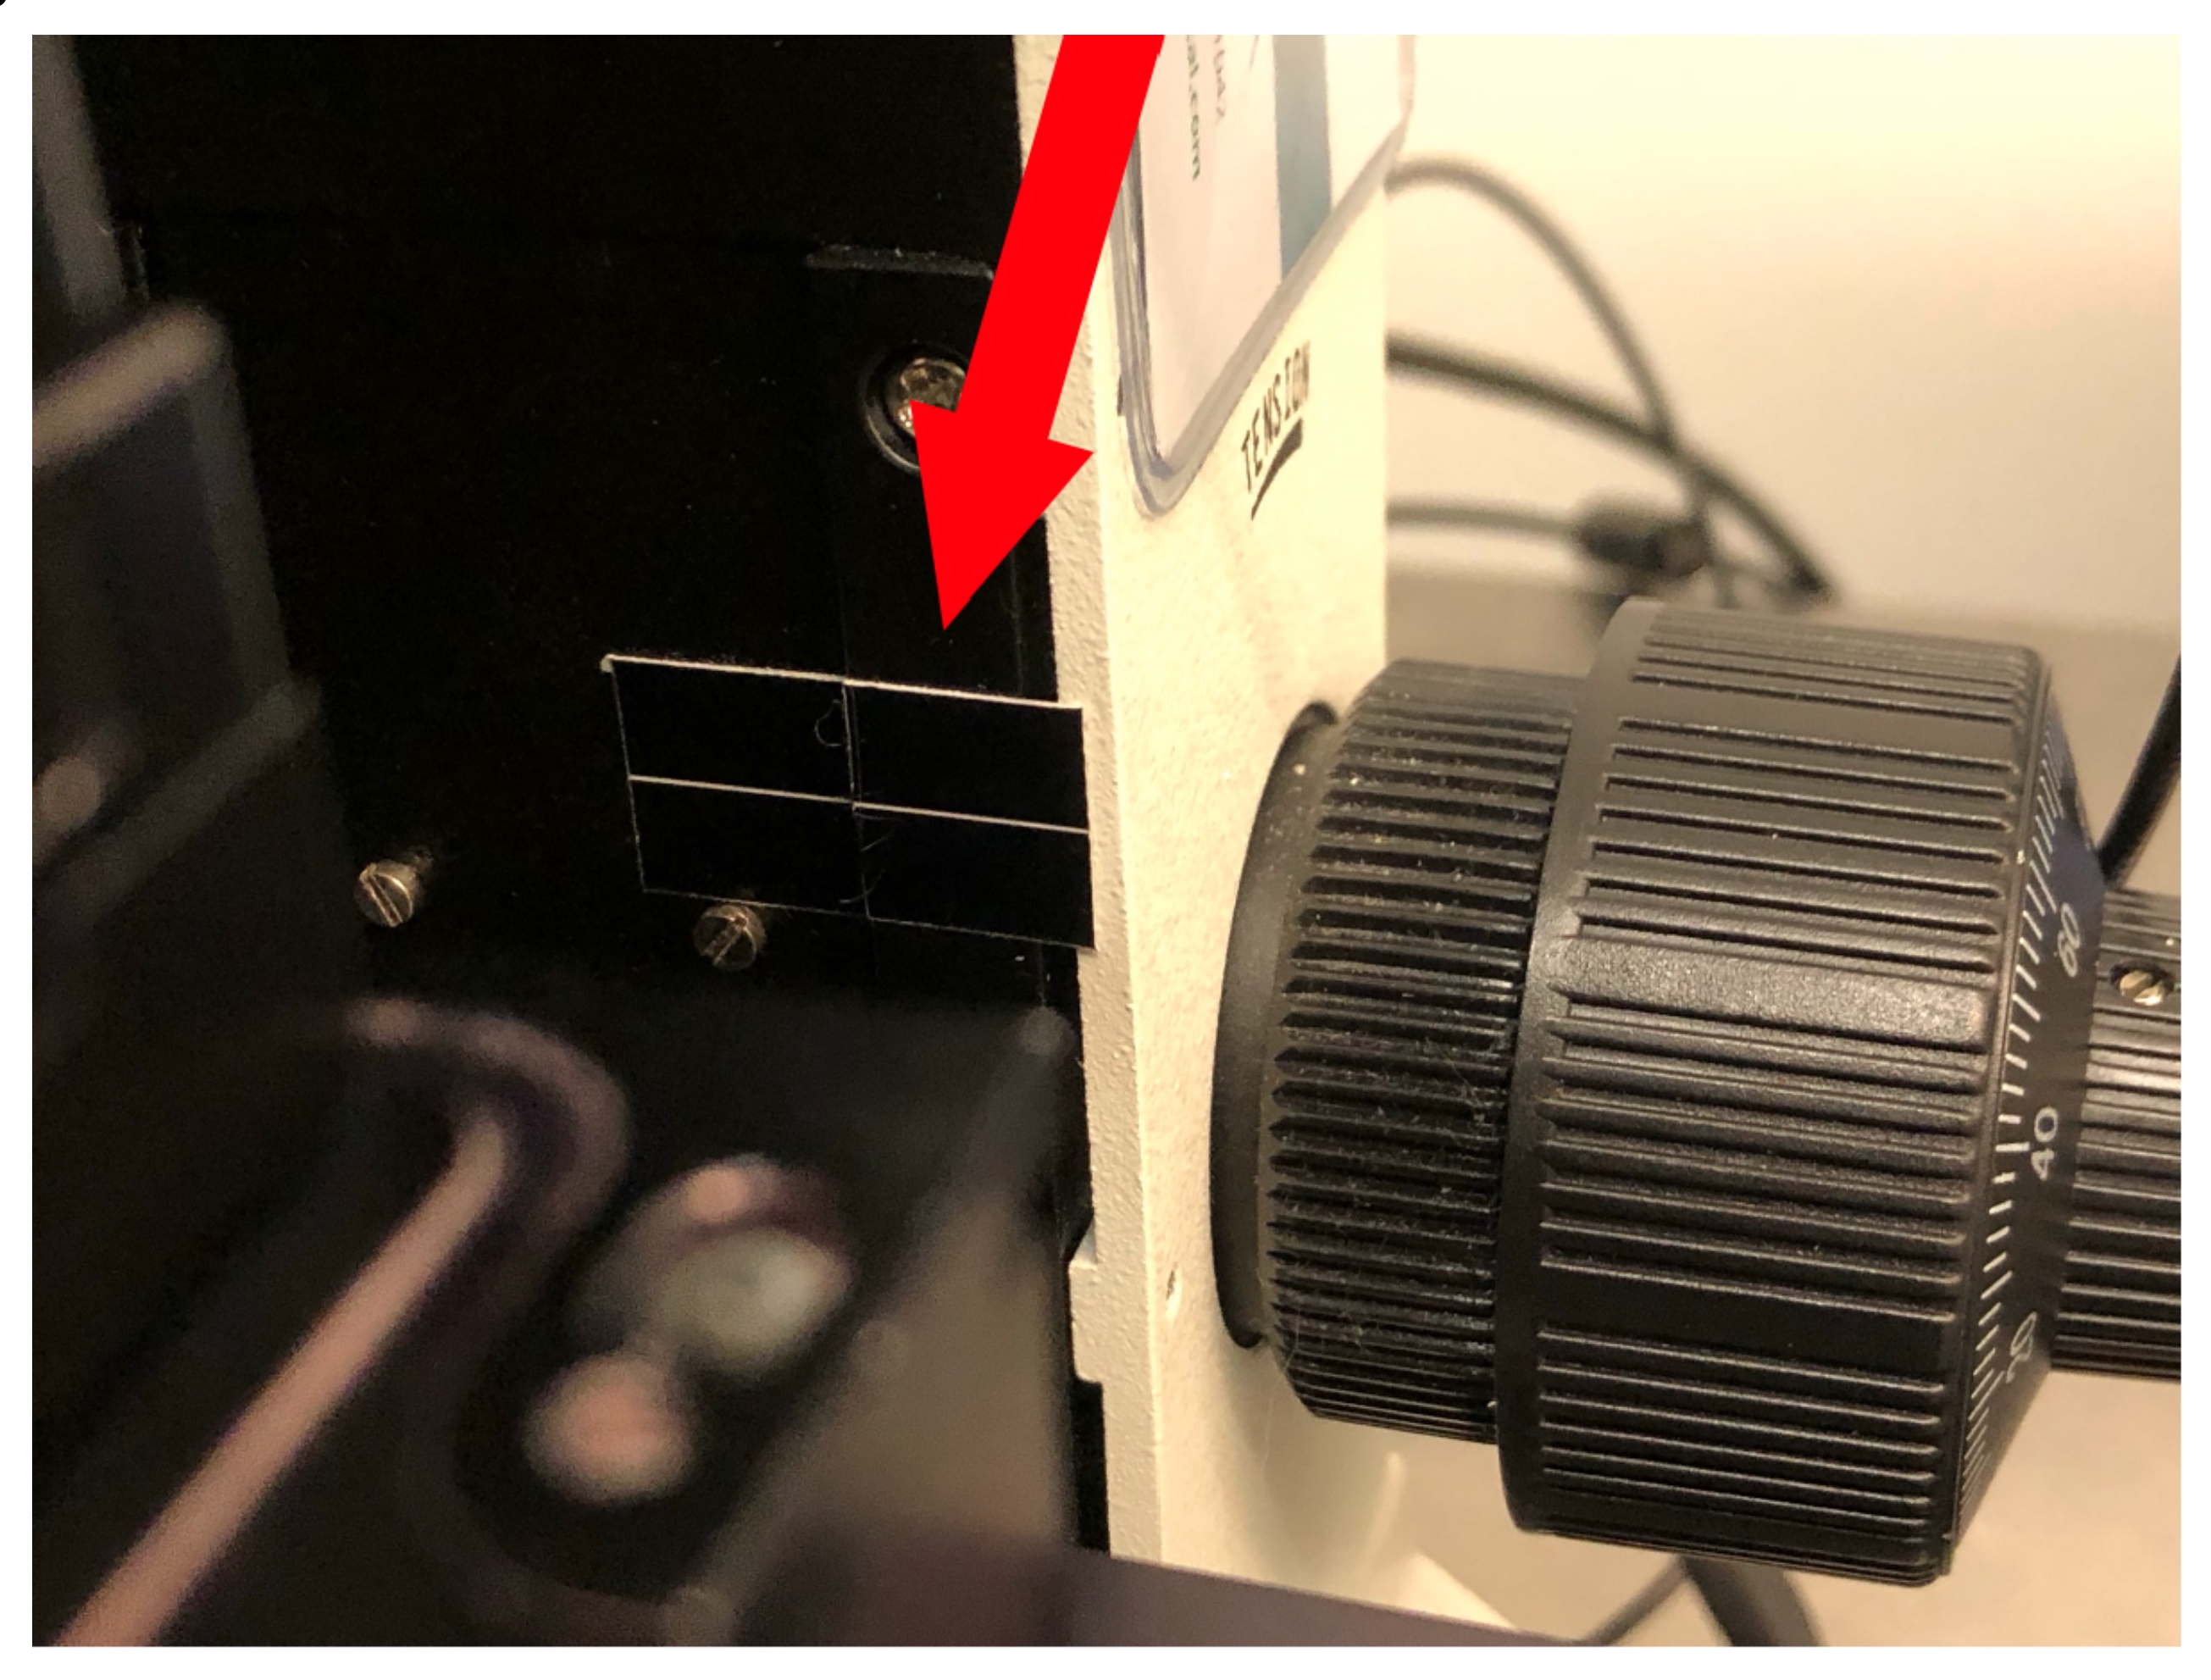
- Locate the laser module focus alignment guides on the arm of the microscope (Figure 2) and align them using the focus knob.

Figure 2: Laser module focus alignment guide. Please click here to view a larger version of this figure.
- Facing the microscope, place the laser module in the grooved stage and gently slide it as far as possible to the right.
NOTE: If done carefully, the alignment and focal spot will be easier to locate between samples. - Turn on the rocker switch on the laser control box.
6. Focusing and positioning of the laser module
NOTE: This must be performed with fluid in the chamber.
- Load the NTA software (see the Table of Materials) from the desktop.
NOTE: An error may appear, "Temperature H/W not found on COM3." Simply close and reopen the software to fix it. - Click Start Camera under the Capture tab in the upper left corner box. If the camera shuts off automatically after 5 min, simply click Start Camera again to restart it.
- In the same tab, adjust Camera Level to 14 to 16 to brighten the laser line and simplify particle identification and focus.
- Divert the image from the camera to the eyepieces by moving the top slider on the left side of the headpiece in or out.
- Find the area of increased density, commonly referred to as the thumbprint. Center and focus the thumbprint vertically in the field of view.
NOTE: The laser line will be to the left of the thumbprint. Darkening the room may help facilitate locating the thumbprint and focusing on the laser line. - Center the laser line in the field of view; move the top slider to divert light to the camera as observed on the computer screen.
NOTE: The laser line now visible on the screen is a mirror image of the eyepiece view; left in the eyepieces will be right on the computer screen. - Adjust the focus to sharpen the image of individual moving particles on the screen with the focus knob.
NOTE: Due to the depth of focus, all the particles will not be in focus, which is acceptable. Even particles that are slightly out of focus will be captured by the camera and analyzed by the software.
7. Loading standards/samples/diluent into the laser module for NTA analysis
- Draw up 1 mL of standard/sample/diluent into a rinsed 1 mL tuberculin syringe and attach it to the inlet port of the flow-cell cover. Advance the plunger until fluid is evident in the open syringe attached to the outlet port.
- In the camera view, move to the right of the laser line to an area of a uniform number of particles. If necessary, adjust the vertical orientation to center the horizontal bands of light. Refocus until the highest number of particles are in view. Ensure that for all subsequent measures, this position is maintained as closely as possible.
- Adjust the Camera Level to the point that the Dark information symbol flashes intermittently on and off in the top right of the camera view.
NOTE: This helps ensure that a consistent camera level selection is made at the minimum sensitivity level for each data collection series.
NOTE: Camera Level cannot be changed during capture.
8. Validation of calibration
NOTE: It is recommended to validate the module calibration using size standards (see section 2) prior to sample analysis. Routine validation is necessary to ensure accurate measurements. In a multiuser laboratory, individual user adjustments of software configuration settings can inadvertently cause inaccurate data collection. For critical data collection, daily validation is a matter of good laboratory practice. The day-to-day reproducibility of validation needs to be included in the reported results. Typically, calibration is set by the technician and is not adjustable by the individual user unless the user has administrator access. This prevents unauthorized reconfiguration by individual users.
- Warm diluted standards (see section 2) to room temperature for 30 min.
- Briefly vortex the standards and then load as described in section 7.
- Perform sample NTA as described in section 10 and record values for subsequent calculation of the coefficient of variation, which should be less than 2% if correctly calibrated.
9. Optimizing sample concentration for NTA
NOTE: The screen should contain between 50 and 100 measurable particles when the camera level and sample concentration are adjusted properly. If there is any question about whether a sample has an appropriate particle number, a Quick Measurement can be run on the sample at this point (see steps 9.1 to 9.7). It is used to assess the sample characteristics rapidly prior to longer video captures. The Quick Measurement tab is found within the SOP tab in the bottom middle box.
- Set Capture duration to 30 s.
- Accept the existing base filename or enter a new filename by clicking the ... tab for a new storage site for generated data.
- Check the box for Target temperature and input the desired temperature.
- Load the sample as previously described (step 7.1) and click Create and Run Script.
- Wait for the number of particles per frame to be displayed on the bottom right of the video screen after the completion of the 30 s video. If the number of particles is greater than 100, flush the laser module 3 times (as previously described in step 4.6).
- Dilute the sample to the desired concentration range using the characterized diluent.
- Load the properly diluted sample into the flushed laser module and run the Quick Measurement to verify the sample is within the acceptable range.
10. Sample NTA
NOTE: The Standard Measurement tab is within the SOP tab in the bottom middle box and is used for routine sample analysis (see steps 10.1 to 10.12).
- Set the duration to 30 or 60 s and the number of videos to 5.
- Accept the existing base filename or enter a new filename by clicking the ... tab for a new storage site for generated data.
- Check the box for Target temperature and input the desired temperature.
- Click Create Script to reuse this Standard Measurement.
- Once the sample is loaded as described in section 7 and the experiment is ready to run, click Create and Run Script.
- Fill out the fields in the Set Report Details popup screen with information on the operator, sample description, dilution of the sample, and diluent used.
NOTE: This information will be recorded and printed on the final experimental report. - When all desired fields have been filled, click OK to initiate the script.
NOTE: If Target temperature was selected, the heater will stabilize the sample in the laser module to the desired temperature for 5 s prior to allowing the script to proceed with the measurement. The diagnostic panel in the lower-left corner of the screen will read HEATER ON and display the temperature of the sample. - Prior to each video capture, look for a prompt to Advance the plunger manually. Inject ~0.05 mL of the sample into the laser chamber and allow the particles to come to "rest" (i.e., not flowing), and then click OK.
- Wait for a Settings Confirmation box to appear upon the completion of the 5th video capture and for the Process box to flash. Set the Detection Threshold for processing of the sample by noting the number of blue crosses marking particles on the screen as the frames are advanced manually from the bottom of the video screen. If there are more than 3-4 blue crosses marking particles on each screen as frames are advanced, increase the Detection Threshold.
NOTE: The blue crosses on the individual particles are analogous to the "swarm" effect in flow cytometry and should be minimized for optimum accuracy and reproducibility of data collection. - Click Settings OK when the Detection Threshold is acceptable.
- Wait for the videos to be automatically processed and a histogram of results and a dialog box notification of completion to be displayed before clicking OK.
- Once the Export Settings box appears, save the results by clicking Export.
NOTE: All results from videos and analysis will be stored in the destination file defined in step 10.2. This requires a large amount of storage. Monitor and transfer to a secondary storage device as necessary.
11. Re-analysis of the current sample at different detection thresholds
NOTE: Immediately following NTA analysis (step 10), the data can be reanalyzed using different Detection Threshold settings. However, Camera Level cannot be modified following capture.
- Highlight all 5 of the capture videos listed in the Current Experiment.
- Click Process Selected Files, and wait for the Setting Confirmation box to appear and the Process box to flash to change Detection Threshold.
- Adjust the Detection Threshold to the desired level and click Setting OK.
- Wait for the videos to be automatically processed and a histogram of results and a dialog box notification of completion to be displayed before clicking OK.
- Click Export Settings. When additional evaluations are performed on the most recent sample, be sure to click the Export Results box in the Current Experiment as the Export Results popup box will not be displayed following the sample re-analysis.
NOTE: As there are no reminders to do this, it can easily be overlooked, and the analysis will be lost. However, the underlying data will remain and can be reanalyzed later.
12. Analysis of archived files
NOTE: If previously analyzed experiments have not been saved or additional analysis needs to be done on these samples, the individual files can be reloaded into the NTA software for additional Detection Threshold evaluations. Camera Level changes cannot be modified following capture.
- Load the NTA software from the desktop.
- Click the Analysis tab in the lower middle panel.
- Click Open Experiment and navigate to the desired .nano file.
NOTE: The video files associated with the selected .nano experiment must be in the same folder as the main experiment file; otherwise, an error will appear when trying to process the files. The first 6 digits of the filename are the date the experiment was run (xx-xx-xx). The last 6 digits of the filename are the time the video was recorded (xx-xx-xx) and the individual video identifier. The PDF file of each combined experiment lists the included .nano files for that analysis. - Click Process Selected Files to run the analysis.
- Once the Process box flashes to allow changes in Detection Threshold, set the threshold to the desired level and click OK.
- Wait for the videos to be automatically processed and a histogram of results and a dialog box notification of completion to be displayed before clicking OK.
- Click Export Results. Be sure to click the Export Results box in the Current Experiment, as the Export Results popup box will not be displayed following the re-analysis.
NOTE: As there are no reminders to do this, it can easily be overlooked, and the analysis will be lost.
13. Cleaning and disassembly of the laser module
- Turn off the laser control box.
- Flush the entire sample from the laser module and discard it properly.
- Hold the laser module tilted with the open syringe port elevated to allow air to be purged from the chamber as the DPBS is injected slowly into the laser module and is flushed from the outlet syringe port.
- Flush the remaining DPBS from the laser module and discard.
- Repeat flushing 2 more times and empty the laser module as completely as possible after the last flush.
- Putting uniform pressure down on the flow-cell cover, uniformly loosen thumbscrews in an alternating diagonal manner until disengaged from threads, remove the thumbscrews, and store in the laser module case.
- Remove the flow-cell cover from the laser module.
- Clean both glass surfaces gently with a good quality lens cleaner and lens paper. Do not use tissue paper or paper towels on glass surfaces.
- Visually inspect the laser module and flow-cell cover "windows" for scratches or imperfections following use and report to the supervisor.
- Replace the laser module and flow-cell cover in their cases to prevent damage to glass surfaces during storage.
14. Sample analysis protocol
- Unfiltered samples
- Vortex the sample prior to loading and record 5 x 60 s videos at Camera Level 12 and Detection Threshold Level 3 as described above. Reanalyze these videos using Detection Thresholds 2 and 5.
- Repeat video collections of the same sample at Camera Levels 13 and 14 and Detection Threshold Level 3. Reanalyze these 2 additional videos using Detection Thresholds 2 and 5. Repeat the entire process using 5 x 30 s videos in the SOP setting.
- Filtered samples
- Vortex the sample and then simultaneously load and filter it (0.22 µm syringe filter) directly into the laser module.
NOTE: The syringe filter was flushed with 2 times the volume of the filter dead space prior to use to remove any resident particulates. The syringe filters (see the Table of Materials) had a measured dead space of 0.5 mL and were flushed with 1.0 mL of the sample prior to measurements. Note the filter type in the SOP data fields. The filtered sample was processed exactly as described for unfiltered samples in step 14.1.
- Vortex the sample and then simultaneously load and filter it (0.22 µm syringe filter) directly into the laser module.
15. Statistical analysis of NTA results
- For the analysis of main effects or interactions, perform analysis of variance following a check of ANOVA assumptions (normality, unimodal, homogeneity of variance). Use Kruskal-Wallis one-way ANOVA on ranks in cases of failure of ANOVA assumptions.
- Following the return of significant main effects, use Dunn's method to perform means testing for preplanned comparisons. Consider a p-value of 0.05 to be significant in two-tailed testing.
NOTE: Data files generated here are available from the authors following the completion of a materials transfer agreement.
Access restricted. Please log in or start a trial to view this content.
Results
Table 1 contains the results of the NTA videos for the liposome samples (18 filtered and 18 unfiltered) and a representative DPBS diluent. Comparisons across the two groups were completed regardless of the camera level or detection threshold in this paper. Filtered samples had a mean particle diameter of 108.5 nm, a particle mode of 86.2 nm, and a concentration of 7.4 × 10⁸ particles/mL. In contrast, unfiltered samples had a mean particle diameter of 159.1 nm, a particle mode of 105.7 nm,...
Access restricted. Please log in or start a trial to view this content.
Discussion
There are several methods available to estimate the size and concentration of nanoparticles11. These include ensemble methods that generate a size estimate from a population, including dynamic light scattering (DLS), centrifugal sedimentation, and single-particle level analysis-electron microscopy, NTA, atomic force microscopy, and tunable resistive pulse sensing. Of these, DLS and NTA are widely used, nondestructive size and concentration measurement methods, based on Brownian movement in an idea...
Access restricted. Please log in or start a trial to view this content.
Disclosures
None of the authors have any conflicts of interest.
Acknowledgements
The work was supported by the state of Kansas to the Midwest Institute for Comparative Stem Cell Biology (MICSCB), the Johnson Cancer Research Center to MLW and NIH R21AG066488 to LKC. OLS received GRA support from the MICSCB. The authors thank Dr. Santosh Aryal for providing the liposomes used in this project and the members of the Weiss and Christenson laboratories for helpful conversations and feedback. Dr. Hong He is thanked for technical support. MLW thanks Betti Goren Weiss for her support and counsel.
Access restricted. Please log in or start a trial to view this content.
Materials
| Name | Company | Catalog Number | Comments |
| Automatic Pipetter | |||
| Centrifuge Tubes, Conical, Nunc 15 mL | Thermo Sci. | 339650 | |
| Kimwipes | |||
| Lens Cleaner | |||
| Lens Paper | |||
| NanoSight LM-10 | Malvern Panalytical | ||
| NanoSight LM-14 Laser Module | Malvern Panalytical | ||
| Nanosight NTA Software Ver. 3.2 | Malvern Panalytical | ||
| Paper Towels | |||
| Pipette Tips, 1-200 µL, Filtered, Sterile, Low Binding | BioExpress | P -3243-200X | |
| Pipette Tips, 50-1,000 µL, Filtered, Sterile | BioExpress | P-3243-1250 | |
| Saline, Dulbecco's Phosphate Buffered (No Ca or Mg) | Gibco | 14190-144 | |
| Standards, Latex Transfer- 100 nm (3 mL) | Malvern | NTA4088 | |
| Standards, Latex Transfer- 50 nm (3 mL) | Malvern | NTA4087 | |
| Syringe Filter, 33 mm, .22 µm, MCE, Sterile | Fisher brand | 09-720-004 | |
| Syringe, TB, 1 mL, slip tip | Becton Dickinson | 309659 | |
| Waste fluid container |
References
- Lotvall, J., et al. Minimal experimental requirements for definition of extracellular vesicles and their functions: a position statement from the International Society for Extracellular Vesicles. Journal of Extracellular Vesicles. 3 (1), (2014).
- Thery, C., et al. Minimal information for studies of extracellular vesicles 2018 (MISEV2018): a position statement of the International Society for Extracellular Vesicles and update of the MISEV2014 guidelines. Journal of Extracellular Vesicles. 7 (1), 1535750(2018).
- Consortium, E. -T., et al. EV-TRACK: transparent reporting and centralizing knowledge in extracellular vesicle research. Nature Methods. 14 (3), 228-232 (2017).
- Gardiner, C., et al. Techniques used for the isolation and characterization of extracellular vesicles: results of a worldwide survey. Journal of Extracellular Vesicles. 5, 32945(2016).
- Maas, S. L., et al. Possibilities and limitations of current technologies for quantification of biological extracellular vesicles and synthetic mimics. Journal of Controlled Release. 200, 87-96 (2015).
- Danaei, M., et al. Impact of particle size and polydispersity index on the clinical applications of lipidic nanocarrier systems. Pharmaceutics. 10 (2), 57(2018).
- Kestens, V., Bozatzidis, V., De Temmerman, P. J., Ramaye, Y., Roebben, G. Validation of a particle tracking analysis method for the size determination of nano- and microparticles. Journal of Nanoparticle Research. 19 (8), 271(2017).
- Filipe, V., Hawe, A., Jiskoot, W. Critical evaluation of nanoparticle tracking analysis (NTA) by NanoSight for the measurement of nanoparticles and protein aggregates. Pharmaceutical Research. 27 (5), 796-810 (2010).
- Hole, P., et al. Interlaboratory comparison of size measurements on nanoparticles using nanoparticle tracking analysis (NTA). Journal of Nanoparticle Research. 15 (12), 2101(2013).
- Malvern analytical Ltd. NanoSight LM10 Operating Manual-P550H. , (2013).
- Kim, A., Ng, W. B., Bernt, W., Cho, N. J. Validation of size estimation of nanoparticle tracking analysis on polydisperse macromolecule assembly. Scientific Reports. 9 (1), 2639(2019).
- Gollwitzer, C., et al. A comparison of techniques for size measurement of nanoparticles in cell culture medium. Analytical Methods. 8 (26), 5272-5282 (2016).
- vander Pol, E., et al. Particle size distribution of exosomes and microvesicles determined by transmission electron microscopy, flow cytometry, nanoparticle tracking analysis, and resistive pulse sensing. Journal of Thrombosis and Haemostasis. 12 (7), 1182-1192 (2014).
Access restricted. Please log in or start a trial to view this content.
Reprints and Permissions
Request permission to reuse the text or figures of this JoVE article
Request PermissionThis article has been published
Video Coming Soon
Copyright © 2025 MyJoVE Corporation. All rights reserved