
A subscription to JoVE is required to view this content. Sign in or start your free trial.
Method Article
Chemiluminescence-based Assays for Detection of Nitric Oxide and its Derivatives from Autoxidation and Nitrosated Compounds
In This Article
Summary
Here, we present protocols for detecting nitric oxide and its biologically relevant derivatives using chemiluminescence-based assays with high sensitivity.
Abstract
Nitric oxide (NO) activity in vivo is the combined results of its direct effects, the action of its derivatives generated from NO autoxidation, and the effects of nitrosated compounds. Measuring NO metabolites is essential to studying NO activity both at vascular levels and in other tissues, especially in the experimental settings where exogenous NO is administered. Ozone-based chemiluminescence assays allow precise measurements of NO and NO metabolites in both fluids (including plasma, tissue homogenates, cell cultures) and gas mixtures (e.g., exhaled breath). NO reacts with ozone to generate nitrogen dioxide in an excited state. The consequent light emission allows photodetection and the generation of an electric signal reflecting the NO content of the sample. Aliquots from the same sample can be used to measure specific NO metabolites, such as nitrate, nitrite, S-nitrosothiols, and iron-nitrosyl complexes. In addition, NO consumed by cell-free hemoglobin is also quantified with chemiluminescence analysis. An illustration of all these techniques is provided.
Introduction
Since Salvador Moncada and Nobel laureates Robert Furchgott, Louis Ignarro, and Ferid Murad identified nitric oxide (NO) as the previously known endothelial-derived relaxation factor (EDRF), the central role of NO has been established in several key mechanisms spanning throughout vascular biology, neurosciences, metabolism, and host response1,2,3,4,5,6,7. Exogenous administration of NO gas has become an established treatment for respiratory failure due to pulmonary hypertension in the newborn8. Nitric oxide gas has also been investigated for treatment of respiratory syncytial virus (RSV) infection, malaria and other infective diseases, ischemia-reperfusion injury, and for prevention of acute kidney injury in patients undergoing cardiac surgery9,10,11,12. The need for precise measurement techniques to assess the levels of NO, its metabolites, and those of its target proteins and compounds arises from both mechanistic and interventional studies.
Due to its high reactivity, NO may undergo different reactions depending on the biological matrix in which it is produced and/or released. In the absence of hemoglobin (Hb) or other oxy-hemoproteins, NO is oxidized almost completely to nitrite (NO2-).
2NO + O2 → 2NO2
NO2 + NO → N2O3
N2O3 + H2O → NO2- + H+
NO first undergoes autoxidation with molecular oxygen (O2) to yield nitrogen dioxide (NO2) and reacts with NO2 itself to generate dinitrogen trioxide (N2O3). One molecule of N2O3 reacts with water (H2O) to form two molecules of NO2- and a proton (H+)13. Within whole blood14,15, NO and NO2- are rapidly converted to nitrate (NO3-) as these molecules react avidly with the oxidized heme groups of Hb [Hb-Fe2+-O2 or oxyhemoglobin (oxyHb)] to yield NO3-. This reaction is coupled with the transition of the heme group to the ferric state [Hb-Fe3+ or methemoglobin (metHb)]:
Hb-Fe2+-O2 + NO → Hb-Fe3+ + NO3-
The red blood cell (RBC) barrier and the space immediately adjacent to the endothelium are the main factors limiting this reaction and allowing a small portion of the NO released by the endothelium to act as EDRF16,17. In fact, cell-free Hb in the circulation is known to disrupt vasodilation in experimental and clinical settings17,18. Within the RBC, depending on oxygenation and NO2- concentration, a portion of NO reacts with deoxyhemoglobin (Hb-Fe2+) to form iron-nitrosyl Hb (Hb-Fe2+-NO or HbNO):
Hb-Fe2+ + NO → Hb-Fe2+-NO
In the RBC15,17, NO2- can form Hb-Fe3+ by reducing Hb-Fe2+ leading to the release of NO, which in turn binds Hb-Fe2+-O2 (preferentially) or Hb-Fe2+.
The generation of NO-derivatives should not be considered strictly unidirectional as NO can be regenerated from NO2- and NO3- in various tissues and by different enzymes (e.g., by intestinal bacteria or within mitochondria, particularly under hypoxic conditions)19,20.
A variable amount of NO produced (or administered) leads to the downstream generation of S-nitrosothiols, mainly by thiol transnitrosation from N2O3 in the presence of a nucleophile creating a NO+ donor intermediate (Nuc-NO+-NO2-):
N2O3 + RS- → RS-NO + NO2-
Another possibility for S-nitrosothiols generation is nitrosylation of oxidized thiols (NO reacting with an oxidized thiol):
RS• + NO → RS-NO
This mechanism and direct thiol oxidation by NO2 might be possible only in very specific conditions which are described elsewhere21. S-nitrosothiols range from light molecules like S-nitrosoglutathione to large thiol-containing proteins. S-nitrosohemoglobin (S-NO-Hb) is formed by nitrosation of a thiol group of a conserved cysteine residue in the β-chain (β93C)22.
The generation and metabolism of S-nitrosothiols are part of important regulatory mechanisms. Examples include regulation of glutathione, caspases, N-methyl-D-Aspartate (NMDA), and ryanodine receptors23,24,25,26,27,28. Previously considered as a major mediator of NO biology in vivo, nitrosated albumin (S-nitroso-albumin) seems to be a NO/NO+ transporter without any specific additional biological activity29.
When measuring the concentration of NO and its derivatives from a specific biological sample within a biological matrix, it is important to consider characteristics such as acidity, oxygenation, temperature, and the presence of reagents. Examples include administered exogenous NO donors and, in the setting of acute inflammation, hydrogen peroxide (H2O2) reacting with NO2 leading to generation of supernormal concentration of free radicals like peroxynitrite (ONOO-)21. In addition to the analytical method that is employed, the preanalytical phase of sample preparation and storage is fundamental. Downstream reactions that do not represent the in vivo NO activity shall be predicted, considered, and blocked. A valid example is the instability of S-NO-Hb, requiring a dedicated treatment of blood samples when it is targeted for measurement22.
Chemiluminescence-based assays are the gold standard for detecting the levels of NO and its main metabolites [NO2-, NO3-, S-NO and iron-nitrosyl complexes (Fe-NO)] in any biological fluid, including tissue homogenates30,31. These methods rely upon the chemiluminescence detector (CLD), a device that houses the reaction of NO with ozone (O3), generating NO2 in an excited state (NO2•). Relaxation of NO2• causes emission of a photon of light that is detected by a photomultiplier tube, generating an electric signal that is directly proportional to the NO content of the sampled gas mixture32. A simplified schematic of the CLD is represented.

Figure 1: Simplified schematic of a chemiluminescence detector for nitric oxide gas. Chemiluminescence-based detection of nitric oxide (NO) is the stoichiometric generation of one photon per NO gas molecule that is introduced in the chemiluminescence detector (CLD). The chemiluminescence reaction is obtained in a designated chamber supplied with ozone (O3) from an internal generator, which is kept at negative pressure by connection with an external pump, allowing continuous and constant inflow of sample gas. The generation of O3 requires diatomic oxygen (O2) that is supplied by a dedicated O2 tank connected with the CLD (other manufacturers provide CLDs operating with ambient air). Within the reaction chamber, each molecule of NO gas contained in the sampled gas reacts with oxygen to yield one molecule of nitrogen dioxide in the activated state (NO2*). By returning to its ground state, each NO2* molecule emits one photon that is detected by a photomultiplier tube (PMT) located adjacent to the reaction chamber. The PMT with the associated amplifier and central processing unit produces a signal proportional to the photon count and the number of NO molecules in the reaction chamber. Please click here to view a larger version of this figure.
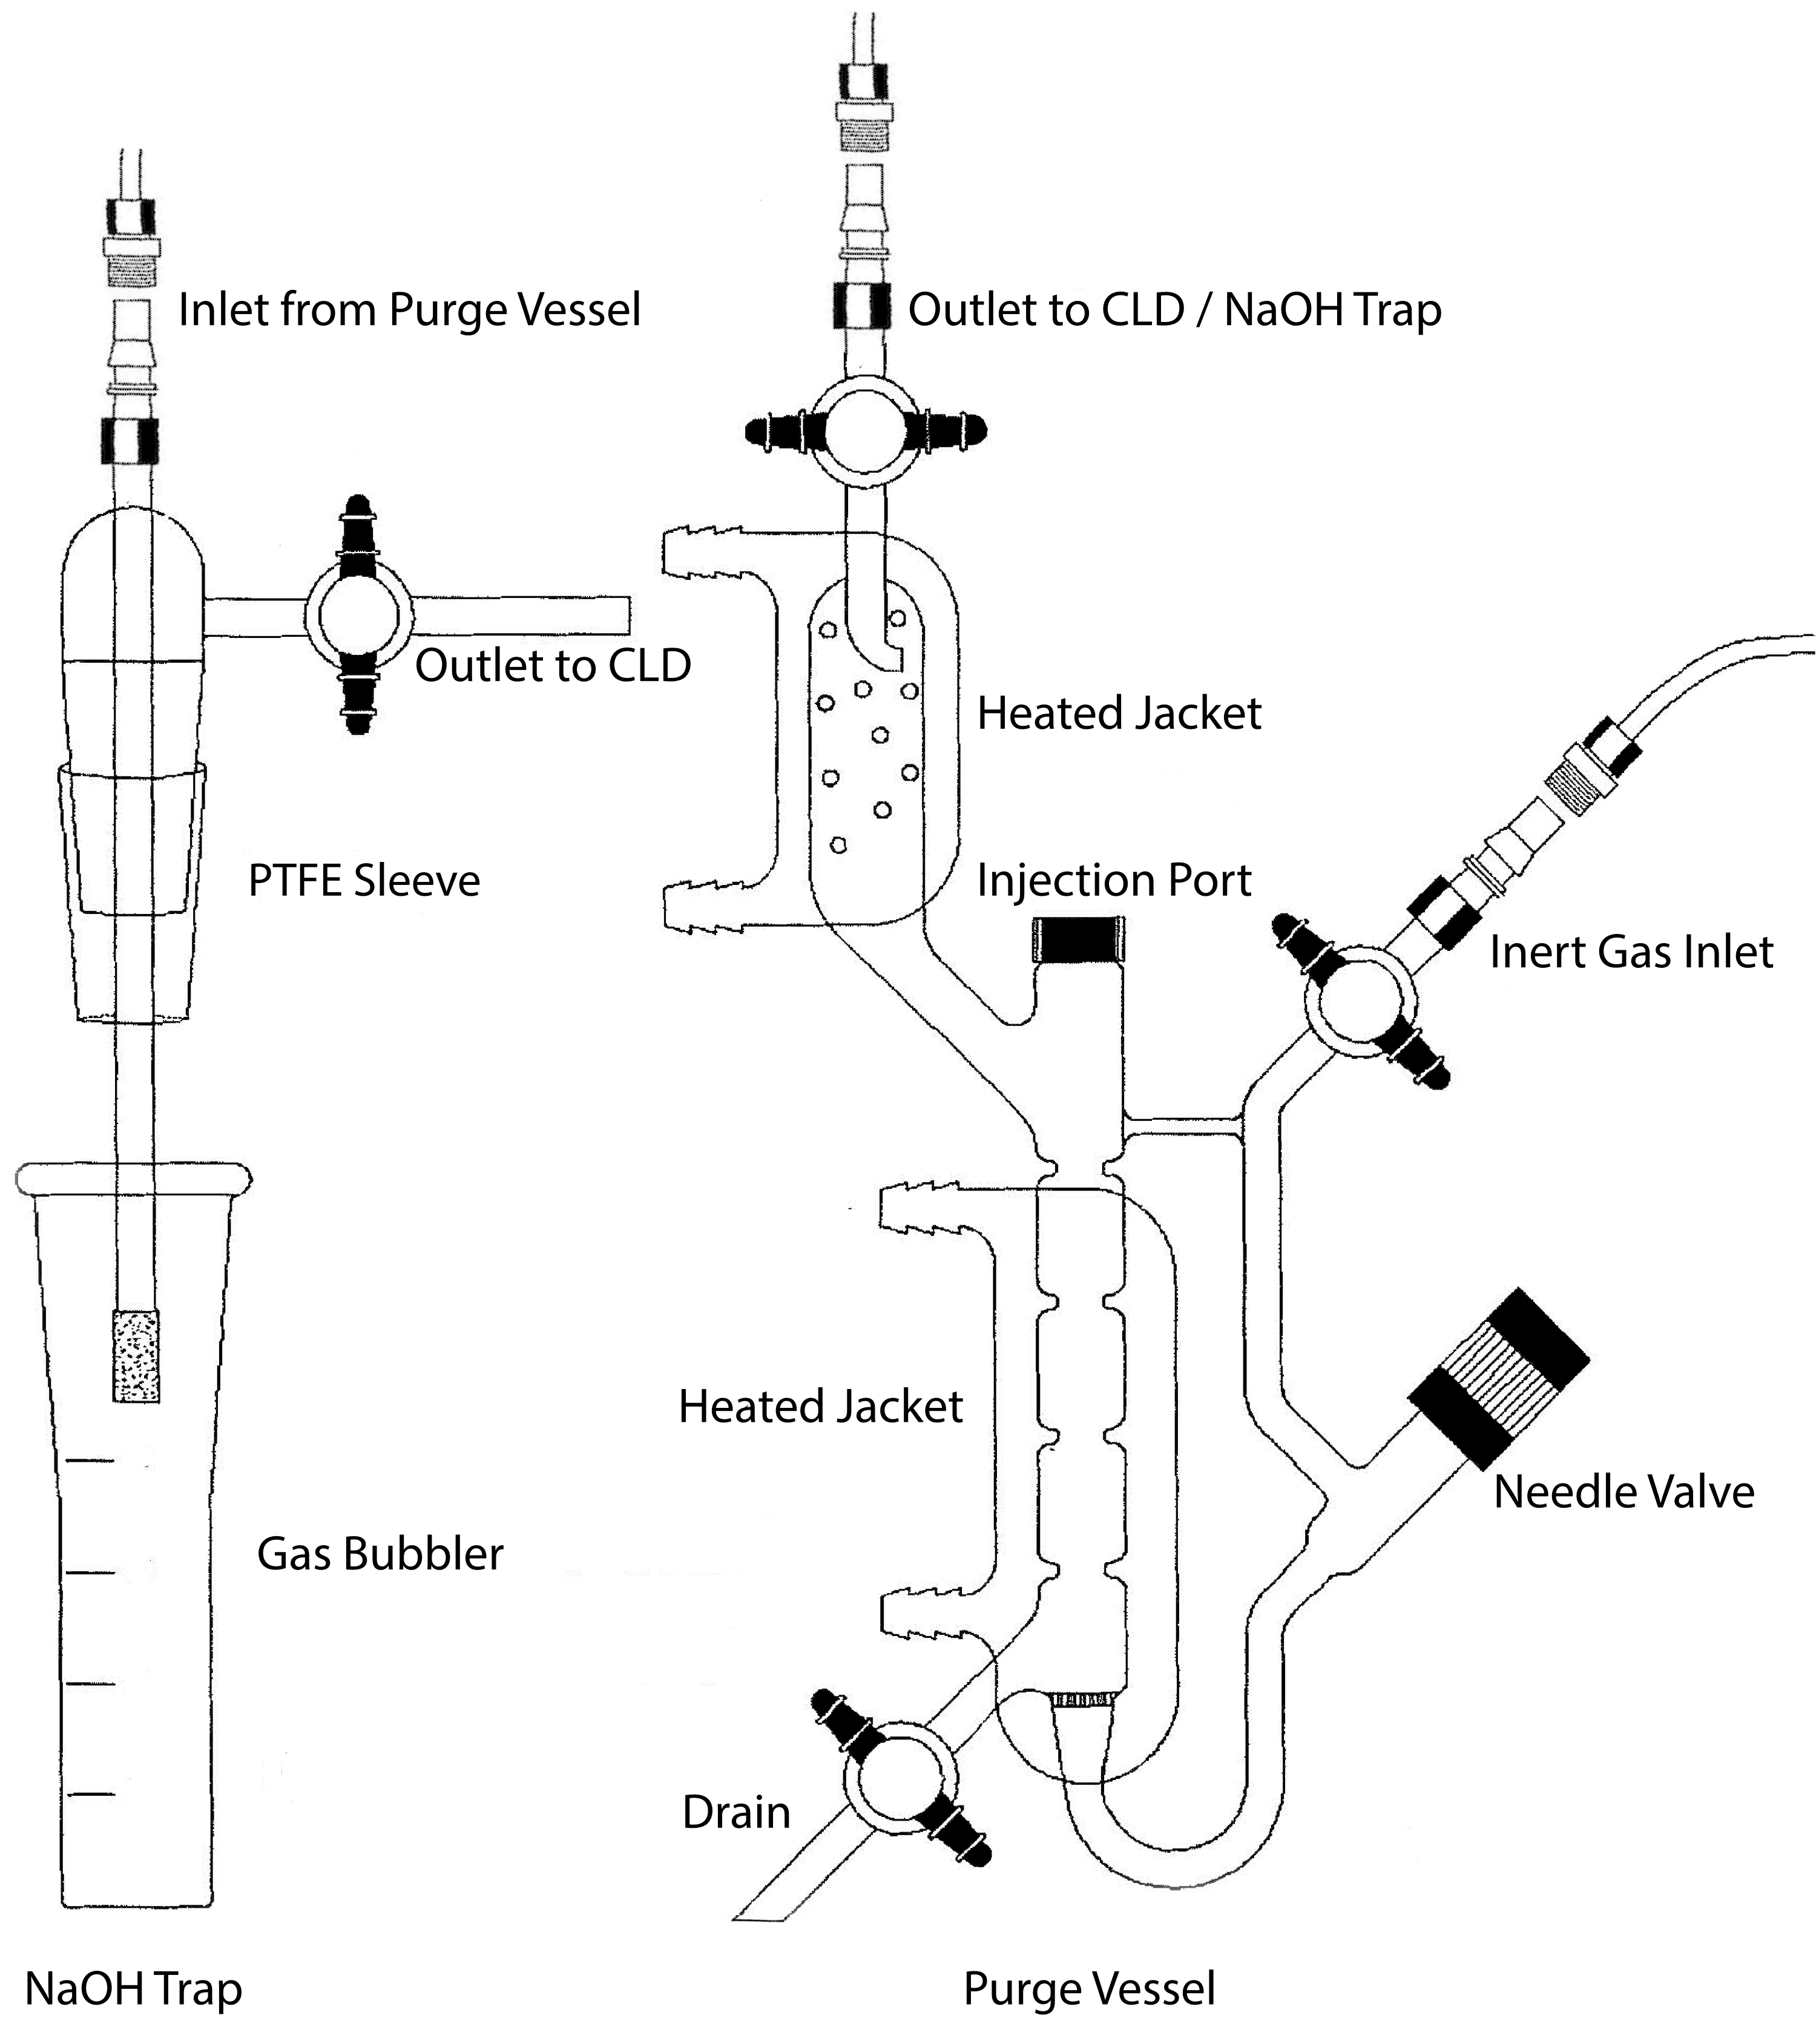
The sample inlet of the CLD can be connected to a glassware system containing a reaction chamber for liquid samples. The system is continuously purged with an inert gas such as nitrogen, helium, or argon, transferring NO from the reaction chamber to the CLD. Liquid-phase samples are injected through a dedicated membrane into the purge vessel.

Figure 2: Structure of a purge vessel for chemiluminescence-based detection of nitric oxide gas The purge vessel (right) allows for the detection of nitric oxide (NO) gas or any other compound that can be readily converted to NO gas when released from a liquid phase reagent. The inert gas inlet is connected to a source (tank) of an inert gas such as Argon, Xeon, or diatomic nitrogen (N2). The needle valve (opens to the left) is used for pressure control within the purge vessel and can be completely removed to clean the vessel. The injection port is covered by a cap with a membrane septum for sample injection. The membrane should be replaced often. A heated jacket surrounds the reaction chamber and is connected to a hot water bath to perform the VCl3 in HCl assay. The purge vessel outlet is connected to the chemiluminescence detector (CLD) or to the NaOH trap (required for VCl3 in HCl assays). To drain the reaction chamber content, first close the stopcocks at the inert gas inlet and the purge vessel outlet, close the needle valve, remove the cap at the injection port and finally open the stopcock at the drain. The NaOH trap (left) is required to be placed inline between the purge vessel and the CLD if the VCl3 in HCl assay is performed because of the corrosivity of HCl. The connection to the CLD always requires an intense field dielectric (IFD) filter to be placed between the CLD and the output of the purge vessel (or the NaOH trap, if used). The IFD filter removes airborne particles and stops liquid from passing through the purge vessel. PTFE = polytetrafluoroethylene. Please click here to view a larger version of this figure.
As a consequence, any compound that can be converted to NO through a specific and controlled chemical reaction can be detected with high sensitivity in any biological fluid and tissue homogenate24. Direct measurement of gas-phase NO through chemiluminescence is performed in both experimental and clinical settings. These techniques are extensively described elsewhere33,34,35. Measurement of NO2-, S-nitrosothiols, S-nitrosated proteins, and Fe-NOs can be performed by adding samples in a reaction mixture with triiodide (I3-), which stoichiometrically releases NO gas from all these compounds:
I3- → I2 + I-
2NO2− +2I− +4H+ → 2NO + I2 +2H2O
I3− + 2RS-NO → 3I− + RSSR + 2NO+
2NO+ + 2I− → 2NO + I2
while I3- does not react with NO3-15. Precise measurements of each compound are made possible by pre-treatment of sample aliquots with acidified sulfanilamide (AS) with or without mercuric chloride (HgCl2). Specifically, pre-treatment with AS removes all NO2- content. As a consequence, the NO content measured by the CLD only reflects the sum of S-NOs and Fe-NOs concentration. Injection of HgCl2 in a sample aliquot before AS injection causes NO2- to be released by S-NO. Treatment with AS (leading to NO2- removal) ensures that the measured NO content only reflects the concentration of Fe-NOs. A series of subtractions between the assessments allow to calculate the precise concentration of the three NO derivatives22.

Figure 3: Steps in sample preparation for the I3- in acetic acid chemiluminescence assay. The sequential steps for preparation of the I3- in acetic acid chemiluminescence assay are illustrated. Use of light-protected centrifuge tubes is required. Tubes 1, 2, and 3 are those used to prepare for the assay. Another sample aliquot (tube 4) is needed for the VCl3 in HCl assay if the measurement of nitrate (NO3-) is required. Steps are indicated by numbers in red. Prefill (Step 1) as indicated with phosphate buffer saline (PBS) or HgCl2 before adding the sample volume. Add the sample volume (2) as indicated, vortex, and incubate for 2 min at room temperature (RT). Add (3) PBS or acidified sulfanilamide (AS) as indicated,vortex, and incubate for 3 min at RT. Run the assay (4). The concentration measured by the assay is the sum of the concentration of the compounds reported under each tube. Tube number 1 will allow measurements of nitrite (NO2-), S-nitrosothiols (S-NO), and iron-nitrosyl complexes (Fe-NOs) as a single signal. For nitrate (NO3-) measurement, samples shall be run with both I3- in acetic acid and VCl3 in HCl assays, and the value obtained from tube 1 should be subtracted from the one obtained from tube 4. *suggested quantities to be used for Hb analysis for determination of residual NO2-, S-nitrosohemoglobin and iron-nitrosyl-hemoglobin. Please click here to view a larger version of this figure.
For NO3- measurement, Vanadium (III) chloride (VCl3) in hydrochloric acid (HCl) is used for conversion of NO3- to NO in the purge vessel in order to measure NO3- stoichiometrically with the CLD:
2 NO3-+ 3V+3 + 2H2O → 2NO + 3VO2+ + 4H+
To achieve a sufficiently fast conversion, the reaction needs to be performed at 90-95 °C. Reduction from NO3- to NO2- is coupled with reduction of NO2- to NO by HCl. Vanadium metal also reduces S-NOs liberating their NO moiety22,36. The final concentration obtained by CLD with VCl3 in HCl reflects the aggregate concentration of NO3-, NO2, and other nitrosated compounds. Subtraction of the latter value from the concentration yielded with CLD with I3- allows for the calculation of NO3- concentration36,37 (Figure 3).
In the NO consumption assay, the continuous release of NO in the purge vessel by NO donors like (Z)-1-[2-(2-aminoethyl)-N-(2-ammonioethyl)amino]diazen-1-ium-1,2-diolate (DETA-NONOate) generates a stable signal allowing quantifying cell-free oxyHb in the injected samples. The amount of NO consumed in the purge vessel is in a stoichiometric relationship with the amount of oxyHb in the sample38.
Protocols for measurement of NO2-, NO3-, S-nitrosothiols, iron-nitrosyl complexes, and NO consumption by cell-free Hb in plasma samples are illustrated. Studies on NO in the RBC environment require specific sample treatment followed by exclusion chromatography to measure extremely fragile S-NO-Hb and Hb-NO coupled with the determination of total Hb concentration15,22. Sample preparation is instrumental in correcting measurement. Pre-existence of NO2- in H2O and release of NO2- during the assay can lead to measurement of artificially higher concentrations of NO derivatives such as S-NO-Hb14,39. Important aspects of sample preparation are also presented.
Protocol
The procedures indicated in this protocol are in accordance with the review board of Massachusetts General Hospital. The blood samples that were used had been collected during a previous study and were de-identified for the current purpose18.
NOTE: See manufacturer's instructions for specific guidance regarding optimal connections between tubing and glassware constituting the purge vessel, washing, and general maintenance. Connections need to be firm and carefully made not to damage the glassware. Identify the components of the glass purge vessel: gas inlet line, purge vessel with heating jacket and condenser, sodium hydroxide (NaOH) gas bubbler trap, connection line between the purge vessel and the bubbler, purge vessel outlet gas line (to CLD) endowed with an intense field dielectric (IFD) filter. An IFD filter line between the purge vessel and the sample inlet of the CLD must be in place every time NO metabolites in liquid form (plasma, cell cultures, tissue homogenates) are measured (all the assays presented in the protocol). Sample preparation depends on the fluid or tissue that is analyzed and on the compounds of interest. Important aspects of the preanalytical phase are covered in section 1 and 2. Specific preparation steps for specific assays are included in sections 3-5. Sections 6-8 apply to all assays.
1. Preparation of dedicated reagents
NOTE: For more details, refer to previous publications15,22.
- Prepare 5% (290 mM) acidified sulfanilamide (AS) solution for NO2- removal by dissolving 500 mg of sulfanilamide into 10 mL of 1N HCl. This solution is stable for months.
- Prepare 50 mM mercuric chloride (HgCl2) solution for NO2- release from S-NOs by dissolving 67.9 mg of HgCl2 into 5 mL of PBS. Protect the stock solution from light.
- Prepare NO2- blocking solution with 800 mM ferricyanide [K3Fe(CN)6] to oxidize Hb together with 100 mM N-ethylmaleimide (NEM) to block thiol-groups and (OPTIONAL) 10% nonylphenyl-polyethylene glycol solution (Nonidet p-40) to solubilize red cell membranes.
- Add K3Fe(CN)6 to deionized and distilled water (ddH2O, 263.5 g of powder per liter) to obtain a final concentration of 800 mM.
- Add NEM to the 800 mM K3Fe(CN)6 in ddH2O solution (12.5 g of powder per liter to have 100 mM concentration) and mix the solution to dissolve all crystals.
- Add one part of 10% NP-40 to nine parts of the 800 mM NEM K3Fe(CN)6 100 mM NEM solution (111 mL per liter) and mix well (mandatory step for whole blood analysis).
- Prepare the S-NO-Hb stabilization solution containing 12 mM K3Fe(CN)6, 10 mM NEM, 100 µM diethylenetriaminepentaacetic acid (DTPA, for metal chelation), and 1% Nonidet p-40 detergent from their stock solutions.
- Prepare a 200 mM NEM solution by adding NEM crystals to PBS (25 mg/mL, e.g., 250 mg in 10 mL PBS) and mix the solution until all crystals are dissolved (to be made on experiment day).
- Prepare a 800 mM K3Fe(CN)6 solution by adding K3Fe(CN)6 to ddH2O (263.5 mg/mL e.g. 1.32 g in 5 mL of ddH2O to obtain final concentration of 800 mM) (to be made on experiment day).
- Prepare a 10 mM DTPA stock solution by adding 786 mg of DTPA to 200 mL of ddH2O and adjust pH to 7.0 with 5N NaOH to fully solubilize DTPA.
- Add 5 mL of 200 mM NEM solution, 1.5 mL of 800 mM K3Fe(CN)6 solution and 1 mL of DTPA stock solution to 81.5 mL of PBS at 7.2 pH, and finally, add 11 mL of 10% NP-40 at last to bring final volume to 100 mL.
2. Sample collection
NOTE: For more details on sample collection, refer to previously published works15,22,40.
- Collect whole blood
- Collect blood in heparin-coated tubes preferring venous over arterial vessel (unless specifically required) and preferring catheter placement over venipuncture (if possible) with catheter or needle bore of at least 20 G or larger to minimize hemolysis.
- Immediately add the NO2- blocking solution (1 part of the solution to 4 parts of whole blood), process (sections 3 or 4), or freeze and store at -80 °C.
- Collect plasma and red blood cells (RBCs)
- Collect blood in heparin-coated tubes preferring venous over arterial blood (unless specifically required) and needles of at least 20 G or larger to minimize hemolysis and centrifuge immediately for 5 min at 4000 x g at 4 °C.
- Mix the supernatant (plasma) with the NO2- blocking solution (1 part of the solution to 4 parts of the supernatant) in a new tube and process (sections 3 or 4), or freeze and store at -80 °C.
NOTE: For the NO consumption assay, the NO2- blocking solution cannot be used. The assay can be performed without plasma pre-treatment. - Resuspend the RBC pellet from the bottom to a new tube pre-filled with S-NO stabilization solution (see step 1.4) (1 mL of pellet to 9 mL of solution) and incubate for 5 min.
- Pass the RBC lysate in a sizing column with G-25 Sephadex polymer that has been previously rinsed with ddH2O for exclusion chromatography
- Collect the Hb fraction to process (section 4) and to measure Hb concentration using Drabkin's reagent (for Hb measurement, refer to previously published work22).
NOTE: To prepare and sample a specific tissue/organ, identify its hilum, and surgically isolate it. Incise the vein, puncture the artery, and inject with heparinized saline (10 U/mL) via the artery. Excise the tissue when saline starts to backflow at the venous incision. Homogenize the tissue with a mechanic homogenizer while adding 1 part of NO2- blocking solution to 4 parts of homogenized tissue.
3. VCl3 in HCl assay preparation
NOTE: For more details on VCl3 in HCl assay preparation, refer to previously published works37,41.
CAUTION: The CLD will be damaged if the NaOH trap is not properly in place when performing this assay. This is due to the corrosivity of HCl.
- Prepare standard solutions of NO3- for standard curve
- Dissolve 85 mg of NaNO3 in 10 mL of ddH2O to obtain 0.1 M NaNO3- (this solution remains stable for a few weeks).
- Use the stock solution to prepare standards by dilution in ddH2O to obtain concentrations of 5 µM, 10 µM, 20 µM, 40 µM, 80 µM, 200 µM NaNO3 in order to perform a calibration curve for plasma or urine samples (use lower concentrations if working with cell cultures).
- Prepare VCl3 (vanadium chloride) saturated solution for NO3- reduction in the purge vessel
CAUTION: The reaction of water and VCl3 is exothermic. Pay attention to high glassware temperature when adding acid and when rinsing the glassware at the end of the experiment.- Dissolve 1.6 g of VCl3 in 200 mL of 1 M HCl by first adding VCl3 in a clean flask then adding 200 mL of 1 M HCl.
- Vacuum filter the solution through filter paper (such as 11 μm filter paper, but any filter paper can be used).
NOTE: The filtered solution shall turn to clear blue, while the unfiltered VCl3 solution is brown because of undissolved particles. - Keep the saturated solution covered with either aluminum foil or polytetrafluoroethylene (PTFE) tape as the compound is light sensitive.
- Prepare the circulating water bath
- Connect a circulating water bath device to the water jacket of the purge vessel. Make sure that the lines are dry before priming.
- Start the water bath at 95 °C and verify the absence of leaks on the water lines by applying (nonadherent) paper towels around the lines.
- Set up the gas bubbler trap
- Verify that the PTFE sleeve of the bubbler is in place and that it is not damaged.
- Open the gas bubbler and inject 15 mL of 1 M NaOH into the bubbler base.
- Reposition the gas bubbler and seal the connection tightly by pressing the bottom towards the top and slightly twisting the two parts. The impossibility of turning the top of the bubbler without applying force indicates a correct seal.
- Connect the outlet of the purge vessel to the inlet of the gas bubbler trap.
4. I3- in acetic acid assay preparation
NOTE: For more details on I3- in acetic acid assay preparation, refer to previously published works15,22,38,41,42.
- Prepare standard curve for NO2-
- Prepare a stock solution by dissolving 69 mg of sodium nitrite (NaNO2) in 10 mL of ddH2O to obtain 100 mM solution. This solution is stable if stored in an airtight container, refrigerated, and protected from light.
- Serially dilute the stock solution into 1.5 mL microcentrifuge tube pre-filled with 900 μL of ddH2O: Add 100 μL of the stock solution to the first centrifuge tube, mix, label, and use 100 μL of the tube for the second tube, then repeat resulting in 10 mM, 1 mM, then 100 μM.
- Further dilute with ddH2O to obtain 50 μM, 25 μM, 10 μM, 1 μM and 500 nM NaNO2 aliquots to be used in the calibration curve.
- Prepare the I3- in acetic acid for the purge vessel (can be stored at room temperature (RT) for 1 week)22
- Add 2 g of potassium iodide (KI) and 1.3 g of iodine (I2) to 40 mL of ddH2O and 140 mL of acetic acid.
- Mix thoroughly by stirring the mixture for at least 30 min.
- Prepare the samples for differential determination of NO2-, S-nitrosothiols (S-NO-Hb, if Hb is collected) and iron-nitrosyl complexes (Hb-NO if Hb is collected) (Figure 3)
- Divide each sample in 3 aliquots of 270 μL (900 μL of Hb if measuring S-NO-Hb and Hb-NO) in light-protected microcentrifuge tubes, 2 of them pre-filled with 30 μL of 1x PBS (100 μL if measuring S-NO-Hb and Hb-NO) and the third tube with 30 μL of HgCl2 (100 μL if measuring S-NO-Hb and Hb-NO), vortex and incubate at RT for 2 min (Figure 3).
- Add 30 μL of 5% AS to the sample with HgCl2 to measure Fe-NOs, (100 μL for Hb-NO) and to one with added PBS to measure S-NOs and Fe-NOs (100 μL for S-NO-Hb and Hb-NO) and add 30 μL of PBS to the third one already pre-filled with 1x PBS to measure NO2-, S-NOs and Fe-NOs (100 μL for residual NO2- from Hb collection, S-NO and Hb-NO). Vortex and incubate at RT for 3 min (Figure 3).
5. NO consumption by cell-free Hb setup
NOTE: For more details, refer to the previously published work38.
- Prepare standard oxyHb solutions from a purified stock Hb solution with a known concentration
- Serially dilute the stock solution into 1.5 mL microcentrifuge tubes by addition of ddH2O to obtain the solutions that will be used for the calibration curve: 62 μM, 50 μM, 25 μM, 12.5 μM, 6.25 μM, 3.125 μM, 1.56 μM.
- Prepare the DETA-NONOate solution
- Add 10 mg of DETA-NONOate to 610 µL of 10 µM NaOH in pH 7.4 PBS to generate 100 mM of DETA-NONOate and keep it on ice.
6. Start the chemiluminescence detector (CLD) and prepare the purge vessel
NOTE: For the preparation of the purge vessel, refer to the previously published work43.
- Verify the main connections to and from the CLD
- Connect the oxygen line to the CLD and open the oxygen tank at a pressure that is in agreement with the CLD's manufacturer.
- Make sure that the Intense Field Dielectric (IFD) filter line is connected to the CLD but not to the purge vessel or the NaOH trap
- Start the CLD
- On the CLD interface, start running the detection program for liquid phase assays.
- Verify that the oxygen supply is adequate. If this is the case, the CLD will successfully start sampling from its inlet and indicate detection by a signal in millivolts (0-5 mV). Otherwise, the CLD will prompt a negative diagnostic signal.
- Prepare the purge vessel
- Close the purge vessel on all three ports: fully screw the needle valve to the right, close the inlet and outlet stopcocks.
- Remove the cap from the purge vessel and add a sufficient quantity of the reagent specific to the planned assay to the reaction chamber (Table 1) so that the syringe needle used to inject the samples can reach the fluid column.
- Verify the presence of a stable desired baseline (Table 1).
- Start the purge gas flow
- Ensure that the inert gas tank (e.g., N2) is equipped with a two-stage regulator and connect the inert gas tank with the gas inlet of the vessel.
- Open the gas with an outlet pressure at the regulator of 1-5 psi, open the inlet of the purge vessel and slowly open the needle valve of the purge vessel to allow inflow of gas. Verify bubbling within the purge vessel.
- Adjust the gas flow
- Record the cell pressure measured by the CLD with the IFD filter line sampling ambient air.
- Reposition the cap on the purge vessel, connect the IFD filter line to the purge vessel (or to the NaOH trap in the VCl3 in HCl assay), and open the outlet of the purge vessel.
- Use the needle valve to reach the same cell pressure at the CLD level that is recorded in ambient air.
7. Experiment
NOTE: For more details regarding the experiment, refer to the previously published work43.
- Start the chemiluminescence signal acquisition program
- Connect the serial port of the CLD to the computer's serial port into which the acquisition program has been installed.
- Run the analysis program.
- Click on Acquire, select the folder to save the .data file, type in the file name, and click on Save.
NOTE: Notice the preset run time on screen, as the recording stops automatically when the preset time elapses. If needed, the preset running time can be increased.
- Prepare for repeated sample injections
- Adjust the voltage scale on the screen to have control over the targeted baseline by clicking on the Minimum and/or Maximum buttons and then entering the desired value.
- Have a 20- or 50-mL tube filled with ddH2O to rinse the syringe between samples.
- Have a box of delicate task wipes readily available.
- Sample injection
NOTE: Start from the standard solutions for the calibration curve (inject from the least concentrated to the most concentrated samples), then proceed to the experiment samples (consider doing so in duplicates or triplicates).- Rinse the syringe at least twice or more with ddH2O before withdrawing each sample (and after each injection) and verify every time unobstructed water ejection on a task wipe.
- Insert the syringe in the sample tube while holding both the syringe and the tube at a close distance, pull up the plunger to the desired volume while ensuring no air bubble and/or non-homogenized solid parts are trapped.
- Clean the tip of the syringe with a task wiper, then insert the syringe into the septa cap at the injection port and inject after verifying that the tip of the syringe is within the liquid phase in the reaction chamber.
- Mark the injection in the software program and wait
- Verify that the injection causes an upwards change in the signal (Supplemental Figure 1) (downwards in the NO consumption by cell-free Hb assay) and type the sample name by clicking the grey box under Sample Names, then click on Mark Injection.
NOTE: Suspect syringe obstruction if the sample injection does not generate a signal. - Wait for the electric signal to reach baseline again (this usually takes 3-4 min). This time can be used to perform step 7.3.1.
- Verify that the injection causes an upwards change in the signal (Supplemental Figure 1) (downwards in the NO consumption by cell-free Hb assay) and type the sample name by clicking the grey box under Sample Names, then click on Mark Injection.
- Repeat all steps indicated in steps 7.3 and 7.4 during and after every injection until the end of the experiment. Remember to run a sample of the preservation solution (if used)
- Stop the experiment
- Click on STOP to interrupt the signal acquisition, stop the CLD and turn off the water bath (if NO3- is measured).
- Interrupt the gas flow, open the needle valve, remove the cap from the purge vessel, place a waste container under the drain and open the draining stopcock.
NOTE: If the experiment requires data acquisition for longer than 60 min, it is necessary to restart the acquisition after 60 min of running time (repeat step 7.1.3) and make a new file.
8. Measurements and calculations
NOTE: Measurements and calculations are made offline and can be performed at a different time.
- Start the chemiluminescence acquisition program for offline data analysis
- Start the program and click on Process.
- Select the experiment file, then click on Open.
- Calculate the area under the curve for each administration
- The software automatically graphs on screen the baseline (Supplemental Figure 2A, horizontal yellow line) and the peak axis of each wave generated by each sample administration (vertical yellow lines): verify their correct position (or adjust by clicking on each line and moving it with the mouse or the arrows) and click on Threshold OK (Supplemental Figure 2B).
NOTE: In the NO consumption by cell-free Hb measurement assay, the software does not typically manage to correctly capture the waveform generated by sample injection. By zooming on each waveform, the operator can easily assist the software in the area calculation (Supplemental Figure 2). - The software automatically graphs the beginning (vertical green line) and the end (vertical red line) of each peak caused by each sample administration: verify their correct position (or adjust by clicking on each line and moving it with the mouse or the arrows) and click on Integrate (Supplemental Figure 2C).
NOTE: Some areas in the trace may be mistakenly defined as injections at this point, and some peaks may be automatically counted twice. Both mistakes can be re-identified and removed during step 8.2.2 - The software automatically matches every signal area following an injection marked during the experiment and its assigned name: navigate each peak (indicated by a yellow vertical line) with the assigned name by clicking on Next Peak and Previous Peak, then click on the button All OK to finally obtain the calculation for all areas on the screen.
- In order to correct all naming or matching mistakes made by the user or by the program, use as needed the buttons indicated in Supplemental File 1.
- The software automatically graphs on screen the baseline (Supplemental Figure 2A, horizontal yellow line) and the peak axis of each wave generated by each sample administration (vertical yellow lines): verify their correct position (or adjust by clicking on each line and moving it with the mouse or the arrows) and click on Threshold OK (Supplemental Figure 2B).
- Transfer the calibration curve values to a spreadsheet and generate a linear regression equation (Supplemental Figure 3)
- Transfer the data from the CLD program to a new spreadsheet through copy-paste. Arrange the two columns on the datasheet as Sample Concentration and Area Under the Curve, and add a matched value of zero on both columns.
- Select the two columns, click on Insert > Scatter, then under the Chart Design menu, select Add Chart Element > Trendline > Linear.
- Right-click on the generated trendline, click on Format Trendline, then click the options Display Equations on Chart and Display R-squared value on Chart on the Format Trendline menu to obtain a simple linear calibration equation.
- Transfer the calculated area of each sample to calculate its concentration (Supplemental Figure 3)
- Report every value on the spreadsheet. In the next column, apply the equation obtained from step 8.3.3 to obtain the concentration of each injected sample, where y is the concentration (value of the new column) and x is the area under the curve measured after injection.
NOTE: Remember to take into account the concentration measured in the preservation solution (if used) and subtract the values accordingly.
- Report every value on the spreadsheet. In the next column, apply the equation obtained from step 8.3.3 to obtain the concentration of each injected sample, where y is the concentration (value of the new column) and x is the area under the curve measured after injection.
Results
The NO-consumption by cell-free Hb assay was used in samples containing known concentrations of cell-free oxyHb (Figure 4). As one heme of oxyHb stoichiometrically releases one NO molecule in the assay, purified cell-free oxyHb is used to build the calibration curve for the assay (Supplemental Figure 3).
The dose-response relationship between cell-free Hb (measured with a colorimetric assay) and NO consumption in patients coming off cardiopulmonar...
Discussion
Due to the high sensitivity, chemiluminescence-based assays for the determination of NO and related compounds have a high risk of NO2- contamination. Each reagent (especially the NO2- blocking solution) and dilutant (including ddH2O) used in the experiment should be tested for its NO2- content to correct for background signal. Nitrite is extremely reactive with a half-life in whole blood around 10 min and rapidly generates NO3-
Disclosures
L.B. receives salary support from K23 HL128882/NHLBI NIH as principal investigator for his work on hemolysis and nitric oxide. LB receives grants from "Fast Grants for COVID-19 research" at Mercatus Center of George Mason University and from iNO Therapeutics LLC. B.Y. is supported by grants from an NHLBI/#R21HL130956 and DOD/The Geneva Foundation (W81XWH-19-S-CCC1, Log DM190244). B.Y. received patents at MGH on the electric generation of nitric oxide.
L.B. and B.Y. have filed patent application for NO delivery in COVID-19 disease PCT application number: PCT/US2021/036269 filed on June 7, 2021. RWC receives salary support from Unitaid as the principal investigator for technology development aimed at decentralized diagnosis of tuberculosis in children located in low-resource settings.
Acknowledgements
The protocols reported in this manuscript were made possible by the accumulated contributions of previous fellows of Dr. Warren Zapol's laboratory of Anesthesia Research in Critical Care, Department of Anesthesia at Massachusetts General Hospital. We acknowledge the contribution of Drs. Akito Nakagawa, Francesco Zadek, Emanuele Vassena, Chong Lei, Yasuko Nagasaka, Ester Spagnolli and Emanuele Rezoagli.
Materials
| Name | Company | Catalog Number | Comments |
| Acetic Acid | Sigma | 45754 | 500 mL - liquid |
| Antifoam B Emulsion | Sigma | A5757 | 250 mL - liquid |
| DETA NONOate | Cayman | 82120 | 10 mg |
| Gibco DPBS (1x) no calcium, no magnesium | ThermoFisher | 14190144 | 500 mL |
| Hydroochloric Acid 37% (1 M) | Sigma | 258148 | 500 mL - liquid |
| Iodine | SAFC | 207772 | 100 g - solid |
| Kimwipes | Kimtech | 34155 | |
| Mercury (II) Chloride ACS reagent> 99.5% | Sigma | 215465 | 100 g - solid (dissolve in water) |
| Mili-Q Water Purification System | Millipore | ||
| Model 705 RN 50 μL syringe | Hamilton | 80530 | Microliter syringe |
| Model 802 N 25 μL Syringe | Hamilton | 84854 | Microliter syringe |
| N-ethylmaleimide | Sigma | 4260 | 25 g - crystalline |
| Nitric Oxide Analyzer + Bundle Software - Purge Vessel | Zysense | NOA 280i | Chemiluminescence Detector |
| Nonidet p-40 (NP-40) | ThermoFisher | 85125 | 10% - 500 mL |
| Potassium hexacyanoferrate (III) ACS reagent≥ 99% | Sigma | 244023 | 100 g - powder |
| Potassium Iodide ACS reagent> 99% | Sigma | 221945 | 100 g - solid |
| Potassium Nitrite cryst. For analysis EMSURE ACS | Supelco | 105067 | 250 g - crystalline |
| PowerGen 125 | Fisher Scientific | 14-359-251 | Mechanic Homogenizer |
| RV3 Two Stage Rotary Vane Pump | Edwards | A65201906 | Vacuum Pump - Bundled with analyzer |
| Sodium Heparin - BD Hemogard Clo | BD Biosciences | BD367871 | 75 USP Units |
| Sodium hydroxide anhydrous ACS reagent ≥ 97% | Sigma | 795429 | 1 kg - pelletts |
| Sodium Nitrate ACS reagent ≥ 99% | Sigma | 221341 | 500 g - powder |
| Sodium nitrite ≥ 99% | Sigma | S2252 | 500 g - crystalline |
| Sulfanilamide ≥ 98% | Sigma | S9251 | 100 g - solid |
| Vanadium (III) Chloride | Sigma | 112393 | 25 g - solid - Caution (exothermic) |
| Whatman 1 Filter Paper | Sigma | WHA10010155 |
References
- Palmer, R. M. J., Ferrige, A. G., Moncada, S. Nitric oxide release accounts for the biological activity of endothelium-derived relaxing factor. Nature. 327 (6122), 524-526 (1987).
- Furchgott, R. F. The discovery of endothelium-derived relaxing factor and its importance in the identification of nitric oxide. JAMA: The Journal of the American Medical Association. 276 (14), 1186 (1996).
- Ignarro, L. J., Buga, G. M., Byrns, R. E., Wood, K. S., Chaudhuri, G. Endothelium-derived relaxing factor and nitric oxide possess identical pharmacologic properties as relaxants of bovine arterial and venous smooth muscle. The Journal of Pharmacology and Experimental Therapeutics. 246 (1), 218-226 (1998).
- Arnold, W. P., Mittal, C. K., Katsuki, S., Murad, F. Nitric oxide activates guanylate cyclase and increases guanosine 3':5'-cyclic monophosphate levels in various tissue preparations. Proceedings of the National Academy of Sciences of the United States of America. 74 (8), 3203-3207 (1977).
- Hayashida, K., et al. Depletion of vascular nitric oxide contributes to poor outcomes after cardiac arrest. American Journal of Respiratory and Critical Care Medicine. 199 (10), 1288-1290 (2019).
- Ignarro, L. J. Inhaled NO and COVID-19. British Journal of Pharmacology. 177 (16), 3848-3849 (2020).
- Gantner, B. N., LaFond, K. M., Bonini, M. G. Nitric oxide in cellular adaptation and disease. Redox Biology. 34, 101550 (2020).
- Clark, R. H., et al. Low-dose nitric oxide therapy for persistent pulmonary hypertension of the newborn. New England Journal of Medicine. 342 (7), 469-474 (2000).
- Goldbart, A., et al. Inhaled nitric oxide therapy in acute bronchiolitis: A multicenter randomized clinical trial. Scientific Reports. 10 (1), (2020).
- Bangirana, P., et al. Inhaled nitric oxide and cognition in pediatric severe malaria: A randomized double-blind placebo controlled trial. PloS One. 13 (1), 0191550 (2018).
- Jiang, S., Dandu, C., Geng, X. Clinical application of nitric oxide in ischemia and reperfusion injury: A literature review. Brain Circulation. 6 (4), 248-253 (2020).
- Lei, C., et al. Nitric oxide decreases acute kidney injury and stage 3 chronic kidney disease after cardiac surgery. American Journal of Respiratory and Critical Care Medicine. 198 (10), 1279-1287 (2018).
- Kelm, M. Nitric oxide metabolism and breakdown. Biochimica et Biophysica Acta. 1411 (2-3), 273-289 (1999).
- Bryan, N. S., Grisham, M. B. Methods to detect nitric oxide and its metabolites in biological samples. Free Radical Biology and Medicine. 43 (5), 645-657 (2007).
- Macarthur, P. H., Shiva, S., Gladwin, M. T. Measurement of circulating nitrite and S-nitrosothiols by reductive chemiluminescence. Journal of Chromatography B. 851 (1-2), 93-105 (2007).
- Helms, C., Kim-Shapiro, D. B. Hemoglobin-mediated nitric oxide signaling. Free Radical Biology and Medicine. 61, 464-472 (2013).
- Kim-Shapiro, D. B., Schechter, A. N., Gladwin, M. T. Unraveling the reactions of nitric oxide, nitrite, and hemoglobin in physiology and therapeutics. Arteriosclerosis, Thrombosis, and Vascular Biology. 26 (4), 697-705 (2006).
- Rezoagli, E., et al. Pulmonary and systemic vascular resistances after cardiopulmonary bypass: role of hemolysis. Journal of Cardiothoracic and Vascular Anesthesia. 31 (2), 505-515 (2017).
- Shiva, S. Nitrite: A physiological store of nitric oxide and modulator of mitochondrial function. Redox Biology. 1 (1), 40-44 (2013).
- Lundberg, J. O., Weitzberg, E., Gladwin, M. T. The nitrate-nitrite-nitric oxide pathway in physiology and therapeutics. Nature Reviews Drug Discovery. 7 (2), 156-167 (2008).
- Heinrich, T. A., Da Silva, R. S., Miranda, K. M., Switzer, C. H., Wink, D. A., Fukuto, J. M. Biological nitric oxide signalling: chemistry and terminology. British Journal of Pharmacology. 169 (7), 1417-1429 (2013).
- Yang, B. K., Vivas, E. X., Reiter, C. D., Gladwin, M. T. Methodologies for the sensitive and specific measurement of s -nitrosothiols, iron-nitrosyls, and nitrite in biological samples. Free Radical Research. 37 (1), 1-10 (2003).
- Hayashida, K., et al. Improvement in outcomes after cardiac arrest and resuscitation by inhibition of s-nitrosoglutathione reductase. Circulation. 139 (6), 815-827 (2019).
- Rodríguez-Ortigosa, C. M., et al. Biliary secretion of S-nitrosoglutathione is involved in the hypercholeresis induced by ursodeoxycholic acid in the normal rat. Hepatology. 52 (2), 667-677 (2010).
- Mitchell, D. A., Marletta, M. A. Thioredoxin catalyzes the S-nitrosation of the caspase-3 active site cysteine. Nature Chemical Biology. 1 (3), 154-158 (2005).
- Mannick, J. B., et al. Fas-induced caspase denitrosylation. Science. 284 (5414), 651-654 (1999).
- Choi, Y. -. B., et al. Molecular basis of NMDA receptor-coupled ion channel modulation by S-nitrosylation. Nature Neuroscience. 3 (1), 15-21 (2000).
- Eu, J. P., Sun, J., Xu, L., Stamler, J. S., Meissner, G. The skeletal muscle calcium release channel: Coupled O2 sensor and NO signaling functions. Cell. 102 (4), 499-509 (2000).
- Stamler, J. S., et al. Nitric oxide circulates in mammalian plasma primarily as an S-nitroso adduct of serum albumin. Proceedings of the National Academy of Sciences of the United States of America. 89 (16), 7674-7677 (1992).
- Dunham, A. J., Barkley, R. M., Sievers, R. E. Aqueous nitrite ion determination by selective reduction and gas phase nitric oxide chemiluminescence. Analytical Chemistry. 67 (1), 220-224 (1995).
- Hogg, N., Zielonka, J., Kalyanaraman, B., Ignarro, L. J., Freeman, B. A. Detection of Nitric Oxide and Peroxynitrite in Biological Systems: A State-of-the-Art Review. Nitric Oxide (Third Edition). , 23-44 (2017).
- Gudem, M., Hazra, A. Mechanism of the chemiluminescent reaction between nitric oxide and ozone. The Journal of Physical Chemistry A. 123 (4), 715-722 (2019).
- Ishibe, Y., Liu, R., Hirosawa, J., Kawamura, K., Yamasaki, K., Saito, N. Exhaled nitric oxide level decreases after cardiopulmonary bypass in adult patients. Critical Care Medicine. 28 (12), 3823-3827 (2000).
- American Thoracic Society, European Respiratory Society. ATS/ERS recommendations for standardized procedures for the online and offline measurement of exhaled lower respiratory nitric oxide and nasal nitric oxide, 2005. American Journal of Respiratory and Critical Care Medicine. 171 (8), 912-930 (2005).
- Cuthbertson, B. H., Stott, S. A., Webster, N. R. Exhaled nitric oxide as a marker of lung injury in coronary artery bypass surgery. British Journal of Anaesthesia. 89 (2), 247-250 (2002).
- Ewing, J. F., Janero, D. R. Specific S-nitrosothiol (thionitrite) quantification as solution nitrite after vanadium(III) reduction and ozone-chemiluminescent detection. Free Radical Biology and Medicine. 25 (4-5), 621-628 (1998).
- Braman, R. S., Hendrix, S. A. Nanogram nitrite and nitrate determination in environmental and biological materials by vanadium(III) reduction with chemiluminescence detection. Analytical Chemistry. 61 (24), 2715-2718 (1989).
- Wang, X., et al. Biological activity of nitric oxide in the plasmatic compartment. Proceedings of the National Academy of Sciences of the United States of America. 101 (31), 11477-11482 (2004).
- Bryan, N. S., Rassaf, T., Rodriguez, J., Feelisch, M. Bound NO in human red blood cells: fact or artifact. Nitric Oxide. 10 (4), 221-228 (2004).
- Kida, K., Shirozu, K., Yu, B., Mandeville, J. B., Bloch, K. D., Ichinose, F. Beneficial effects of nitric oxide on outcomes after cardiac arrest and cardiopulmonary resuscitation in hypothermia-treated mice. Anesthesiology. 120 (4), 880-889 (2014).
- Gladwin, M. T., et al. S-Nitrosohemoglobin is unstable in the reductive erythrocyte environment and lacks O2/NO-linked allosteric function. The Journal of Biological Chemistry. 277 (31), 27818-27828 (2002).
- Feelisch, M., et al. and heme-nitros(yl)ation in biological tissues and fluids: implications for the fate of NO in vivo. The FASEB Journal. 16 (13), 1775-1785 (2002).
- Liu, T., et al. L-NAME releases nitric oxide and potentiates subsequent nitroglycerin-mediated vasodilation. Redox Biology. 26, 101238 (2019).
- Piknova, B., Park, J. W., Cassel, K. S., Gilliard, C. N., Schechter, A. N. Measuring nitrite and nitrate, metabolites in the nitric oxide pathway, in biological materials using the chemiluminescence method. Journal of Visualized Experiments: JoVE. (118), e54879 (2016).
- Keefer, L. K., Nims, R. W., Davies, K. M., Wink, D. A. 34;NONOates" (1-substituted diazen-1-ium-1,2-diolates) as nitric oxide donors: Convenient nitric oxide dosage forms. Methods in Enzymology. , 281-293 (1996).
- Nagababu, E., Rifkind, J. M. Measurement of plasma nitrite by chemiluminescence without interference of S-, N-nitroso and nitrated species. Free Radical Biology and Medicine. 42 (8), 1146-1154 (2007).
- Doctor, A., et al. Hemoglobin conformation couples erythrocyte S-nitrosothiol content to O2 gradients. Proceedings of the National Academy of Sciences of the United States of America. 102 (16), 5709-5714 (2005).
- Zhang, Y., Keszler, A., Broniowska, K. A., Hogg, N. Characterization and application of the biotin-switch assay for the identification of S-nitrosated proteins. Free Radical Biology and Medicine. 38 (7), 874-881 (2005).
- Davies, I. R., Zhang, X., Poole, R. K. Nitric Oxide Selective Electrodes. Methods in enzymology. , 63-95 (2008).
- Saito, J., et al. Comparison of fractional exhaled nitric oxide levels measured by different analyzers produced by different manufacturers. Journal of Asthma. 57 (11), 1216-1226 (2020).
Reprints and Permissions
Request permission to reuse the text or figures of this JoVE article
Request PermissionThis article has been published
Video Coming Soon
Copyright © 2025 MyJoVE Corporation. All rights reserved