A subscription to JoVE is required to view this content. Sign in or start your free trial.
Method Article
Following the Dynamics of Structural Variants in Experimentally Evolved Populations
In This Article
Summary
We developed a cost-effective method to follow non-single nucleotide polymorphism allele dynamics that can easily be adapted to experimental evolution frozen archives. A triplet PCR technique was coupled with automated parallel capillary electrophoresis to quantify the relative frequency of an insertion allele over the course of experimental evolution.
Abstract
Structural variants (SVs) (i.e., deletions, insertions, duplications, and inversions) are now known to play an important role in phenotypic variation, and consequently in processes such as disease determination or adaptation to a new environment. However, single-nucleotide variants receive much more attention than SVs, probably because they are easier to detect, and their phenotypic effects are easier to predict. The development of short- and long-read deep sequencing technologies have strongly improved the detection of SVs, but the quantification of their frequency from pooled sequencing (poolseq) data is still technically complex and expensive.
Here, we present a rather simple and inexpensive method, which allows researchers to follow the dynamics of SV allele frequency. As an example of application, we follow the frequency of an insertion sequence (IS) insertion in experimental evolution populations of bacteria. This method is based on the design of triplets of primers around the structural variant borders, such that the amplicons produced by amplification of the wild-type (WT) and derived alleles differ in size by at least 5%, and that their amplification efficiency is similar. The quantity of each amplicon is then determined by parallel capillary electrophoresis and normalized to a calibration curve. This method can be easily extended to the quantification of the frequency of other structural variants (deletions, duplications, and inversions) and to pool-seq approaches of natural populations, including within-patient pathogen populations.
Introduction
Structural variants (SVs) are alterations of the genomic sequence, generally affecting 50 bp or more. The four categories of described SVs are large insertions, large deletions, inversions, and duplications. Until recently, more attention has been devoted to single-nucleotide variants (SNVs) than to structural variants, in terms of their phenotypic effects and their role as genetic determinants of disease, or their contribution to adaptation. This is probably because it is easier to both detect SNVs and predict their phenotypic effects. However, short- and long-read deep sequencing technologies have strongly improved the detection of SVs, at least in single individual or clonal genomes1. In parallel, their phenotypic effects have been better characterized, and many examples of their implication as genetic determinants of human disease2,3 or adaptation to a new environment4 have been documented.
Deletions and insertions, often due to mobile genetic element (MGE) insertions, are much more disruptive than single nucleotide polymorphisms (SNPs) and lead to frameshift mutations and protein structure modifications. Deletions and MGE insertions within genes almost always result in gene inactivation, and insertions into non-coding regions can lead to repression or constitutive expression of adjacent genes when insertion sequences (ISs) contain promoter or termination sequences5. While the knockout of essential genes leads to clear detrimental effects on bacterial fitness, the loss of non-essential genes is beneficial in some cases. Despite their inherent costs, duplications can also be advantageous, and participate in adaptation as they lead to a change in gene dosage; an increase in the activity of a specific protein can be advantageous depending on the conditions6.
Microbial experimental evolution populations are usually started with clones. This initial absence of genetic diversity, combined with the "closed environment" characteristic of test tubes, leads to a very limited potential of evolution by gene gain through horizontal gene transfer and recombination. In these specific conditions, the contribution to adaptation of deletions, duplications, and intragenomic MGE insertion is particularly important; bacteria often adapt through loss-of-function mutations (mainly due to deletions or MGE insertions), affecting genes that are not useful in stable, often nutrient-rich, monoculture artificial environments7. In the longest running E. coli evolution experiment, IS150 insertions are particularly frequent amongst populations evolved after 50,000 generations, with IS elements representing 35% of mutations that reach high frequency in populations that retain their ancestral point mutation rate8.
Evolve and resequence studies couple experimental evolution and next-generation sequencing (NGS) technologies to investigate how bacteria adapt, at the phenotypic and genomic levels, to different environmental conditions and stresses, such as different carbon and energy sources, antibiotics, and osmotic stress9,10,11. These studies typically obtain genomic information on the evolved populations or clones solely at the experimental end point, and in some cases, at a number of intermediate time points12,13,14. These data provide insight into genes and pathways involved in the adaptation to a given environment, but rarely allow researchers to follow the dynamics of de novo emerging and sweeping alleles over time.
One approach to follow these dynamics is to choose a limited number of segregating alleles of interest (because of the function of the genes they affect, because they sweep in parallel in independent populations, etc.) and use amplicon sequencing to quantify the allele proportion, pooling many time points in the same sequencing run15. This method has been successfully used to follow the dynamics of small size variants (SNPs or 1 bp indels) in experimental16 and natural17 populations of microbes. However, in the case of larger indels or MGE insertions, the size difference of the amplicons induces PCR efficiency differences, which distort the relationship between read and allele proportions. In certain cases, the size difference between the two alleles is superior to the classical length of the amplicon. Here, we coupled a triplet PCR technique with automated parallel capillary electrophoresis to quantify the relative frequency of an insertion allele based on size discrimination. This approach allows the exploitation of underused experimental time points to determine the dynamics of an emerging mutant allele and to follow its frequency to fixation or loss, in a cost-effective manner. We applied this method to track emerging mutS- alleles, mutated through an IS10 insertion, providing the mutated genotype with a hypermutator phenotype.
This method requires two target alleles with a ≥5% difference in size. First, primer triplets are designed to produce similarly sized fragments, which share a common primer. Second, PCR conditions are optimized, and a calibration curve is produced using mixes of wild-type (WT) and mutant gDNA. Lastly, samples are amplified by PCR, and the relative frequency of each allele is quantified by parallel quantitative capillary electrophoresis.
Protocol
Setting up this protocol requires precise knowledge of the insertion, deletion, inversion, or duplication point within the ancestral sequence. This information is usually obtained by whole-genome sequencing (WGS) of the end or intermediate point samples. In the following protocol, the general principle for the case of an insertion mutation is given for each step, alongside a representative case where the frequency of an IS10 insertion in the mutS gene in an experimental evolution population of E. coli is followed. In this population, WGS of the endpoint population identified the insertion of a 1,329 bp IS10 between positions 2,463 and 2,471, resulting in the duplication of this insertion site. This method is applicable to the three other SV types, and the specificities of each case are given in the discussion.
1. Design of triplet primers
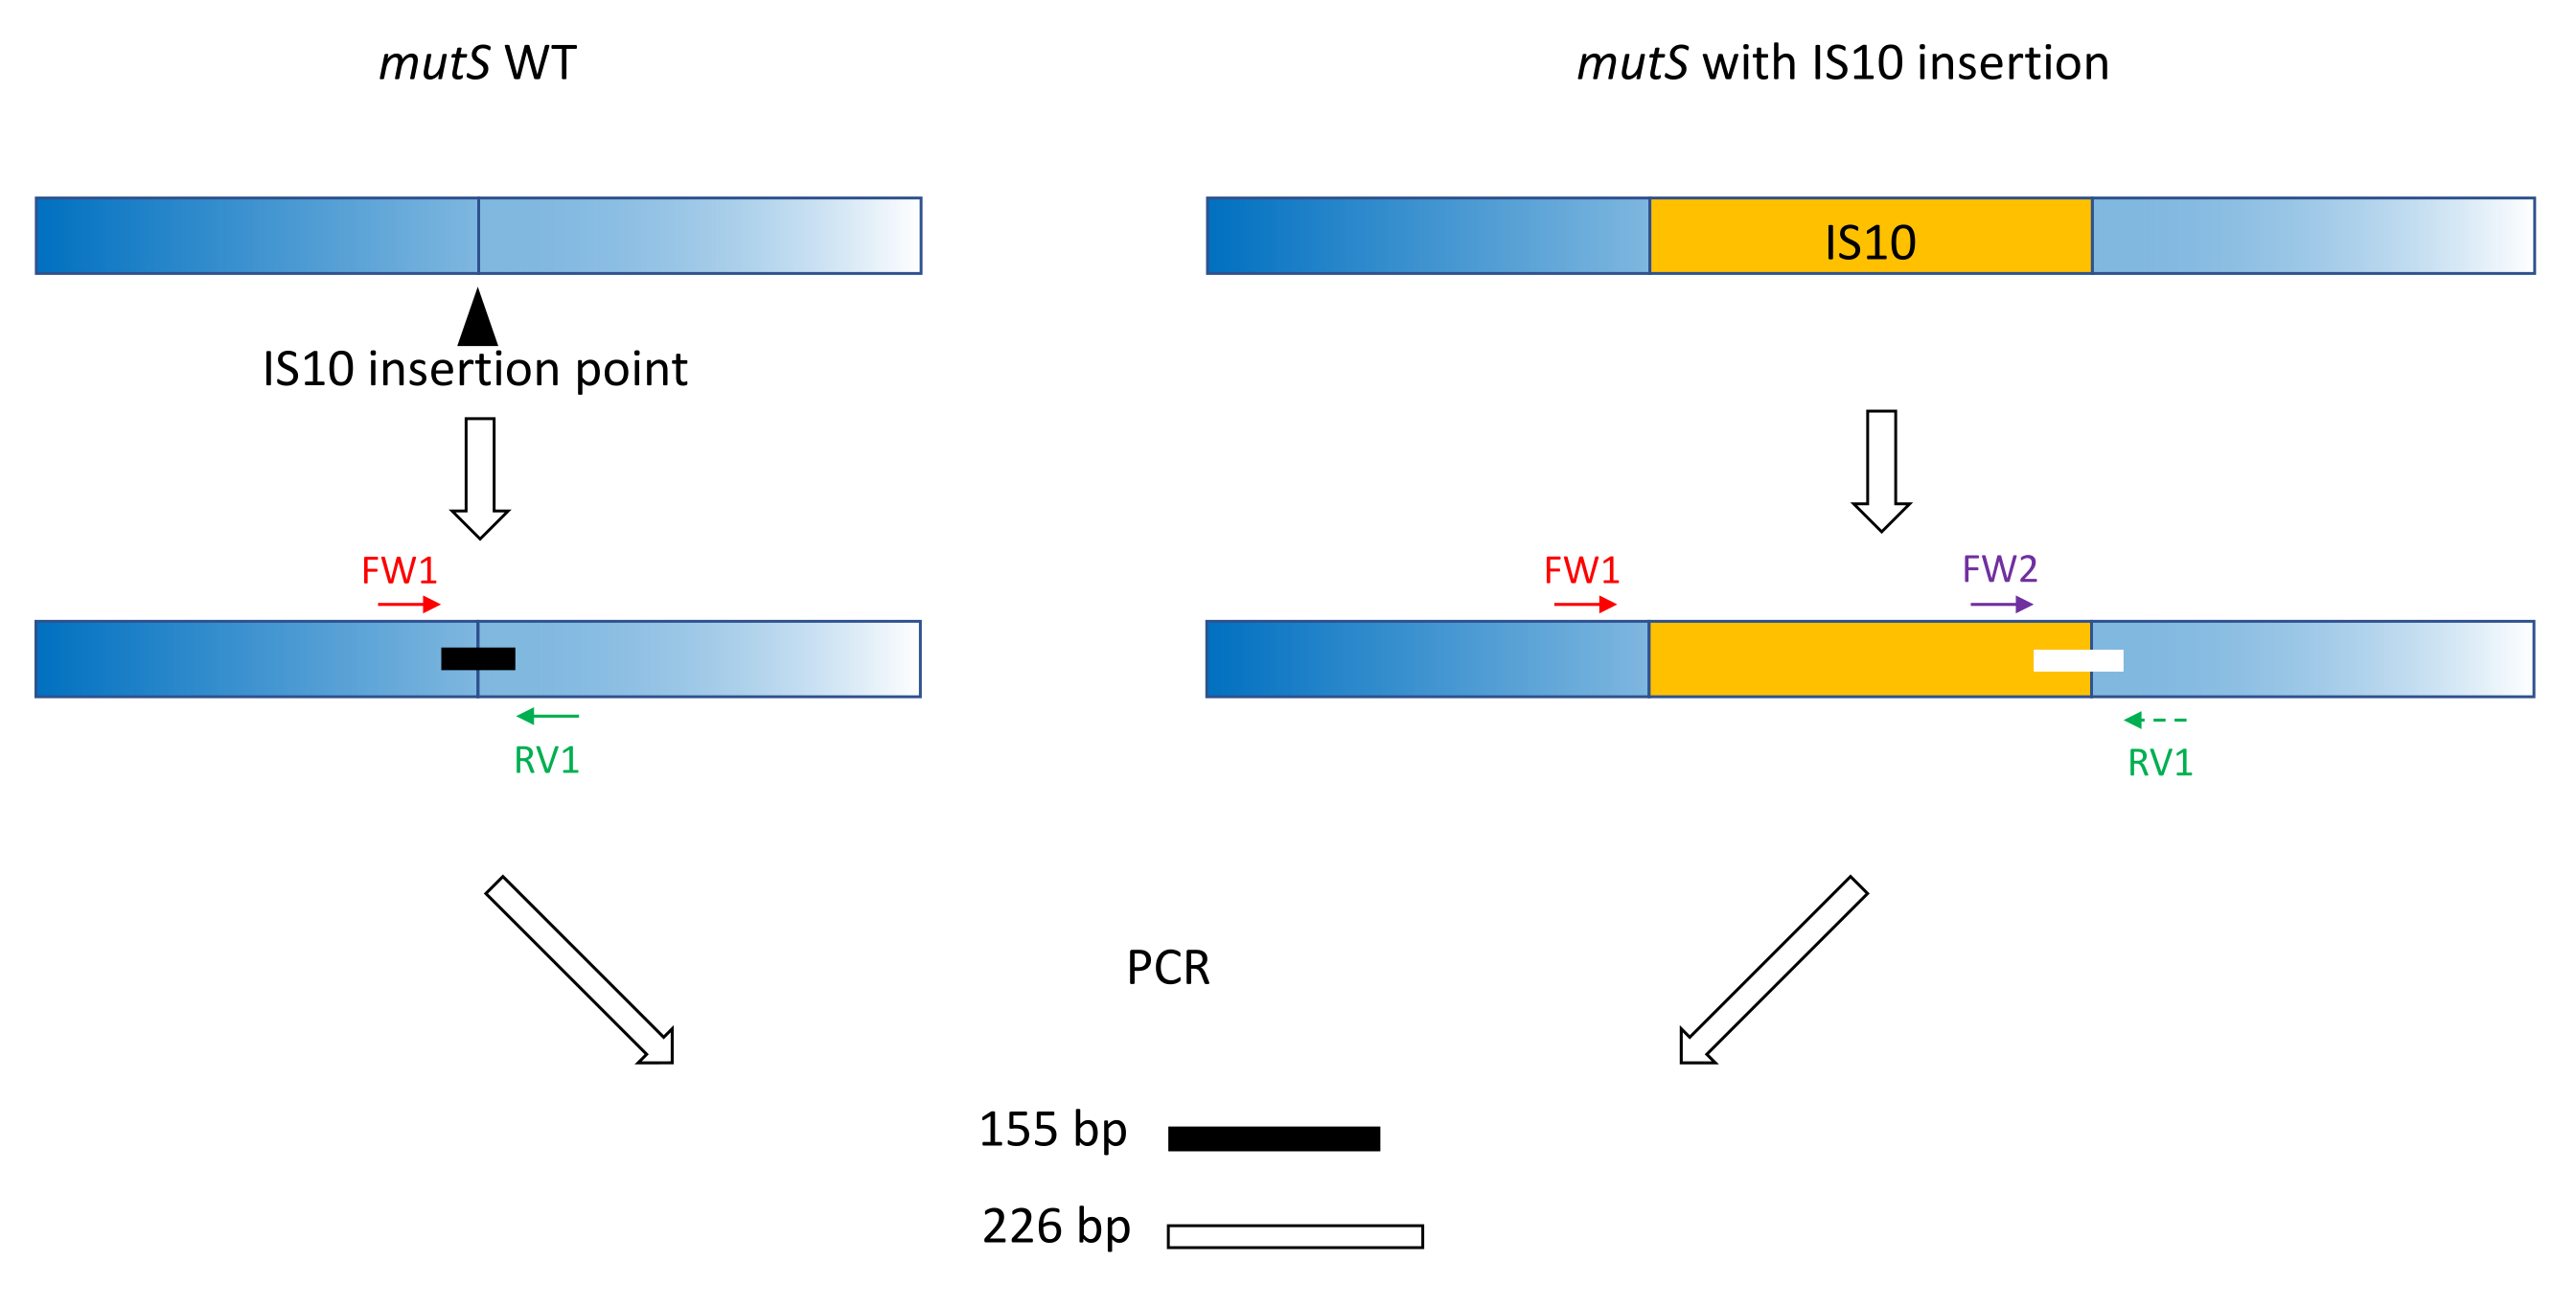
- Use classic primer design practices (18-24 bp, 40%-60% GC content, start/end with G/C pairs where possible, Tm difference < 5 °C) to produce primers FW1 and RV1. Design primers to amplify a short amplicon on the WT allele around the mutant allele insertion site (Figure 1).
NOTE: The amplicon size can range from 100 bp to up to 3,000 bp, in line with the DNA size ladder used in the capillary electrophoresis. In this example, a 155 bp amplicon was amplified. The small fragment size chosen here prevents off-target amplification of the whole IS10 insertion sequence (see section 2). - Design a second forward primer FW2 within the insertion sequence, to produce a second amplicon that is approximately 5% larger or smaller than the WT amplicon (Figure 1). This 5% size difference is the minimum size difference that the parallel capillary electrophoresis device could reliably distinguish. Therefore, design the primers such that the two amplicons have a difference in size, which is above but as close as possible to the relative threshold.
NOTE: Be sure to minimize the Tm difference and primer dimer formation. In this example, a second forward primer was designed to produce a 226 bp amplicon, 71 bp larger than the WT amplicon. In this representative example, the primer sequences are as follows:
FW1:AAAGCATTTCGCCGAACGCC
RV1: GCGATAAATCCACTCCAGCGCC
FW2: AGTTCGCTTAGGCATGGAAG

Figure 1: Schema of triplet primer design on mutS WT gene and mutant mutS IS10 insertion. The black triangle represents the IS10 insertion site in the mutS gene. The WT gene is in blue, and the IS10 is in orange. Primers FW1 and RV1 flag the IS10 insertion site and produce a 155 bp WT amplicon. The RV1 primer and the intra-IS10 primer FW2 produce a second 226 bp amplicon. Please click here to view a larger version of this figure.
2. Optimization of PCR conditions
- Grow an overnight culture of fixed WT and mutant allele clones.
- Extract the DNA using any kit.
- Quantify the DNA.
- Prepare the sample of DNA by diluting the extraction of WT and mutant DNA to 5 ng/µL. Mix the two DNA samples in a 50/50 ratio.
- Amplify 10 ng of the three DNA samples (WT, mutant, 50/50 mix) using a 2x ready-to-use PCR master mix, 0.5 µM FW1 primer, 1 µM RV1 primer, and 0.5 µM FW2 primer in a 20 µL reaction volume. Use a 2% agarose gel to migrate the PCR product by classical electrophoresis, and determine the optimal PCR conditions.
NOTE: Elongation times should be minimized to prevent formation of the FW1 and RV1 amplicon on the mutant allele. The annealing temperature should be adjusted to minimize biased amplification of the alleles and non-specific amplification.- To follow the program in this example, use the following settings: 98 °C for 10 s, followed by 25 cycles of 98 °C for 1 s, 58 °C for 15 s, 72 °C for 8 s, and a final elongation step at 72 °C for 1 min.
NOTE: The elongation time was reduced to 8 s to prevent amplification of the >1,000 bp product from the forward primer and the RV1 primer on the mutant allele (mutS with IS10 insertion).
- To follow the program in this example, use the following settings: 98 °C for 10 s, followed by 25 cycles of 98 °C for 1 s, 58 °C for 15 s, 72 °C for 8 s, and a final elongation step at 72 °C for 1 min.
3. Calibration curve
- Mix the two DNA samples, WT and mutant, in 10/90, 25/75, 40/60, 50/50, 60/40, 75/25, and 90/10 ratios.
NOTE: Biological replicates are prepared from independent overnight bacterial cultures. - Amplify using optimized PCR conditions (see section 2).
- Quantify the amplicon product.
- Dilute the PCR products to 0.1 ng/µL.
- Prepare the parallel capillary electrophoresis instrument.
- Mix fresh gel and dye (NGS quantitative analysis kit (22, 33, or 55); HS NGS fragment 1-6,000 bp for this example).
NOTE: See the parallel capillary electrophoresis HS NGS fragment guide for detailed instructions (see the Table of Materials).
- Mix fresh gel and dye (NGS quantitative analysis kit (22, 33, or 55); HS NGS fragment 1-6,000 bp for this example).
- Replace the capillary storage solution and the inlet buffer, and place the rinse buffer plate in the correct drawer locations of the parallel capillary electrophoresis instrument.
- Add 2 µL of HS diluent marker to 22 µL of each diluted sample in a 96-well plate.
- Add a size ladder (DNA size ladder; range 1-6,000 bp) from a HS NGS quantitative analysis kit to one well of the 96-well plate.
- Place the 96-well plate in the correct drawer of the parallel capillary electrophoresis instrument, and select Run on the parallel capillary electrophoresis instrument software.
- Analyze the results using the data analysis software, which detects and identifies each peak of the size ladder, assigning each peak of the samples to their known actual size.
- When using a quantitative kit, use the software to determine the DNA quantity of each fragment by integrating the area under the peak, as in chromatography data analysis. Again, compare samples with known amounts in standards to quantify each peak from a sample, and calculate the ratios between the different peaks detected in the samples.
- Construct a calibration curve (Figure 2), linking the known proportion of the mutant allele (DNA mix) to the one measured using the parallel capillary electrophoresis instrument. This calibration curve allows the reliability of the method to be evaluated and corrected for minor amplification bias.
4. Sample preparation
- Grow time point samples overnight in standard conditions.
- Extract the DNA.
- Quantify the DNA.
- Amplify the samples using optimized PCR conditions (see section 2).
- Run the samples in the parallel capillary electrophoresis instrument (see steps 3.5-3.10).
5. Allele quantification
- Extract mutant allele quantities from the parallel capillary electrophoresis instrument data with the software, and calculate the actual proportions by plotting these values on the calibration curve.
Results
Using DNA extracted from an ancestral clone and a hypermutator clone isolated from the S2.11 population at generation 1,000, we established the calibration curve shown in Figure 2. The actual mutant proportions from laboratory-prepared DNA mixes and measured by the parallel capillary electrophoresis instrument were linked by a linear relationship of slope 1.0706, with an R2 of 0.9705. Additionally, there was a good agreement between biological replicates; the standard deviation wa...
Discussion
Here, we have proposed a cost-effective method that allows the dynamics of emerging adaptive SV alleles in experimental evolution populations to be followed. This method couples classic PCR techniques and automated parallel capillary electrophoresis, allowing for the relative quantities of two alleles to be determined. Once set up, it permits the quantification of allele proportions in many samples in parallel, and is much less expensive than WGS. This method can be seen as an equivalent to amplicon sequencing for non-SN...
Disclosures
The authors have no conflicts of interest to disclose.
Acknowledgements
This work was supported by the ERC HGTCODONUSE (ERC-2015-CoG-682819) to S.B. Data used in this work were (partly) produced through the GenSeq technical facilities of the Institut des Sciences de l'Evolution de Montpellier with the support of LabEx CeMEB, an ANR "Investissements d'avenir" program (ANR-10-LABX-04-01).
Materials
| Name | Company | Catalog Number | Comments |
| 96 Well Skirted PCR Plate | 4titude | 4Ti - 0740 | PCR |
| Agarose molecular biology grade | Eurogentec | EP-0010-05 | Agarose gel electrophoresis |
| Agilent DNF-474 HS NGS Fragment Kit Quick Guide for the Fragment Analyzer Systems | Agilent | PDF instruction guide | |
| Buffer TBE | Panreac appliChem | A4228,5000Pc | Agarose gel electrophoresis |
| Calibrated Disposable Inoculating Loops and Needles | LABELIANS | 8175CSR40H | Bacterial culture |
| Dneasy Blood and Tissue Kit | Qiagen | 69506 | DNA extraction |
| Electrophoresis power supply | Amilabo | ST606T | Agarose gel electrophoresis |
| Fragment Analyzer Automated CE System | Agilent | Parallel capillary electrophoresis | |
| Fragment DNA Ladder | Agilent | DNF-396, range 1-6000bp | Parallel capillary electrophoresis |
| GENTAMICIN SULFATE SALT BIOREAGENT | Sigma-Aldrich | G1264-1G | Bacterial culture |
| High Sensitivity diluent marker | Agilent | DNF-373 | Parallel capillary electrophoresis |
| High Sensitivity NGS quantitative analysis kit | Agilent | DNF-474 | Parallel capillary electrophoresis |
| Ladder quick load 1 kb plus DNA ladder | NEB | N0469S | Agarose gel electrophoresis |
| LB Broth, VegitoneNutriSelect Plus | Millipore | 28713 | Bacterial culture |
| Master Mix PCR High Fidelity Phusion Flash | Thermo Fisher Scientific | F548L | PCR |
| Primers | Eurogentec | PCR | |
| Prosize data analysis software v.4 | Agilent | V.4 | Parallel capillary electrophoresis |
| Qubit assays | Invitrogen | MAN0010876 | DNA quantification |
| Qubit dsDNA HS Assay Kit | LIFE TECHNOLOGIES SAS | Q32854 | DNA quantification |
| Thermocycler | Eppendorf | Ep gradients | PCR |
| UVbox, eBOX VX5 | Vilber Lourmat | Agarose gel electrophoresis visualisation | |
| Water for injectable preparation | Aguettant | PROAMP | PCR |
References
- Mahmoud, M., et al. Structural variant calling: the long and the short of it. Genome Biology. 20 (1), 246 (2019).
- Bragg, D. C., et al. Disease onset in X-linked dystonia-parkinsonism correlates with expansion of a hexameric repeat within an SVA retrotransposon in TAF1. Proceedings of the National Academy of Sciences. 114 (51), 11020-11028 (2017).
- Stransky, N., Cerami, E., Schalm, S., Kim, J. L., Lengauer, C. The landscape of kinase fusions in cancer. Nature Communications. 5, 4846 (2014).
- Tenaillon, O., et al. The molecular diversity of adaptive convergence. Science. 335 (6067), 457-461 (2012).
- Vandecraen, J., Chandler, M., Aertsen, A., Van Houdt, R. The impact of insertion sequences on bacterial genome plasticity and adaptability. Critical Reviews in Microbiology. 43 (6), 709-730 (2017).
- Andersson, D. I., Gene Hughes, D. amplification and adaptive evolution in bacteria. Annual Review of Genetics. 43, 167-195 (2009).
- Bailey, S. F., Bataillon, T. Can the experimental evolution programme help us elucidate the genetic basis of adaptation in nature. Molecular Ecology. 25 (1), 203-218 (2016).
- Consuegra, J., et al. Insertion-sequence-mediated mutations both promote and constrain evolvability during a long-term experiment with bacteria. Nature Communications. 12 (1), 980 (2021).
- Burch, C. L., Romanchuk, A., Kelly, M., Wu, Y., Jones, C. D. Genome-wide determination of barriers to horizontal gene transfer. bioRxiv. , (2022).
- Slomka, S., et al. Experimental evolution of Bacillus subtilis reveals the evolutionary dynamics of horizontal gene transfer and suggests adaptive and neutral effects. Genetics. 216 (2), 543-558 (2020).
- Choudhury, D., Saini, S. Evolution of Escherichia coli in different carbon environments for 2,000 generations. Journal of Evolutionary Biology. 32 (12), 1331-1341 (2019).
- Tenaillon, O., et al. Tempo and mode of genome evolution in a 50,000-generation experiment. Nature. 536 (7615), 165-170 (2016).
- Behringer, M. G., et al. Escherichiacoli cultures maintain stable subpopulation structure during long-term evolution. Proceedings of the National Academy of Sciences. 115 (20), 4642-4650 (2018).
- Voordeckers, K., et al. Adaptation to high ethanol reveals complex evolutionary pathways. PLoS Genetics. 11 (11), 1005635 (2015).
- Levy, S. F., et al. Quantitative evolutionary dynamics using high-resolution lineage tracking. Nature. 519 (7542), 181-186 (2015).
- Bruger, E. L., Marx, C. J. A decade of genome sequencing has revolutionized studies of experimental evolution. Current Opinion in Microbiology. 45, 149-155 (2018).
- Grubaugh, N. D., et al. An amplicon-based sequencing framework for accurately measuring intrahost virus diversity using PrimalSeq and iVar. Genome Biology. 20 (1), 8 (2019).
- Bedhomme, S., et al. Evolutionary changes after translational challenges imposed by horizontal gene transfer. Genome Biology and Evolution. 11 (3), 814-831 (2019).
- Tenaillon, O., Toupance, B., Le Nagard, H., Taddei, F., Godelle, B. Mutators, population size, adaptive landscape and the adaptation of asexual populations of bacteria. Genetics. 152 (2), 485-493 (1999).
Reprints and Permissions
Request permission to reuse the text or figures of this JoVE article
Request PermissionThis article has been published
Video Coming Soon
Copyright © 2025 MyJoVE Corporation. All rights reserved